Soursop (Annona muricata L.) is a tropical fruit with high market potential, thus it has been processed into various products. This study aims to develop a low-alcohol fermented beverage from soursop using yeast. Two types of yeast strains which are Saccharomyces cerevisiae RV002 and Saccharomyces bayanus FD-3 were examined to select the more suitable strain for fermentation. Then further study was conducted to optimize the fermentation parameters, including examining the ratio of soursop juice (SJ): sugar syrup (SS) (0.5:1, 1:1 and 1.5:1) and total soluble solids (15, 17 and 19 °Brix) by One Factor at a Time (OFAT) method. Optimal conditions for fermentation were obtained with these following parameters: 106 CFU/ml of S. bayanus FD-3 added, 48 hours of fermentation at 15°C; SJ:SS ratio is 1:1, the total soluble solids is 17 °Brix, pH 4.5. The final product has 2.05 %v/v alcohol content, 13.2 °Brix, 0.4% total titratable acidity, 16.98 mg/100 ml vitamin C, 142.66 mg GAE/100 ml in terms of total phenolic content, and overall acceptability on 9-point hedonic scale was 7.82±0.33.
Soursop (Annona muricata L.) is a tropical fruit tree belonging to the family Annonaceae, genus Annona 1, widely grown in the tropical and subtropical regions of the world, including the West Indies, North and South America, Africa, the Pacific Islands and Southeast Asia 2. This fruit has short shelf life after being harvested (6 to 8 days) 3, thus it is mainly consumed as fresh fruit 4. Post-harvest techniques should be applied to ultilize fully the potential of this nutritious fruit.
Soursop is beneficial for consumer’s health due to having rich nutritional value. The fruit pulp of soursop contains a large content of carbohydrates, sugars (mainly fructose, glucose, and sucrose) and fiber 5. Soursop is also an excellent source of essential vitamins and minerals such as vitamin A, C, B1, B2, B5 and potassium. This fruit also contains significant amounts of organic acids, for example: citric acid, malic acid, and isocitric acid 6, 7. Therefore, soursop has been processed into various food products such as juice, ice cream, jam 8, vinegar 9, craft beer 10 and fermented juice (wine) 11.
Fermentation is commonly used in the beverage industry through the activation of yeast, bacteria, or microorganisms 12. Specially, low-alcohol beverages are increasing their preference among consumers and expected to continue growing in the market, as this type of drink can contribute to weight control and reduce risks from standard alcoholic products 13. Currently, fermented beverages by Saccharomyces cerevisiae are very common. This yeast strain has been successfully used in the alcoholic fermentation of mango 14, papaya 15, and dragon fruit 16 juices as well as soursop 17. Up to date, however, a small amount of research has been done on the yeast strain Saccharomyces bayanus. This yeast strain is the result of multiple hybridization events between three purebred species, S. uvarum, S. cerevisiae and S. eubayanus 18. S. bayanus is considered to be well adapted to stressful conditions such as low pH, high sugar concentration, vitamin deficiency, and high ethanol content 19. Moreover, this strain can produce low ethanol content and high volatile compounds during fermentation, making it useful in wine production 20. The application of yeast strains and research on fermentation conditions for soursop juice contributes to solving the problem of output for this perishable fruit, diversifying beverages by creating new nutritious products that are beneficial to health, while increasing income for farmers.
The aim of this work is to select a suitable yeast strain before selecting optimal fermentation parameters corresponding to the strain by varying soursop juice: sugar syrup (SJ:SS) concentration, total soluble solids content (TSS). More than that, it aims to develop low-alcohol fermented soursop juice that has good sensorial quality and is capable of retaining nutritional and bioactive compounds in soursop.
Chemicals: Enzyme Pectinex Ultra SP-L was obtained from Angel Yeast Co., Ltd (enzyme activity 60,000 U/g). Folin-Ciocalteu reagent (≥ 99.8), gallic acid (GA) (≥ 99.9%), 3,5-Dinitrosalicylic acid (≥ 98%) were supplied by Merck (Darmstadt, Germany). All other chemicals were analytical grade.
Starter culture: 2 yeast strains including Saccharomyces cerevisiae RV002 (Angel Yeast, China) and Saccharomyces bayanus FD-3 (Fermentis, France). Yeast was activated with warm water at a temperature of about 30-40°C for 15 minutes before conducting the experiment.
Raw materials: Soursop fruits (Annona muricata L.) were collected from Hau Giang, Vietnam with the similarity in terms of maturity, weight and without any defects or crushes. The evenly ripe fruits were transported from the place of collection to the laboratory within 48 hours. After being transported to the laboratory, soursop was washed, peeled, seeded and grounded. The grounded pulp is then treated with pectinase 0.8% w/v at 40ºC for 60 minutes before filtering through a filter cloth to receive pure soursop juice.
2.2. Processing of Fermented Fruit JuiceFermented soursop fruit juice was produced by alcoholic fermentation. Two yeast strains Saccharomyces cerevisiae RV002 and Saccharomyces bayanus FD-3 were assayed to perceive the more suitable strain for the production of fermented soursop juice. To prepare for alcoholic fermentation, soursop extracted juice was adjusted to achieve 15°Brix with SJ:SS ratio of 1:1 and pH 4.5, followed by pasteurization at 65oC for 15 minutes to destroy all wild yeast. The inoculation rate was 106 CFU/ml was added after activation of yeast. Fermentation was conducted at 15°C for 48 hours. Subsequently, centrifugation is conducted to separate the yeast in the pellet and collect the supernatant for pasteurization of the fermented juice at 75°C, 10 minutes. Fermentation progress was monitored by measuring total soluble solids (TSS), total titratable acid (TTA) and yeast cell density every 8 hours. After 48 hours of fermentation the ethanol content and sensory evaluation of the product were also performed concurrently. The suitable yeast strain chosen from this experiment was further studied to optimize the conditions affecting fermentation, including TSS and SJ:SS ratio.
The suitable fermentation parameters are evaluated by One Factor at a Time (OFAT) method 21 in which one tested factor in each experiment is changed while all the other factors are kept constant. The factors investigated in this experiment included TSS from 15, 17 and 19 oBrix and ratio of SJ:SS examined at 0.5:1, 1:1 and 1.5:1.
The fermentation process is similarly presented as above with the change of the one tested factor. Fermentation process was monitored by the concentration of total sugars, TSS, TTA, pH from the sample collected every 8 hours. Ethanol content, sensory evaluation of the product were examined after 48 hours. Each experiment was conducted in triplicate.
2.3. Chemical Composition AnalysisMoisture, ash, protein and fat determination were done in accordance with the methods described by AOAC (2010) 22.
Fiber content was determined using the Kirk and Sawyer method 23.
Carbohydrate concentration was determined by difference according to the formula: % carbohydrate = 100 - %moisture – %ash - %protein - %fat - %fiber 24.
The titratable acidity was carried out by a method described by AOAC (2010). 20mL distilled water was added into 5 mL of sample, then titrated with 0.1N NaOH solution using 3-4 drops of phenolphthalein as the indicator. The titration of each 25 mL solution was done when the color changed to pink and persisted 30 seconds.
The pH value was measured by pH meter (Model SI Analytics Lab Meter 845) and total soluble solids was employed by the portable refractometer.
The amount of reducing sugars was quantified by Miller's method 25. The reaction mixture contained 0.5 mL sample (diluted by distilled water) and 3 mL of DNS. The solution was then boiled (at 100°C for 5 minutes) before getting cooled down in an icy water bath for 10 minutes. The absorbance of the solution was measured by a UV–vis spectrophotometer (Model Apel PD-3000UV) at 540 nm. Glucose (0.1-1.0 g/L) was used in the standard curve.
The total sugars were determined by getting the juice sample hydrolyzed by HCl 2% (at 100℃ for 45 minutes) and then neutralization by NaOH 10% before conducting Miller’s method.
Total phenolic content was measured by the Folin-Ciocalteu method 26 with a modification. 0.2 mL of diluted soursop juice was accurately transferred to a test tube which contained 1 mL of Folin-Ciocalteu’s phenol reagent. The mixture was vortexed and incubated for 3 mins before 0.8 mL of 7.5% (w/v) Na2CO3 was added, followed by an hour reaction at room temperature in darkness. The absorbance of the solution was evaluated at the wavelength of 765 nm.The standard curve was obtained by using gallic acid in a range of 25 mg/L to 125 mg/L.
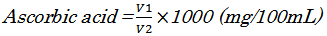
Vitamin C concentration was obtained by the iodine titration method 27. Starch indicator solution was prepared by mixing 1 g of starch with 200 mL of boiling water then left for cool. Iodine solution 0.01N was prepared by dissolving 5.00 g KI and 0.268 g KIO3 in 200 mL of distilled water before adding 30 mL of 3M H2SO4, and finally filling the volume by distilled water to 500 mL. The iodine solution was standardized by titrating against 5 mL of 1% ascorbic acid solution using 3-4 drops of 1% starch indicator solution. 5 mL juice sample was conducted in the same way. The concentration of ascorbic acid in the samples was determined as follows:
|
where V1 is titre (mL) from the titration of the sample solution, V2 is that of standard ascorbic acid solution.
Alcoholic volatile compounds in samples were separated by distillation. Ethanol content measurement was then carried out using an ebulliometer (Dujardin-Salleron, France). Ebulliometer is based on the principle that the boiling point of an alcoholic mixture is depressed compared to the boiling point of water due to the alcohol content in the alcoholic mixture 28. 50 mL of condensed liquid was filled in the ebulliometer chamber and boiled until a steady temperature. The boiling point of the distilled water obtained was used to compare with the ebulliometer disc provided with the device.
The total yeast cell count was determined using a hemocytometer counting chamber 29. The cell culture was diluted in phosphate buffered saline (PBS) to the desired concentration and positioned in a counting chamber. Each experimental stage involved at least six repeats. The viability of yeast cells was evaluated using the methylene blue staining method 29. After suspending cells in PBS, a 100 mL sample was combined with 100 mL of methylene blue and incubated at room temperature for 5 minutes. Viable cells were colorless, whereas dead cells were blue. An Olympus BX 51 microscope was used for this microscopy analysis.
The sensory analysis was carried out using untrained panelists. The fermented juice was assessed by 50 panelists of both sexes aged 18 to 28. 10 mL samples were presented in transparent glasses with a capacity of 25 mL. The evaluation sessions occurred between 9 and 10 a.m., at room temperature (30 - 32°C) and under white light. The samples were rated for overall acceptance using the 9-point hedonic scale 16. Extreme dislike = 1; very much dislike = 2; moderately dislike = 3; slightly dislike = 4; neither like nor dislike = 5; slightly like = 6; moderately like = 7; very much like = 8; and extremely like = 9.
The experiment results were expressed mean±SD (n=3). One-way ANOVA with a level of significance at 5% performed by MS Excel was used in statistical analysis.
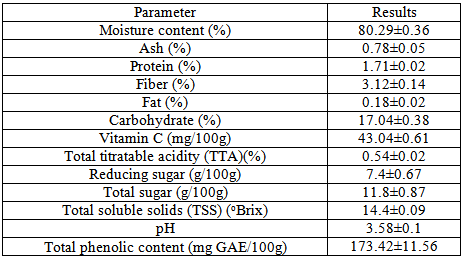
Table 1 presents the result of the nutritional and chemical compositions of soursop juice. Soursop contained 80.29% water, 0.78% ash, 1.71% protein; 0.18% fat; 3.12% fiber, and 17.04% carbohydrates, These results were in good agreement with the research of Bakr et al. (2020) 30 and De Oliveria et al. (2016) 31.
The total soluble solids were measured as 14.4±0.09 oBrix, total titratable acidity corresponded to 0.54±0.02% and the pH value was 3.58±0.1. The obtained value of total soluble solids and pH value were similar to that in the study of Zaina et al. (2024) 32, which showed that TSS in soursop was found to be 15.00±0.00 oBrix, and pH index was 3.67±0.26.
Comparing these results with those obtained by Ho et al. (2013) 33, it was observed that the total sugar content of the investigated soursop juice was similar while reducing sugar content was slightly different. The content of total sugars was determined to be 11.8±0.87 g/100g, and 7.4±0.67 g/100g in terms of reducing sugars.
The vitamin C content of soursop juice was 43.04±0.61 mg/100g, which was slightly lower than that in the study performed by Okigbo and Obire (2008) 12 (46.2±0.0 mg/100 mL). When being compared with pineapple which is a fruit rich in vitamin C (51 mg/100 mL), it indicates that soursop contains nearly the same amount of vitamin C.
Soursop's phenolic compounds function as antioxidants, deactivating free radicals that pose health concerns and lowering the probability of developing certain diseases. This fruit contains a relatively high amount of polyphenols (173.42±11.56 mg GAE/100g).
3.2. Effect of Inoculation Different Yeast Strains on the Process of Soursop Juice FermentationFigure 1 shows the results of the proximate analysis carried out on the soursop juice every 8 hours during 48 hours of fermentation. Figure 1(A) shows the decrease in TSS content during the fermentation process. During the fermentation period from 0-24 hours corresponding to the lag phase of the yeast, the TSS content decreased insignificantly, whereas the yeast strain S. cerevisiae RV002 decreased from 15.0±0.0 to 14.47±0.09 g/100mL and the S. bayanus FD-3 decreased to 14.33±0.09 g/100mL. However, there was no statistical difference between these two yeast strains in this fermentation period. From 24 to 48 hours, the yeast switched to log phase, causing the TSS to decrease significantly. Between them, the S. bayanus strain decreased the most to 11.33±0.09 g/100mL and the S. cerevisiae strain decreased more slowly to 12.13±0.09 g/100mL that was statistically different.
The fermentation process gradually increased TTA content, which had a decisive influence on the aroma and flavor of the fermented product. The initial TTA content of the fruit juice was 0.16±0.0039% and gradually increased to a value of approximately 0.3±0.0032% after 48 hours of fermentation, making no statistical difference between two yeast strains.
Regarding the factor of total viable yeast cells, Figure 1(C) shows that in the first 16 hours, the S. bayanus strain had a much greater increase in cell density than the other samples, proving that this strain was well adapted to the fermented soursop juice environment. From 24 to 48 hours, the log phase of both yeast strains occurred. After 48 hours, the cell density of the S. bayanus strain reached 1.88x10⁷ CFU/ml that was higher than that of the S. cerevisiae RV002 strain after 48 hours (1.5x10⁷ CFU/ml).
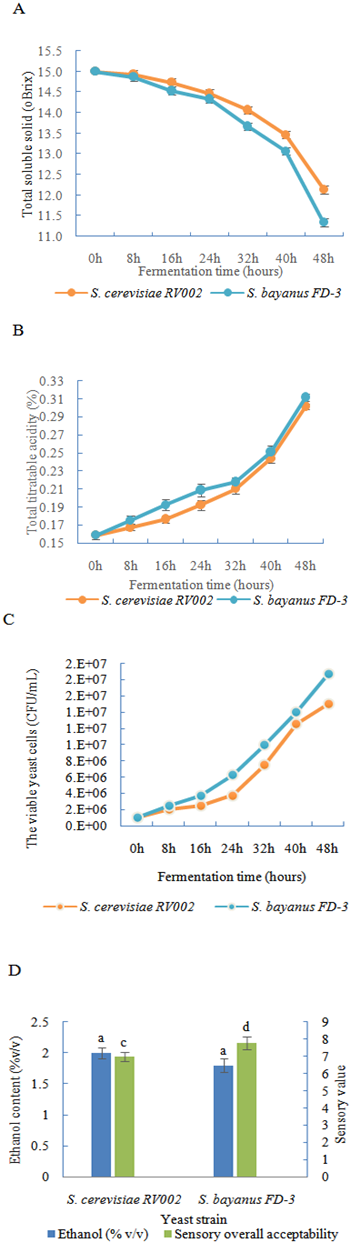
Ethanol content accumulated in these two yeast preparations during the same 48-hour fermentation period was demonstrated in Figure 1(D). S. cerevisiae RV002 had the ability to accumulate 2.0±0.09% v/v ethanol, while that of S. bayanus FD-3 was not significantly different (1.8±0.11% v/v ethanol) after 48 hours of fermentation.
From the sensory evaluation results in Figure 1(D), it shows that the S. bayanus sample had an overall acceptability of 7.78±0.37, which was significantly higher than the S. cerevisiae sample (6.98±0.28).
Through the above analysis, it can be seen that both of these yeast strains had the ability to be used to ferment soursop to create a good scent, harmonious taste and satisfactory alcohol content of the product. However, the soursop juice product fermented from strain S. bayanus has the similar ability to accumulate ethanol yet remains higher overall acceptability.
3.3. Effect of Soursop Juice : Sugar Syrup Ratio on the Process of Soursop Juice FermentationIn particular, at the SJ:SS ratio of 1.5:1, the soluble solids content decreased fastest. In particular, at the SJ:SS ratio of 1.5:1, the soluble solids content decreased most rapidly from 15 to 10.5±0.1 g/100mL after 48 hours of fermentation and was at its lowest point at the dilution ratio of 0.5:1 (11.9±0.1 g/100mL).
From Figure 2, we can see that when increasing the juice ratio, the fermentation speed was faster. In the sample with SJ:SS ratio of 0.5:1, the total sugar content decreased to 114.95±0.65 g/L, reaching the highest value compared to the other 2 dilution ratios when fermenting with yeast strains. S. bayanus. The total sugar content decreased to at least a ratio of 1.5:1, at 102.89±1.04.
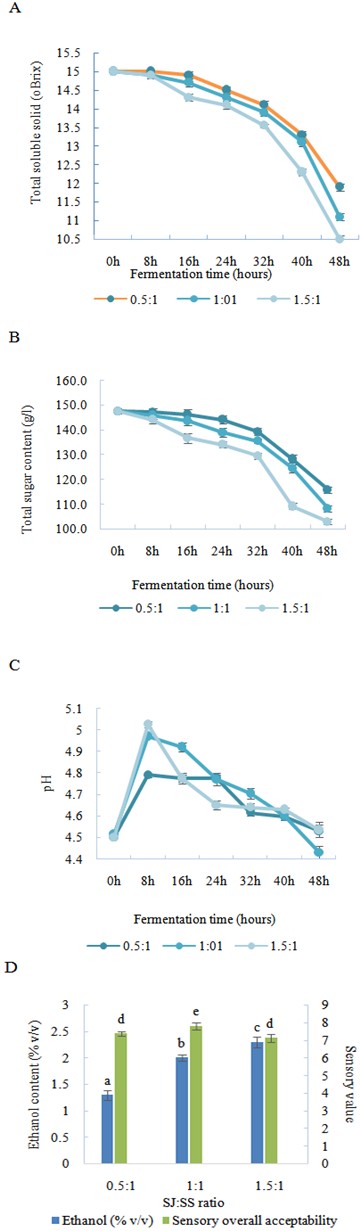
The pH index tended to decrease gradually except for the first 8 hours when the pH increased slightly. After 48 hours of fermentation, the ratio SJ:SS at 0.5:1 and 1.5:1 gave a pH value of 4.53±0.035, unchanged from the original, while with the ratio 1:1 the pH value was slightly decreased to 4.43±0.035.
From the result, it shows that the SJ:SS ratio of 1:1 was appropriate for the fermentation of soursop juice with S. bayanus strain FD-3.
3.4. Effect of Total Soluble Solids (TSS) on the Process of Soursop Juice FermentationSugar is a source of substrate for yeast to carry out the fermentation process to create alcohol, so the high or low level of ethanol produced will depend on the sugar content used in the fermented fruit juice, thus it directly affects the growth of yeast and the flavor of the product.
According to the results from Figure 3(A), after 48 hours of fermentation, the S. bayanus strain consumed 4oBrix, with no difference when adding different levels of TSS. The pH value tended to decrease, at TSS content 17 and 19 oBrix, the pH was dropped to approximately 4.22, not showing a statistically significant difference. However, in Figure 3(C), pH decreased faster in the 15 oBrix sample. After 48 hours of fermentation, the pH was 4.18±0.008.
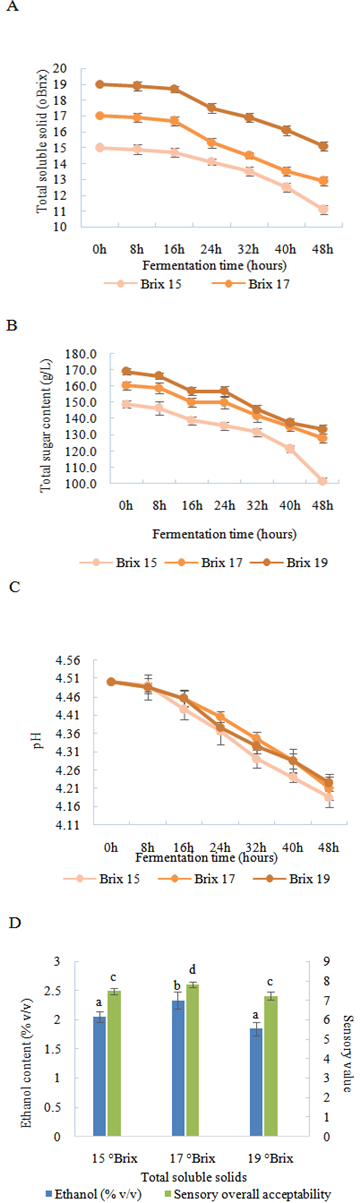
Similarly, there was no differential change in total sugar content when adjusting TSS. Samples 17 and 15 oBrix had lower total sugar content compared to 19 oBrix sample, giving a moderately sweet taste. Therefore, the sensory scores reached 7.81±0.13 and 7.46±0.15, respectively, with the higher favorability of the 17 oBrix sample.
It can be concluded that the sample of total soluble solids of 17 oBrix was the appropriate total soluble solids for the fermentation of soursop juice with S. bayanus FD-3.
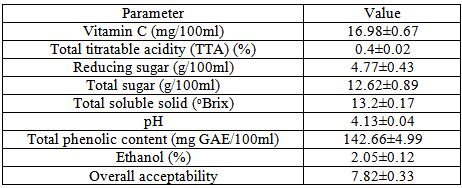
3.5. Physico-chemical Characteristics of Soursop Juice After FermentationAccording to the results from Table 2. The pH of soursop juice decreased significantly (p< 0.05) from 4.5 to 4.13±0.04 after the fermentation process. The drop in pH was caused by the generation of small quantities of acids during fermentation. Therefore, an increase in TTA was also observed to 0.4±0.02%.
TSS, total sugar and reducing sugar concentration decreased significantly (p<0.05) after fermentation. The ethanol content increased significantly to 2.05±0.12. This demonstrates the successful conversion of soursop juice to fermented one using S. bayanus FD-3.
Alcoholic fermentation has been reported to increase the metabolism of phenolic compounds so that a decrease in phenolic content occurs. This may increase antioxidant activity according to some of other studies including Ho et al. (2019) 33 and Pérez-Gregorio et al. (2011) 34.
Fermented soursop juice by S. bayanus FD-3 from the soursop materials (with TSS of 14.4 °Brix, pH 3.58, 43.04 mg/100g vitamin C, TTA of 0.54% and total phenolic content of 173.42 mg GAE/100g) was successfully produced. Between two examined yeast strains, S. bayanus FD-3 has a better impact on sugar consumption and alcohol production during the fermentation process accompanying a higher overall acceptability of 7.78±0.37. The suitable conditions for fermentation were established as SJ:SS ratio of 1:1 and TSS of 17 °Brix; pH 4.5; 106 CFU/ml yeast inoculation rate and 48-hour fermentation time at 15°C. Under these suitable fermentation conditions, the final product achieved 2.05 %v/v alcohol content with remaining sugar content of 13.2 °Brix, TTA of 0.4%, vitamin C concentration of 16.98 mg/100ml and total phenolic content of 142.66 mg GAE/100 ml. The sensory quality of the fermented juice was approved based on the results of the hedonic test with a score of 7.82/9.00.
The authors gratefully acknowledge Hanoi University of Science and Technology (HUST) for facilitating this study and research team for the support.
This research is funded by Hanoi University of Science and Technology (HUST) under project number T2022-PC-099.
The authors declare no conflict of interest.
SJ: soursop juice
SS: sugar syrup
TSS: total soluble solids
TTA: total titratable acid
GAE: gallic acid equivalent
| [1] | A. C. de Q. Pinto et al., Annona species. International Centre for Underutilised Crops, University of Southampton, 2005. | ||
| In article | |||
| [2] | P. Padmanabhan and G. Paliyath, “Annonaceous Fruits,” Encyclopedia of Food and Health, pp. 169–173, Jan. 2016. | ||
| In article | View Article | ||
| [3] | C. Julio Márquez Cardozo and J. Régulo Cartagena Valenzuela, “Physico-chemical properties of the soursop fruit (Annona muricata L. cv. Elita) in postharvest,” 2012. | ||
| In article | View Article | ||
| [4] | G. Berumen-Varela, M. A. Hernández-Oñate, and M. E. Tiznado-Hernández, “Utilization of biotechnological tools in soursop (Annona muricata L.),” Scientia Horticulturae, vol. 245. Elsevier B.V., pp. 269–273, Feb. 09, 2019. | ||
| In article | View Article | ||
| [5] | S. B. Patel and J. Patel, “A review on a miracle fruits of Annona muricata,” J Pharmacogn Phytochem, 2016. | ||
| In article | |||
| [6] | S. Z. Moghadamtousi, M. Fadaeinasab, S. Nikzad, G. Mohan, H. M. Ali, and H. A. Kadir, “Annona muricata (Annonaceae): A Review of Its Traditional Uses, Isolated Acetogenins and Biological Activities,” Int J Mol Sci, vol. 16, no. 7, pp. 15625–15658, Jul. 2015. | ||
| In article | View Article | ||
| [7] | S. B. Sanusi and M. F. Abu Bakar, “Soursop—Annona muricata,” in Exotic Fruits Reference Guide, Elsevier, 2018, pp. 391–395. | ||
| In article | View Article | ||
| [8] | I. L. Santos, A. M. da C. Rodrigues, E. R. Amante, and L. H. M. da Silva, “Soursop (Annona muricata) Properties and Perspectives for Integral Valorization,” Foods, vol. 12, no. 7. MDPI, Apr. 01, 2023. | ||
| In article | View Article | ||
| [9] | C. W. Ho et al., “Functional beverage production using acetous fermentation of soursop: Physicochemical, toxicity and organoleptic properties,” Food Biosci, vol. 39, Feb. 2021. | ||
| In article | View Article | ||
| [10] | M. A. da Silva Santos, P. V. L. Ribeiro, C. P. Andrade, A. R. G. Machado, P. G. de Souza, and L. de Souza Kirsch, “Physicochemical And Sensory Analysis Of Craft Beer Made With Soursop (Annona muricata L.),” Acta Sci Pol Technol Aliment, vol. 20, no. 1, pp. 103–112, 2021. | ||
| In article | View Article | ||
| [11] | C. W. Ho, A. Lazim, S. Fazry, U. K. H. Hussain Zaki, S. Massa, and S. J. Lim, “Alcoholic fermentation of soursop (Annona muricata) juice via an alternative fermentation technique,” J Sci Food Agric, vol. 100, no. 3, pp. 1012–1021, Feb. 2020. | ||
| In article | View Article | ||
| [12] | R. N. Okigbo and O. Obire, “Mycoflora and production of wine from fruits of soursop (Annona muricata L.),” International Journal of Wine Research, vol. 1, no. 1, pp. 1–9, 2008. | ||
| In article | View Article | ||
| [13] | T. Bucher, K. Deroover, and C. Stockley, “Low-alcohol wine: A narrative review on consumer perception and behaviour,” Beverages, vol. 4, no. 4. MDPI AG, Dec. 01, 2018. | ||
| In article | View Article | ||
| [14] | L. V. A. Reddy and O. V. S. Reddy, “Effect of fermentation conditions on yeast growth and volatile composition of wine produced from mango (Mangifera indica L.) fruit juice,” Food and Bioproducts Processing, vol. 89, no. 4, pp. 487–491, Oct. 2011. | ||
| In article | View Article | ||
| [15] | P. R. Lee, Y. L. Ong, B. Yu, P. Curran, and S. Q. Liu, “Profile of volatile compounds during papaya juice fermentation by a mixed culture of Saccharomyces cerevisiae and Williopsis saturnus,” Food Microbiol, vol. 27, no. 7, pp. 853–861, Oct. 2010. | ||
| In article | View Article | ||
| [16] | P. T. Huan, N. M. Hien, and N. H. T. Anh, “Optimization of alcoholic fermentation of dragon fruit juice using response surface methodology,” Food Res, vol. 4, no. 5, pp. 1529–1536, Oct. 2020. | ||
| In article | View Article | ||
| [17] | N. Minh, “Production of Fermented Beverage from Soursop Fruit,” 2015. | ||
| In article | |||
| [18] | D. Libkind et al., “Microbe domestication and the identification of the wild genetic stock of lager-brewing yeast,” Proc Natl Acad Sci U S A, vol. 108, no. 35, pp. 14539–14544, Aug. 2011. | ||
| In article | View Article | ||
| [19] | C. Belloch, S. Orlic, E. Barrio, and A. Querol, “Fermentative stress adaptation of hybrids within the Saccharomyces sensu stricto complex,” Int J Food Microbiol, vol. 122, no. 1–2, pp. 188–195, Feb. 2008. | ||
| In article | View Article | ||
| [20] | A. Serra, P. Strehaiano, and P. Taillandier, “Influence of temperature and pH on Saccharomyces bayanus var. uvarum growth; impact of a wine yeast interspecific hybridization on these parameters,” Int J Food Microbiol, vol. 104, no. 3, pp. 257–265, Oct. 2005. | ||
| In article | View Article | ||
| [21] | D. D. Frey and H. Wang, “Adaptive one-factor-at-a-time experimentation and expected value of improvement,” Technometrics, vol. 48, no. 3, pp. 418–431, Aug. 2006. | ||
| In article | View Article | ||
| [22] | Association of Official Analytical Chemist (AOAC), “Official Methods of Analysis,” 2010. | ||
| In article | |||
| [23] | R. S. Kirk, Ronald. Sawyer, and H. Egan, “Pearson’s Composition and Analysis of Foods.,” p. 708, 1991. | ||
| In article | |||
| [24] | I. E. Mbaeyi-Nwaoha and C. N. Ajumobi, “Production and microbial evaluation of table wine from tamarind (Tamarindus indica) and soursop (Annona muricata),” J Food Sci Technol, vol. 52, no. 1, pp. 105–116, Jan. 2015. | ||
| In article | View Article | ||
| [25] | A. V. Gusakov, E. G. Kondratyeva, and A. P. Sinitsyn, “Comparison of Two Methods for Assaying Reducing Sugars in the Determination of Carbohydrase Activities,” Int J Anal Chem, vol. 2011, pp. 1–4. | ||
| In article | View Article | ||
| [26] | M. Obanda, P. O. Owuor, and S. J. Taylor, “Flavanol Composition and Caffeine Content of Green Leaf as Quality Potential Indicators of Kenyan Black Teas,” J Sci Food Agric, vol. 74, pp. 209–215, 1997. | ||
| In article | View Article | ||
| [27] | N. T. Hanh et al., “Removal of tannins from cashew (Anacardium occidentale L.) apple juice in Binh Phuoc (Viet Nam) by using enzymatic method,” Journal of Law and Sustainable Development, 2023. | ||
| In article | View Article | ||
| [28] | M. Trejo, P. Bhuyar, Y. Unpaprom, N. Dussadee, and R. Ramaraj, “Advancement of fermentable sugars from fresh elephant ear plant weed for efficient bioethanol production,” Environ Dev Sustain, vol. 24, no. 5, pp. 7377–7387, May 2022. | ||
| In article | View Article | ||
| [29] | M. Atanasova, G. Yordanova, R. Nenkova, Y. Ivanov, T. Godjevargova, and D. Dinev, “Brewing yeast viability measured using a novel fluorescent dye and image cytometer,” Biotechnology & Biotechnological Equipment, vol. 33, no. 1, pp. 548–558, Jan. 2019. | ||
| In article | View Article | ||
| [30] | I. A. Bakr, F. El-Gazzar, N. H. Gomah, T. Mohamed, and A. Moneeb, “Characteristics of sweet acidophilus milk fortified with graviola (Annona muricata) juice,” 2020. | ||
| In article | |||
| [31] | E. N. A. De Oliveira, D. D. C. Santos, Y. M. G. Dos Santos, P. R. Buchweitz, and J. P. Gomes, “Soursop liquor processing: influence of the process variables on the physical and chemical characteristics,” Revista Caatinga, vol. 29, no. 1, pp. 246–256, Jan. 2016. | ||
| In article | View Article | ||
| [32] | N. S. M. Zaini, R. N. Ng, K. J. D. Abedelazeez, H. Idris, and M. H. A. Rahim, “The Nutritional, Physico-chemical, and Antioxidant Changes during the Production of Soursop Vinegar Influenced by Yeast and Aeration,” Pertanika J Trop Agric Sci, vol. 47, no. 1, pp. 177–189, Feb. 2024. | ||
| In article | View Article | ||
| [33] | C. Ho et al., “Alcoholic fermentation of soursop (Annona muricata) juice through alternative fermentation technique,” Journal of the Science of Food and Agriculture, 2019. | ||
| In article | View Article | ||
| [34] | M. R. Pérez-Gregorio, J. Regueiro, E. Alonso-González, L. M. Pastrana-Castro, and J. Simal-Gándara, “Influence of alcoholic fermentation process on antioxidant activity and phenolic levels from mulberries (Morus nigra L.),” LWT - Food Science and Technology, vol. 44, no. 8, pp. 1793–1801, Oct. 2011. | ||
| In article | View Article | ||
Published with license by Science and Education Publishing, Copyright © 2024 Thi Hanh Nguyen, Ngoc Cham Nguyen, Thi Trang Nguyen and Van Hung Nguyen
![]() This work is licensed under a Creative Commons Attribution 4.0 International License. To view a copy of this license, visit
https://creativecommons.org/licenses/by/4.0/
This work is licensed under a Creative Commons Attribution 4.0 International License. To view a copy of this license, visit
https://creativecommons.org/licenses/by/4.0/
| [1] | A. C. de Q. Pinto et al., Annona species. International Centre for Underutilised Crops, University of Southampton, 2005. | ||
| In article | |||
| [2] | P. Padmanabhan and G. Paliyath, “Annonaceous Fruits,” Encyclopedia of Food and Health, pp. 169–173, Jan. 2016. | ||
| In article | View Article | ||
| [3] | C. Julio Márquez Cardozo and J. Régulo Cartagena Valenzuela, “Physico-chemical properties of the soursop fruit (Annona muricata L. cv. Elita) in postharvest,” 2012. | ||
| In article | View Article | ||
| [4] | G. Berumen-Varela, M. A. Hernández-Oñate, and M. E. Tiznado-Hernández, “Utilization of biotechnological tools in soursop (Annona muricata L.),” Scientia Horticulturae, vol. 245. Elsevier B.V., pp. 269–273, Feb. 09, 2019. | ||
| In article | View Article | ||
| [5] | S. B. Patel and J. Patel, “A review on a miracle fruits of Annona muricata,” J Pharmacogn Phytochem, 2016. | ||
| In article | |||
| [6] | S. Z. Moghadamtousi, M. Fadaeinasab, S. Nikzad, G. Mohan, H. M. Ali, and H. A. Kadir, “Annona muricata (Annonaceae): A Review of Its Traditional Uses, Isolated Acetogenins and Biological Activities,” Int J Mol Sci, vol. 16, no. 7, pp. 15625–15658, Jul. 2015. | ||
| In article | View Article | ||
| [7] | S. B. Sanusi and M. F. Abu Bakar, “Soursop—Annona muricata,” in Exotic Fruits Reference Guide, Elsevier, 2018, pp. 391–395. | ||
| In article | View Article | ||
| [8] | I. L. Santos, A. M. da C. Rodrigues, E. R. Amante, and L. H. M. da Silva, “Soursop (Annona muricata) Properties and Perspectives for Integral Valorization,” Foods, vol. 12, no. 7. MDPI, Apr. 01, 2023. | ||
| In article | View Article | ||
| [9] | C. W. Ho et al., “Functional beverage production using acetous fermentation of soursop: Physicochemical, toxicity and organoleptic properties,” Food Biosci, vol. 39, Feb. 2021. | ||
| In article | View Article | ||
| [10] | M. A. da Silva Santos, P. V. L. Ribeiro, C. P. Andrade, A. R. G. Machado, P. G. de Souza, and L. de Souza Kirsch, “Physicochemical And Sensory Analysis Of Craft Beer Made With Soursop (Annona muricata L.),” Acta Sci Pol Technol Aliment, vol. 20, no. 1, pp. 103–112, 2021. | ||
| In article | View Article | ||
| [11] | C. W. Ho, A. Lazim, S. Fazry, U. K. H. Hussain Zaki, S. Massa, and S. J. Lim, “Alcoholic fermentation of soursop (Annona muricata) juice via an alternative fermentation technique,” J Sci Food Agric, vol. 100, no. 3, pp. 1012–1021, Feb. 2020. | ||
| In article | View Article | ||
| [12] | R. N. Okigbo and O. Obire, “Mycoflora and production of wine from fruits of soursop (Annona muricata L.),” International Journal of Wine Research, vol. 1, no. 1, pp. 1–9, 2008. | ||
| In article | View Article | ||
| [13] | T. Bucher, K. Deroover, and C. Stockley, “Low-alcohol wine: A narrative review on consumer perception and behaviour,” Beverages, vol. 4, no. 4. MDPI AG, Dec. 01, 2018. | ||
| In article | View Article | ||
| [14] | L. V. A. Reddy and O. V. S. Reddy, “Effect of fermentation conditions on yeast growth and volatile composition of wine produced from mango (Mangifera indica L.) fruit juice,” Food and Bioproducts Processing, vol. 89, no. 4, pp. 487–491, Oct. 2011. | ||
| In article | View Article | ||
| [15] | P. R. Lee, Y. L. Ong, B. Yu, P. Curran, and S. Q. Liu, “Profile of volatile compounds during papaya juice fermentation by a mixed culture of Saccharomyces cerevisiae and Williopsis saturnus,” Food Microbiol, vol. 27, no. 7, pp. 853–861, Oct. 2010. | ||
| In article | View Article | ||
| [16] | P. T. Huan, N. M. Hien, and N. H. T. Anh, “Optimization of alcoholic fermentation of dragon fruit juice using response surface methodology,” Food Res, vol. 4, no. 5, pp. 1529–1536, Oct. 2020. | ||
| In article | View Article | ||
| [17] | N. Minh, “Production of Fermented Beverage from Soursop Fruit,” 2015. | ||
| In article | |||
| [18] | D. Libkind et al., “Microbe domestication and the identification of the wild genetic stock of lager-brewing yeast,” Proc Natl Acad Sci U S A, vol. 108, no. 35, pp. 14539–14544, Aug. 2011. | ||
| In article | View Article | ||
| [19] | C. Belloch, S. Orlic, E. Barrio, and A. Querol, “Fermentative stress adaptation of hybrids within the Saccharomyces sensu stricto complex,” Int J Food Microbiol, vol. 122, no. 1–2, pp. 188–195, Feb. 2008. | ||
| In article | View Article | ||
| [20] | A. Serra, P. Strehaiano, and P. Taillandier, “Influence of temperature and pH on Saccharomyces bayanus var. uvarum growth; impact of a wine yeast interspecific hybridization on these parameters,” Int J Food Microbiol, vol. 104, no. 3, pp. 257–265, Oct. 2005. | ||
| In article | View Article | ||
| [21] | D. D. Frey and H. Wang, “Adaptive one-factor-at-a-time experimentation and expected value of improvement,” Technometrics, vol. 48, no. 3, pp. 418–431, Aug. 2006. | ||
| In article | View Article | ||
| [22] | Association of Official Analytical Chemist (AOAC), “Official Methods of Analysis,” 2010. | ||
| In article | |||
| [23] | R. S. Kirk, Ronald. Sawyer, and H. Egan, “Pearson’s Composition and Analysis of Foods.,” p. 708, 1991. | ||
| In article | |||
| [24] | I. E. Mbaeyi-Nwaoha and C. N. Ajumobi, “Production and microbial evaluation of table wine from tamarind (Tamarindus indica) and soursop (Annona muricata),” J Food Sci Technol, vol. 52, no. 1, pp. 105–116, Jan. 2015. | ||
| In article | View Article | ||
| [25] | A. V. Gusakov, E. G. Kondratyeva, and A. P. Sinitsyn, “Comparison of Two Methods for Assaying Reducing Sugars in the Determination of Carbohydrase Activities,” Int J Anal Chem, vol. 2011, pp. 1–4. | ||
| In article | View Article | ||
| [26] | M. Obanda, P. O. Owuor, and S. J. Taylor, “Flavanol Composition and Caffeine Content of Green Leaf as Quality Potential Indicators of Kenyan Black Teas,” J Sci Food Agric, vol. 74, pp. 209–215, 1997. | ||
| In article | View Article | ||
| [27] | N. T. Hanh et al., “Removal of tannins from cashew (Anacardium occidentale L.) apple juice in Binh Phuoc (Viet Nam) by using enzymatic method,” Journal of Law and Sustainable Development, 2023. | ||
| In article | View Article | ||
| [28] | M. Trejo, P. Bhuyar, Y. Unpaprom, N. Dussadee, and R. Ramaraj, “Advancement of fermentable sugars from fresh elephant ear plant weed for efficient bioethanol production,” Environ Dev Sustain, vol. 24, no. 5, pp. 7377–7387, May 2022. | ||
| In article | View Article | ||
| [29] | M. Atanasova, G. Yordanova, R. Nenkova, Y. Ivanov, T. Godjevargova, and D. Dinev, “Brewing yeast viability measured using a novel fluorescent dye and image cytometer,” Biotechnology & Biotechnological Equipment, vol. 33, no. 1, pp. 548–558, Jan. 2019. | ||
| In article | View Article | ||
| [30] | I. A. Bakr, F. El-Gazzar, N. H. Gomah, T. Mohamed, and A. Moneeb, “Characteristics of sweet acidophilus milk fortified with graviola (Annona muricata) juice,” 2020. | ||
| In article | |||
| [31] | E. N. A. De Oliveira, D. D. C. Santos, Y. M. G. Dos Santos, P. R. Buchweitz, and J. P. Gomes, “Soursop liquor processing: influence of the process variables on the physical and chemical characteristics,” Revista Caatinga, vol. 29, no. 1, pp. 246–256, Jan. 2016. | ||
| In article | View Article | ||
| [32] | N. S. M. Zaini, R. N. Ng, K. J. D. Abedelazeez, H. Idris, and M. H. A. Rahim, “The Nutritional, Physico-chemical, and Antioxidant Changes during the Production of Soursop Vinegar Influenced by Yeast and Aeration,” Pertanika J Trop Agric Sci, vol. 47, no. 1, pp. 177–189, Feb. 2024. | ||
| In article | View Article | ||
| [33] | C. Ho et al., “Alcoholic fermentation of soursop (Annona muricata) juice through alternative fermentation technique,” Journal of the Science of Food and Agriculture, 2019. | ||
| In article | View Article | ||
| [34] | M. R. Pérez-Gregorio, J. Regueiro, E. Alonso-González, L. M. Pastrana-Castro, and J. Simal-Gándara, “Influence of alcoholic fermentation process on antioxidant activity and phenolic levels from mulberries (Morus nigra L.),” LWT - Food Science and Technology, vol. 44, no. 8, pp. 1793–1801, Oct. 2011. | ||
| In article | View Article | ||


