This paper discusses the influence and effectiveness of R programming on senior high school students’ data analysis performance and statistical anxiety. The data analysis using R was performed in RStudio – an integrated development environment for R. A pretest-posttest quasi-experimental control group design was employed in this study. During the intervention phase, the teacher employed R programming as the proposed strategy for the experimental group, where students performed data visualization, descriptive analysis, hypothesis testing, modelling, and data interpretation, as opposed to the conventional teaching method used in the control group. A delayed posttest was then administered to compare the data analysis performance and statistical anxiety of the control group and experimental group. One-way analysis of covariance (ANCOVA) revealed that there is a significant improvement in data analysis performance and a significant reduction in statistical anxiety among students in the experimental group as compared to students in the control group. The implications of this study will be useful for research educators, as R programming may be used to promote senior high school students’ data analysis performance in quantitative research.
Teaching and learning process has evolved overtime. Its accelerating change has call educators in innovating classroom instructions and strategies to cater to the learning demands of today's digital native learners. Technology-enhanced learning significantly transformed traditional classrooms by strategically integrating and incorporating technology to improve, amplify, and/or enrich learning processes. It encompasses a wide range of methodologies such as online courses, digital simulations, interactive apps, and virtual environments to name a few. In fact, results of the 2018 Programme for International Student Assessment (PISA) underscored the importance of technology in student's learning. Globally, students performed better overall in schools where there were sufficient number of devices connected to fast internet service, enough software and online support resources, and teachers with the training, experience, and time to incorporate digital devices into the classroom 1.
The Philippines' positive administrator attitude score 2, as noted in UNESCO's 2023 GEM Report, suggests the country is adopting and using technology in curriculum and school management 3. This means that the use of technology in promoting learning is significant, as it enhances access to information 4, supports personalized instruction 5, increases student engagement 6, fosters collaboration 7, and equips learners with essential digital skills for the future 8.
However, in the long run, this indicator is not enough to ensure learning success. It is critical, on a regular cycle, that institutions should re-examine and improve classroom instructions in meeting student's demands in flexibility and accessibility, and taking the potential of technology use in to enhance students' learning experiences 9.
Challenges in the Data Analysis Classroom
For many students, especially for the senior high school, data analysis is often a daunting task in particular to quantitative research. As students engage with data analysis tasks, they frequently encounter challenges both affecting their performance and psychological well-being 10. These two critical challenges in a data analysis classroom are data analysis performance and statistical anxiety. Understanding these challenges and exploring how technology might help alleviate them is vital to enhancing learning outcomes in data analysis.
Data analysis performance refers to students’ ability to effectively apply statistical methods in interpreting and presenting data. Many high school students struggle with data analysis 11, in particular when it involves unfamiliar concepts like hypothesis testing, regression analysis, or the utilization of statistical software. This difficulty often stems from the abstract nature of quantitative research methods and the cognitive demands they place on learners. Students may face cognitive overload when they are required to understand both the statistical theory and its practical application, at which might impair their performance 12, 13. Additionally, a lack of prior exposure to these concepts might lead to errors in data interpretation and analysis, which can negatively affect performance.
Statistical anxiety is another significant challenge in the data analysis classroom 14. This refers to the fear or apprehension that students experience when confronted with statistical or data analysis related tasks. Students often feel this form of anxiety particularly those who were struggling with mathematics or have limited successful prior experience with statistical concepts. Statistical anxiety may manifest nervousness, fear, and avoidance behavior, which often hinders students’ ability to effectively and efficiently engage with the learning process 15, 16. The pressure to perform well on data analysis tasks can exacerbate anxiety which leads to a vicious cycle where students might become more stressed, which in turn lowers their confidence and performance. Students might disengage from learning or avoid challenging data analysis activities due to statistical anxiety 15. Students who experience this form of anxiety are less likely to ask questions, seek help and clarification, or persist when difficulties are encountered. This results in poorer learning outcomes and, ultimately, can hinder the development of important skills in quantitative research 17.
R Programming in Teaching
R programming has been documented in various studies as it is utilized in education, highlighting its utility in teaching complex statistical concepts. R’s open-source nature with extensive libraries and strong community support make it an accessible tool for both the teacher and students. According to Reu et al. 18, R is considered as a versatile tool which bridges theoretical statistical concepts to practical data analysis. Additionally, R also provides a user-friendly interface for data visualization that help students to grasp abstract statistical concepts effectively 19. R programming has been shown to link or align well with active learning methodologies. Benakli et al. 20 argue that R’s hands-on approach to statistical analysis encourages active learning that engages students in solving real-world problems. Through the application of R, students not only learn how to manipulate and analyze data but also develop critical thinking skills and problem-solving abilities. Interactive environments such as RStudio further enhance this learning experience by providing immediate feedback, allowing students to experiment and iterate with their R codes 20.
In today’s data-driven world, data literacy is of vital importance as an essential skill. R programming offers students a solid foundation to data wrangling, statistical analysis, and data visualization. Research by Sodikov 21 showed that those students exposed to R programming are better equipped to analyzing and interpreting numerical results and visualizations from data being analyzed. The use of R also encourages students to think critically about data sources, potential threats and biases, and its implications of the analyses. Preceding discussion support that R programming is a highly effective tool for teaching, especially in fields that demands data analysis, computational thinking, and statistical literacy.
Its application in educational settings fosters active learning where it promotes data literacy and thereby enhances students’ problem-solving abilities. While challenges remain in its implementation, particularly with respect to syntax complexity, coding skills, and required instructor expertise, R’s versatility and the growing availability of instructional resources make it a powerful asset in modern education. As the demand for data-driven skills continues to rise, R’s role in shaping the future of teaching and learning in data analysis is expected to grow.
This study is grounded in two theoretical frameworks: Cognitive Load Theory (CLT) and the Technology Acceptance Model (TAM). Cognitive Load Theory, proposed by Sweller 22, posits that learning can be optimized when instructions are designed to reduce unnecessary cognitive load, since cognitive resources are limited. In the context of R Programming, the challenge is to ensure that students are not overwhelmed by the technicalities of the statistical computation, which will allow them to focus on the core concepts of data analysis. Reducing this cognitive overload in computations, students may develop better data analysis skills and perform more effectively in data interpretations.
On the other hand, the Technology Acceptance Model (TAM), developed by Davis 23, offers insight into how users come to accept and use technology. According to TAM, perceived ease of use and perceived usefulness are two key factors influencing technology adoption. In the context of R Programming, students’ attitudes toward the software are likely shaped by their perceptions of its usefulness in solving real-world data problems and its ease of use. These perceptions could directly influence their willingness to engage with the software and, by extension, their performance in quantitative research tasks.
H0: R programming has no significant effect in improving students’ data analysis performance and in reducing their statistical anxiety.
This study aims to explore the potential and effectiveness of R programming in improving students’ data analysis performance and reducing statistical anxiety, specifically in the quantitative research subject.
This study uses a pre-test post-test quasi-experimental research design. Here, the intervention (R programming) is introduced to the experimental group while the control group utilizes the traditional manual computation for data analysis. The study was conducted at a local senior high school in the Philippines.
5.2. Participants and SamplingParticipants of the study were two intact sections of the Grade 12 Science, Technology, Engineering, and Mathematics (STEM) strand, who were currently taking their Practical Research 2 subject (Quantitative Research). One section was assigned as the control group while the other section was assigned as the experimental group. The assignment of the two sections to which group they belong was randomly chosen since their mean pre-test scores for the data analysis performance test and the statistical anxiety test did not differ. This implied that both sections were at similar level of performance and anxiety, before the intervention was implemented.
5.3. Research InstrumentsThis study employed three primary instruments to assess students’ data analysis performance, statistical anxiety, and learning experiences related to the integration of R programming in quantitative research. The first instrument was a researcher-developed 20-item multiple-choice test designed to evaluate students’ data analysis performance. Each item provided four answer choices, with one correct response. Scores ranged from 0 to 20. The test items were constructed based on the learning competencies outlined in the Senior High School Quantitative Research curriculum and were aligned through a Table of Specifications (TOS). To ensure content validity, the instrument underwent expert review by three specialists in statistics and quantitative research education. A pilot test was administered to a comparable group of students (composed of STEM students not included in the control and experimental group) to conduct item analysis, which included evaluation of item difficulty and discrimination indices. The internal consistency reliability of the instrument was assessed using Cronbach’s alpha, yielding a coefficient of α = 0.82, indicating a high level of reliability.
The second instrument was the Statistical Anxiety Rating Scale (STARS), adapted from Chew, Dillon, and Swinbourne 24. The STARS is a standardized self-report questionnaire comprising 51 items, each rated on a five-point Likert scale ranging from 1 (“Strongly Disagree”) to 5 (“Strongly Agree”). Subscale scores and an overall anxiety score were computed, with higher scores indicating greater statistical anxiety. The STARS was adapted to ensure contextual and cultural relevance to senior high school students in the Philippine educational setting. Minor modifications were made to item wording to improve clarity and age-appropriateness (e.g., references to "university statistics courses" were revised to reflect the senior high school context). The adaptation process involved consultation with educational psychologists and statisticians, followed by a pilot administration to ensure semantic equivalence and comprehensibility. The adapted version retained the original factor structure and demonstrated excellent internal consistency, with a Cronbach’s alpha coefficient of α = 0.93.
The third instrument was a semi-structured interview protocol developed by the researcher to elicit qualitative data regarding students’ experiences with R programming in the context of data analysis. The protocol included open-ended questions focusing on students’ perceptions, perceived benefits, encountered challenges, and insights gained from the use of R programming. The interview guide was subjected to expert validation by qualitative research practitioners to ensure relevance, coherence, and alignment with the study objectives.
The data collection process for this study was conducted in three phases: (1) pre-test administration, (2) implementation of the intervention, and (3) post-test administration and focus group discussion.
Phase 1: Pre-Test Administration
Prior to the intervention, a pre-test was administered to two intact sections of Senior High School students enrolled in the Quantitative Research course. The pre-test consisted of two instruments: the Data Analysis Performance Test and the Statistical Anxiety Rating Scale (STARS). These were simultaneously administered to both groups to establish baseline measures of students’ data analysis proficiency and statistical anxiety levels. Following the pre-test, the two intact sections were randomly assigned to the experimental and control groups to minimize pre-existing differences between the groups. Random assignment was conducted after ensuring that no significant differences existed in the pre-test scores, based on preliminary analysis.
Phase 2: Intervention Implementation
The intervention period spanned five consecutive weeks.Empirical evidence indicates that short-duration teaching interventions—ranging from 5 to 8 weeks—can result in meaningful learning gains 25. During this time, both the experimental and control groups received instruction on data analysis concepts as part of their Quantitative Research subject. However, the method of instruction differed between the two groups:
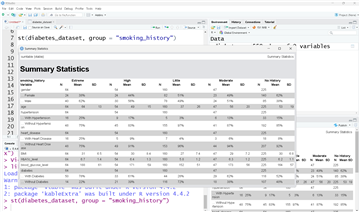
The experimental group was introduced to R programming as the primary tool for performing data analysis tasks. Students engaged in practical activities using RStudio, which included: descriptive statistics, hypothesis testing (e.g., t-test, one-way ANOVA), correlation analysis, and data visualization (e.g., boxplots, histograms, and scatterplots). Sample R outputs were recorded and analyzed as part of the students’ coursework.
The control group, on the other hand, performed the same data analysis tasks using traditional methods. The conventional method used in the classroom involved traditional, manual computation techniques for data analysis, where students solved statistical problems using paper-and-pencil procedures and calculators without the aid of digital tools or software. This approach emphasized mastery of fundamental mathematical operations, algorithmic processes, and conceptual understanding of formulas. Instruction was typically lecture-based, guided by textbooks and printed worksheets aligned with the existing curriculum standards. Resources included blackboard demonstrations, printed computation guides, and problem sets designed to build procedural fluency. The curricular outcomes focused on students’ ability to accurately perform step-by-step computations, interpret statistical results manually, and apply learned concepts to solve real-world problems.
Phase 3: Post-Test Administration and Focus Group Discussion
One week after the conclusion of the intervention, a delayed post-test was administered to both the experimental and control groups. The same instruments used in the pre-test—the Data Analysis Performance Test and the STARS—were re-administered to assess changes in performance and statistical anxiety levels. Administering the post-test after a one-week interval allowed for the measurement of short-term retention and potential delayed effects of the intervention.
Subsequently, a focus group discussion (FGD) was conducted exclusively with the students in the experimental group. The rationale for focusing solely on this group was to explore, in depth, their experiences with the integration of R programming into their data analysis learning process. The FGD aimed to gather qualitative data on students’ perceptions, challenges encountered, perceived benefits, and reflections on how R programming influenced their engagement and understanding of statistical concepts.
The collected pre-test scores, post-test scores, and students’ responses in the focus group discussion (FGD) were analyzed. Students’ level of data analysis performance and statistical anxiety were analyzed using descriptive statistics, specifically the mean and standard deviation. The one-way analysis of covariance (ANCOVA) was utilized to determine if R programming has a significant effect in improving students’ data analysis performance and reducing statistical anxiety. Thematic analysis was used to uncover underlying themes among students’ responses based on their learning experience of using R programming in data analysis.
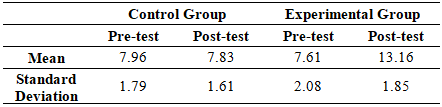
During pre-test, the control group achieved an average score of 7.96 while the experimental group achieved an average score of 7.61. This means that during pre-test, both the control and experimental group belonged to the “developing” category. However, it can be noticed that those students belonging to the experimental group had higher variability of their responses with a standard deviation of 2.08, compared to the control group with a standard deviation of 1.79. In the post-test, the control group got a mean score of 7.83 while the experimental group got a mean score of 13.16. The control remained in the “developing” category during post-test however, the experimental group accelerated to the “proficient” category. This means that the experimental group outperformed the control group in the post-test. It was found that the experimental group has now lesser variability of responses with a standard deviation of 1.85 compared to their performance during the pre-test.
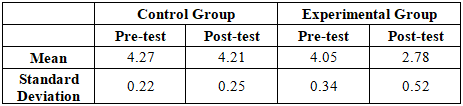
In the pre-test, the level of statistical anxiety was observed as “high anxiety” for both the control group with a mean of 4.27 and also in the experimental group with a mean of 4.05. Malik 26 posited that high statistical anxiety is common among students particularly those who have no sufficient mathematical background in statistics, which is also observed among the participants of this study. In addition, students’ “high level” of statistical anxiety might also be influenced by the lack of connection to daily life 27 and the lack of hands-on activities on computer-based statistics tools 28.
The level of statistical anxiety among the participants in the experimental group during post-test has reduced from “high anxiety” to “low anxiety” with a mean score of 2.78. The standard deviation of 0.52 suggests a low variability among participants level of statistical anxiety. This might possibly be due to the effect of the intervention (R Programming) introduced to the experimental group. Meanwhile in the control group, although the mean score of statistical anxiety during the post-test has reduced from 4.27 to 4.21, this still shows no movement on the level of anxiety since both belongs to “high anxiety”. This might possibly be because the intervention (R Programming) is not introduced to the control group, so, their experience before and after the intervention period is similar.
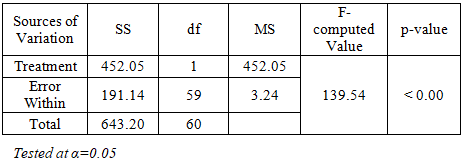
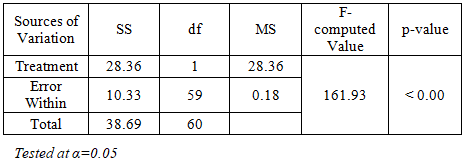
The ANCOVA result as shown in Table 3 revealed that there is a significant difference among students data analysis performance between the control group and the experimental group. Comparative result yielded a p-value of almost 0.00, which is less than the margin of error α = 0.05. This means that the experimental group outperformed the control group in terms of their data analysis performance, implying that the R programming (the intervention) has a significant effect on improving students’ data analysis performance in the experimental group.
The ANCOVA result as shown in Table 4 showed that there is a significant difference among students’ level of statistical anxiety between the control group and the experimental group. Similar to students’ data analysis performance, comparative result yielded a p-value of almost 0.00, which is less than the margin of error α = 0.05. This means that the experimental group has a significant decrease on the level of statistical anxiety as exposed to R programming compared to the control group. This implies that R programming has a significant effect on reducing students’ level of statistical anxiety.
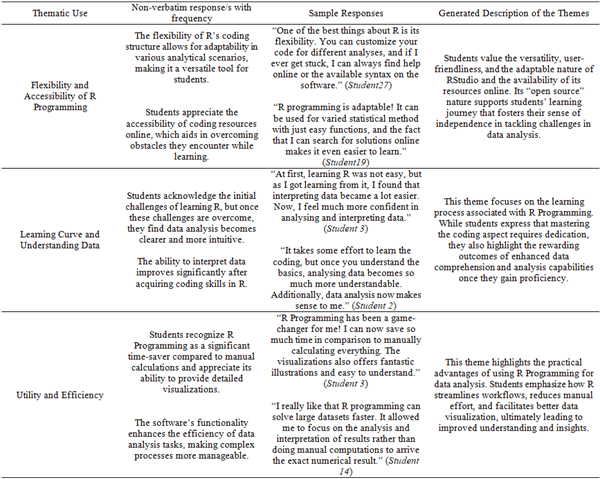
A Focus Group Discussion (FGD) was conducted with students from the experimental group to gather in-depth qualitative insights on their learning experiences with the intervention. The discussion was guided by a semi-structured questionnaire and facilitated in a relaxed environment to encourage open dialogue. With participants’ consent, the session was audio-recorded and supplemented with field notes to ensure accuracy and context. The recorded data were transcribed verbatim and analyzed using thematic analysis. This involved coding the transcripts to identify recurring patterns, grouping similar codes, and categorizing them into overarching themes that captured the students’ shared perspectives and key insights related to the use of technology in learning. During the FGD, all students under the experimental group agreed that they found R programming to be useful and helpful in data analysis. Moreover, the FGD result has uncovered three (3) central themes from students’ responses related to their experiences using R Programming for data analysis. Respectively, these are: (1) flexibility and accessibility; (2) learning curve and understanding data; and (3) utility and efficiency. Table 5 presents the FGD result among students under the experimental group that received the intervention.
Flexibility and Accessibility of R Programming
Students appreciated the adaptability of R in a wide range of statistical and analytical tasks. This is because of its customizability to suit various data analysis methods that makes R versatile and valuable. Additionally, the availability of source codes, support forums, etc. in online spaces, provided the students ease of access in addition to teacher’s instruction during class. R’s flexibility and its open-source nature promoted efficiency and empowered students to do data analysis activities on their own through readily available online resources. In other terms, R also has the potential of fostering independent learning environment, where students feel supported while also in control of their learning process. While learning R can be challenging, particularly when introduced alongside statistical concepts, proper instructional approaches can help students develop programming literacy and apply R effectively in their studies and research 29, 30.
Learning Curve and Understanding Data
At first, students acknowledged the difficulty associated with R programming particularly when it comes to learning the coding syntax and logic. This initial challenge has somewhat made them feel discouraged. As the intervention period progressed and as the students were able to understand the coding syntax and logic of R programming, students reported that their ability to interpret and analyse data improved significantly. This case has also been reported in the study of Tucker et al. 31 where students have seen initial challenge but afterwards developed more positive attitudes towards R programming. They also reported that the coding process becomes more intuitive and the data analysis become more coherent and manageable. In this theme, it can be observed that while students recognize the challenge involved in acquiring necessary coding skills however, they also recognize the significant benefit of R programming which is the better understanding of data analysis.
Utility and Efficiency
Students reported that using R programming has diverted them into focusing on the data analysis rather than on performing tedious and time-consuming manual calculations. It allowed students to give more ample time in interpreting the results and uncovering stories in the data. In addition, R’s ability to produce detailed and easy-to-understand visualizations is another major advantage. Students reported that this feature helped them to better understand complex data and present their findings more effectively. In this theme, it emphasized that R allowed students to streamline their workflow that focuses more on the analytical aspects of their work. R is not only a valuable tool for analysis but it does also improved students’ quality of data insights through clear and informative visualizations. These findings confirms previous studies where students using R reported focusing more on analytical aspects and interpretation rather than manual calculations, allowing for deeper insights into complex data 32. R's ability to produce high-quality, informative visualizations enhances understanding and presentation of findings 33.
The statistically significant results of the conducted ANCOVA confirms that the introduction and utilization of R programming language to senior high school students is found effective in improving their data analysis performance and reducing their statistical anxiety. Furthermore, the conducted focus group discussion illustrates the positive learning experiences of the students in dealing with data analysis while using R programming.
Here, the two theories that framed this study – namely the cognitive load theory and the technology acceptance model, validates the effectiveness of the R programming in improving senior high school students’ data analysis performance and reducing statistical anxiety. Students who found R programming easy to use and perceive it as a useful and valuable tool for data analysis engaged with it effectively, where it led them to improved performance in quantitative research tasks. As students became more comfortable with R, they experienced a reduction in anxiety (specifically statistical anxiety) because the tool provided clear, reliable results which enhanced their confidence in data interpretations 34. Moreover, in mastering R programming, students gained a sense of control over their research process where it alleviates the fear of errors and improves their statistical performance. This aligns with the technology acceptance model, where R programming demonstrated a positive perception that led to increased students’ performance and reduced anxiety in data analysis 34.
Further, the cognitive load theory 22 supported this outcome, suggesting that students’ learning became most effective when their cognitive load is optimized, that minimizes unnecessary mental demands. Initially, students experienced cognitive overload upon learning R programming, due to its coding requirement and the challenging statistical concepts involved, leading to increased students’ anxiety 35. However, as students became more familiar with R's syntax and functionality, their cognitive load decreased and allowed them to focus more on the data analysis rather than navigating the software. The clear structure and visualization tools within R helped students organize and understand their tasks, further reducing anxiety by making the analysis process more predictable and manageable 30. Thus, as students master R programming, the reduction in cognitive load enhances their performance and contributes to lower statistical anxiety 36.
Based on the findings of the study, the researcher concludes that R programming in senior high school quantitative research class is an effective tool in improving students’ data analysis performance and reducing their statistical anxiety. Hence, the researcher recommends the use of R programming as teaching strategy in quantitative research. It might also be used in the probability and statistics subject in the senior high school and other subjects/topics that requires data analysis.
Future researchers are encouraged to expanding the sample size, including diverse school contexts, extending the intervention period, and employing mixed-method or longitudinal designs to further validate and enrich the findings on the integration of R programming in quantitative research education.
| [1] | Bryant, J., Child, F., Dorn, E., & Hall, S. (2020). New global data reveal education technology’s impact on learning. Retrieved, 14, 2020. | ||
| In article | |||
| [2] | Haugen, V. (2023). Mid-term evaluation report (final): Global Education Monitoring (GEM) Centre Phase 3. | ||
| In article | |||
| [3] | Servallos, N. J. (2023). UNESCO: Philippines still lacking in computers for students’ learning. Retrieved from: https://www.philstar.com/headlines/2023/12/14/2318674/unesco-philippines-still-lacking-computers-students-learning | ||
| In article | |||
| [4] | Islam, M.H., Nayeem, M.A., Liton, M.I., Sizan, J.J., & Sadik, S. (2024). The Role of Educational Technology in Enhancing Learning in Developing Countries. Journal of Scientific Reports. | ||
| In article | View Article | ||
| [5] | Major, L., Francis, G. A., & Tsapali, M. (2021). The effectiveness of technology‐supported personalised learning in low‐and middle‐income countries: A meta‐analysis. British Journal of Educational Technology, 52(5), 1935-1964. | ||
| In article | View Article | ||
| [6] | Indra, M. H., Sutarto, S., Kharizmi, M., Nurmiati, A. S., & Susanto, A. (2023). Optimizing the Potential of Technology-Based Learning Increases Student Engagement. Al-Fikrah: Jurnal Manajemen Pendidikan, 11(2), 233-244. | ||
| In article | View Article | ||
| [7] | Vali, I. (2023). The impact of technology on collaborative learning. European proceedings of educational sciences. | ||
| In article | View Article | ||
| [8] | Kalyani, L. K. (2024). The role of technology in education: Enhancing learning outcomes and 21st century skills. International journal of scientific research in modern science and technology, 3(4), 05-10. | ||
| In article | View Article | ||
| [9] | Bradman, C. (2023). How education technology will shape Philippine in-person classrooms in 2023 and beyond. Manila Bulletin. Retrieved from: https://mb.com.ph/2023/1/30/how-education-technology-will-shape-philippine-in-person-classrooms-in-2023-and-beyond | ||
| In article | |||
| [10] | Deryabin, A. A., & Glukhov, P. P. (2022). Regional and Urban Data Science Projects for Citizen and Youth Engagement. European Proceedings of Educational Sciences. | ||
| In article | View Article | ||
| [11] | Pols, C. F. J., Dekkers, P. J. J. M., & De Vries, M. J. (2021). What do they know? Investigating students’ ability to analyse experimental data in secondary physics education. International Journal of Science Education, 43(2), 274-297. | ||
| In article | View Article | ||
| [12] | Sithole, S. T. M., & Abeysekera, I. (2017). Accounting education: a cognitive load theory perspective. Routledge. | ||
| In article | View Article | ||
| [13] | Guzman, L. M., Pennell, M. W., Nikelski, E., & Srivastava, D. S. (2019). Successful integration of data science in undergraduate biostatistics courses using cognitive load theory. CBE—Life Sciences Education, 18(4), ar49. | ||
| In article | View Article PubMed | ||
| [14] | Kinkead, K. J., Miller, H., & Hammett, R. (2016). Adult perceptions of in-class collaborative problem solving as mitigation for statistics anxiety. The Journal of Continuing Higher Education, 64(2), 101-111. | ||
| In article | View Article | ||
| [15] | Sandoz, E.K., & Hebert, E.R. (2017). Using derived relational responding to model statistics learning across participants with varying degrees of statistics anxiety. European Journal of Behavior Analysis, 18, 113 - 131. | ||
| In article | View Article | ||
| [16] | Afdal, A., Alizamar, A., Ilyas, A., Zikra, Z., Taufik, T., Erlamsyah, E., ... & Asmarni, A. (2019, February). Contribution of statistical anxiety to student learning outcomes: Study in Universitas Negeri Padang. In Journal of Physics: Conference Series (Vol. 1157, No. 4, p. 042126). IOP Publishing. | ||
| In article | View Article | ||
| [17] | Slootmaeckers, K., Kerremans, B., & Adriaensen, J. (2013). Too Afraid to Learn: Attitudes towards Statistics as a Barrier to Learning Statistics and to Acquiring Quantitative Skills. Politics, 34(2), 191-200. | ||
| In article | View Article | ||
| [18] | Reu, B., Duran Barajas, Y., Villamizar Gómez, Z. T., Ardila Hurtado, S. F., Remolina Ayala, J. C., & Bolívar Santamaría, S. A. (2022). Análisis de datos utilizando el lenguaje de programación R: una experiencia de aprendizaje virtual en el aula invertida. Revista Docencia Universitaria, 23. | ||
| In article | View Article | ||
| [19] | Pruim, R.J., Kaplan, D.T., & Horton, N.J. (2017). The mosaic Package: Helping Students to Think with Data Using R. R J., 9, 77. | ||
| In article | View Article | ||
| [20] | Benakli, N., Kostadinov, B., Satyanarayana, A., & Singh, S. (2017). Introducing computational thinking through hands-on projects using R with applications to calculus, probability and data analysis. International Journal of Mathematical Education in Science and Technology, 48(3), 393-427. | ||
| In article | View Article | ||
| [21] | Sodikov, J. (2018). Road traffic accident data analysis and visualization in R. International Journal of Computer Science Engineering and Information Technology Research (IJCSEITR), 8, 25-32. | ||
| In article | View Article | ||
| [22] | Sweller, J. (1988). Cognitive load during problem solving: Effects on learning. Cognitive Science, 12(2), 257-285. | ||
| In article | View Article | ||
| [23] | Davis, F. D., Bagozzi, R. P., & Warshaw, P. R. (1989). Technology acceptance model. J Manag Sci, 35(8), 982-1003. | ||
| In article | View Article | ||
| [24] | Chew, P. K., Dillon, D. B., & Swinbourne, A. L. (2018). An examination of the internal consistency and structure of the Statistical Anxiety Rating Scale (STARS). PloS one, 13(3), e0194195. | ||
| In article | View Article PubMed | ||
| [25] | Kammerer, Y., Keck, D., & Starauschek, E. (2019). Effects of a short classroom intervention on students’ identification of contradictions in an Internet forum text: Interaction with reading comprehension skills. Computers & Education, 138, 46-56. | ||
| In article | View Article | ||
| [26] | Malik, S. (2015). Undergraduates' Statistics Anxiety: A Phenomenological Study. Qualitative Report, 20(2). | ||
| In article | View Article | ||
| [27] | Pan, W., & Tang, M. (2005). Students' perceptions on factors of statistics anxiety and instructional strategies. Journal of Instructional Psychology, 32(3), 205. | ||
| In article | |||
| [28] | Stickels, J. W., & Dobbs, R. R. (2007). Helping Alleviate Statistical Anxiety with Computer Aided Statistical Classes. Journal of Scholarship of Teaching and Learning, 7(1), 1-15. | ||
| In article | |||
| [29] | Carson, M.A., & Basiliko, N. (2016). Approaches to R education in Canadian universities. F1000Research, 5. | ||
| In article | View Article PubMed | ||
| [30] | Finch, S., Gordon, I., & Patrick, C. (2020). Taking the aRghhhh out of teaching statistics with R: Using R Markdown. Teaching Statistics, 43, S143 - S147. | ||
| In article | View Article | ||
| [31] | Tucker, M.C., Shaw, S.T., Son, J.Y., & Stigler, J.W. (2022). Teaching Statistics and Data Analysis with R. Journal of Statistics and Data Science Education, 31, 18 - 32. | ||
| In article | View Article | ||
| [32] | Lizana, M.F. (2020). Advantages of R as a tool for data Analysis and Visualization in Social Sciences. | ||
| In article | |||
| [33] | Friedman, A. (2022). Visualizing protein data sets in R through a student peer‐review rubric. Biochemistry and Molecular Biology Education, 50(5), 453-456. | ||
| In article | View Article PubMed | ||
| [34] | Venkatesh, V., & Bala, H. (2008). Technology acceptance model 3 and a research agenda on interventions. Decision sciences, 39(2), 273-315. | ||
| In article | View Article | ||
| [35] | Rode, J. B., & Ringel, M. M. (2019). Statistical software output in the classroom: A comparison of R and SPSS. Teaching of Psychology, 46(4), 319-327. | ||
| In article | View Article | ||
| [36] | Kalyuga, S. (2007). Managing cognitive load in adaptive multimedia learning environments. International Journal of Human-Computer Studies, 64(5), 425-432. | ||
| In article | |||
Published with license by Science and Education Publishing, Copyright © 2025 Gernel S. Lumacad
![]() This work is licensed under a Creative Commons Attribution 4.0 International License. To view a copy of this license, visit
http://creativecommons.org/licenses/by/4.0/
This work is licensed under a Creative Commons Attribution 4.0 International License. To view a copy of this license, visit
http://creativecommons.org/licenses/by/4.0/
| [1] | Bryant, J., Child, F., Dorn, E., & Hall, S. (2020). New global data reveal education technology’s impact on learning. Retrieved, 14, 2020. | ||
| In article | |||
| [2] | Haugen, V. (2023). Mid-term evaluation report (final): Global Education Monitoring (GEM) Centre Phase 3. | ||
| In article | |||
| [3] | Servallos, N. J. (2023). UNESCO: Philippines still lacking in computers for students’ learning. Retrieved from: https://www.philstar.com/headlines/2023/12/14/2318674/unesco-philippines-still-lacking-computers-students-learning | ||
| In article | |||
| [4] | Islam, M.H., Nayeem, M.A., Liton, M.I., Sizan, J.J., & Sadik, S. (2024). The Role of Educational Technology in Enhancing Learning in Developing Countries. Journal of Scientific Reports. | ||
| In article | View Article | ||
| [5] | Major, L., Francis, G. A., & Tsapali, M. (2021). The effectiveness of technology‐supported personalised learning in low‐and middle‐income countries: A meta‐analysis. British Journal of Educational Technology, 52(5), 1935-1964. | ||
| In article | View Article | ||
| [6] | Indra, M. H., Sutarto, S., Kharizmi, M., Nurmiati, A. S., & Susanto, A. (2023). Optimizing the Potential of Technology-Based Learning Increases Student Engagement. Al-Fikrah: Jurnal Manajemen Pendidikan, 11(2), 233-244. | ||
| In article | View Article | ||
| [7] | Vali, I. (2023). The impact of technology on collaborative learning. European proceedings of educational sciences. | ||
| In article | View Article | ||
| [8] | Kalyani, L. K. (2024). The role of technology in education: Enhancing learning outcomes and 21st century skills. International journal of scientific research in modern science and technology, 3(4), 05-10. | ||
| In article | View Article | ||
| [9] | Bradman, C. (2023). How education technology will shape Philippine in-person classrooms in 2023 and beyond. Manila Bulletin. Retrieved from: https://mb.com.ph/2023/1/30/how-education-technology-will-shape-philippine-in-person-classrooms-in-2023-and-beyond | ||
| In article | |||
| [10] | Deryabin, A. A., & Glukhov, P. P. (2022). Regional and Urban Data Science Projects for Citizen and Youth Engagement. European Proceedings of Educational Sciences. | ||
| In article | View Article | ||
| [11] | Pols, C. F. J., Dekkers, P. J. J. M., & De Vries, M. J. (2021). What do they know? Investigating students’ ability to analyse experimental data in secondary physics education. International Journal of Science Education, 43(2), 274-297. | ||
| In article | View Article | ||
| [12] | Sithole, S. T. M., & Abeysekera, I. (2017). Accounting education: a cognitive load theory perspective. Routledge. | ||
| In article | View Article | ||
| [13] | Guzman, L. M., Pennell, M. W., Nikelski, E., & Srivastava, D. S. (2019). Successful integration of data science in undergraduate biostatistics courses using cognitive load theory. CBE—Life Sciences Education, 18(4), ar49. | ||
| In article | View Article PubMed | ||
| [14] | Kinkead, K. J., Miller, H., & Hammett, R. (2016). Adult perceptions of in-class collaborative problem solving as mitigation for statistics anxiety. The Journal of Continuing Higher Education, 64(2), 101-111. | ||
| In article | View Article | ||
| [15] | Sandoz, E.K., & Hebert, E.R. (2017). Using derived relational responding to model statistics learning across participants with varying degrees of statistics anxiety. European Journal of Behavior Analysis, 18, 113 - 131. | ||
| In article | View Article | ||
| [16] | Afdal, A., Alizamar, A., Ilyas, A., Zikra, Z., Taufik, T., Erlamsyah, E., ... & Asmarni, A. (2019, February). Contribution of statistical anxiety to student learning outcomes: Study in Universitas Negeri Padang. In Journal of Physics: Conference Series (Vol. 1157, No. 4, p. 042126). IOP Publishing. | ||
| In article | View Article | ||
| [17] | Slootmaeckers, K., Kerremans, B., & Adriaensen, J. (2013). Too Afraid to Learn: Attitudes towards Statistics as a Barrier to Learning Statistics and to Acquiring Quantitative Skills. Politics, 34(2), 191-200. | ||
| In article | View Article | ||
| [18] | Reu, B., Duran Barajas, Y., Villamizar Gómez, Z. T., Ardila Hurtado, S. F., Remolina Ayala, J. C., & Bolívar Santamaría, S. A. (2022). Análisis de datos utilizando el lenguaje de programación R: una experiencia de aprendizaje virtual en el aula invertida. Revista Docencia Universitaria, 23. | ||
| In article | View Article | ||
| [19] | Pruim, R.J., Kaplan, D.T., & Horton, N.J. (2017). The mosaic Package: Helping Students to Think with Data Using R. R J., 9, 77. | ||
| In article | View Article | ||
| [20] | Benakli, N., Kostadinov, B., Satyanarayana, A., & Singh, S. (2017). Introducing computational thinking through hands-on projects using R with applications to calculus, probability and data analysis. International Journal of Mathematical Education in Science and Technology, 48(3), 393-427. | ||
| In article | View Article | ||
| [21] | Sodikov, J. (2018). Road traffic accident data analysis and visualization in R. International Journal of Computer Science Engineering and Information Technology Research (IJCSEITR), 8, 25-32. | ||
| In article | View Article | ||
| [22] | Sweller, J. (1988). Cognitive load during problem solving: Effects on learning. Cognitive Science, 12(2), 257-285. | ||
| In article | View Article | ||
| [23] | Davis, F. D., Bagozzi, R. P., & Warshaw, P. R. (1989). Technology acceptance model. J Manag Sci, 35(8), 982-1003. | ||
| In article | View Article | ||
| [24] | Chew, P. K., Dillon, D. B., & Swinbourne, A. L. (2018). An examination of the internal consistency and structure of the Statistical Anxiety Rating Scale (STARS). PloS one, 13(3), e0194195. | ||
| In article | View Article PubMed | ||
| [25] | Kammerer, Y., Keck, D., & Starauschek, E. (2019). Effects of a short classroom intervention on students’ identification of contradictions in an Internet forum text: Interaction with reading comprehension skills. Computers & Education, 138, 46-56. | ||
| In article | View Article | ||
| [26] | Malik, S. (2015). Undergraduates' Statistics Anxiety: A Phenomenological Study. Qualitative Report, 20(2). | ||
| In article | View Article | ||
| [27] | Pan, W., & Tang, M. (2005). Students' perceptions on factors of statistics anxiety and instructional strategies. Journal of Instructional Psychology, 32(3), 205. | ||
| In article | |||
| [28] | Stickels, J. W., & Dobbs, R. R. (2007). Helping Alleviate Statistical Anxiety with Computer Aided Statistical Classes. Journal of Scholarship of Teaching and Learning, 7(1), 1-15. | ||
| In article | |||
| [29] | Carson, M.A., & Basiliko, N. (2016). Approaches to R education in Canadian universities. F1000Research, 5. | ||
| In article | View Article PubMed | ||
| [30] | Finch, S., Gordon, I., & Patrick, C. (2020). Taking the aRghhhh out of teaching statistics with R: Using R Markdown. Teaching Statistics, 43, S143 - S147. | ||
| In article | View Article | ||
| [31] | Tucker, M.C., Shaw, S.T., Son, J.Y., & Stigler, J.W. (2022). Teaching Statistics and Data Analysis with R. Journal of Statistics and Data Science Education, 31, 18 - 32. | ||
| In article | View Article | ||
| [32] | Lizana, M.F. (2020). Advantages of R as a tool for data Analysis and Visualization in Social Sciences. | ||
| In article | |||
| [33] | Friedman, A. (2022). Visualizing protein data sets in R through a student peer‐review rubric. Biochemistry and Molecular Biology Education, 50(5), 453-456. | ||
| In article | View Article PubMed | ||
| [34] | Venkatesh, V., & Bala, H. (2008). Technology acceptance model 3 and a research agenda on interventions. Decision sciences, 39(2), 273-315. | ||
| In article | View Article | ||
| [35] | Rode, J. B., & Ringel, M. M. (2019). Statistical software output in the classroom: A comparison of R and SPSS. Teaching of Psychology, 46(4), 319-327. | ||
| In article | View Article | ||
| [36] | Kalyuga, S. (2007). Managing cognitive load in adaptive multimedia learning environments. International Journal of Human-Computer Studies, 64(5), 425-432. | ||
| In article | |||


