1. Introduction
1.1. Latimer Diagram This is one of the potential data diagrams summarizing the relative thermodynamic stability of a series of compounds of the same element in different oxidation states 1, 2, 3, 5. The author of the diagram is Wendell Mitchell Latimer, an American chemist, one of the leaders in the application of thermodynamics in inorganic chemistry 13. The Latimer diagram is a simple and convenient way to record the oxidation-reduction properties of an element representing many different oxidation numbers. From left to right, the elemental compounds are arranged in order of decreasing oxidation number 4 6.
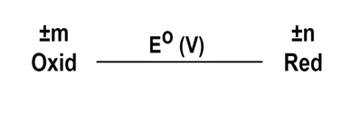
The diagram is denoted 1 7 8:
Where:
Oxid and Red are the oxidized and reduced forms of the reduction half-reaction.
 and
and  is the oxidation number of the element.
Eo is the standard reduction potential of that half-reaction (unit is V).
Example:
The symbol:
means corresponding to the half-reaction:
The symbol:
means corresponding to the half-reaction:
In addition, based on Hess's law, we can establish a Latimer diagram to compare the standard reduction potentials of the reactants and products of the reaction, thereby making predictions about the favorable direction of the reaction.
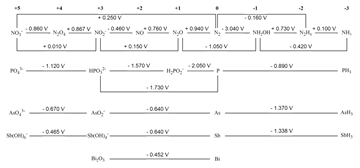
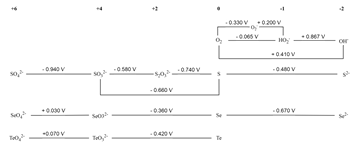
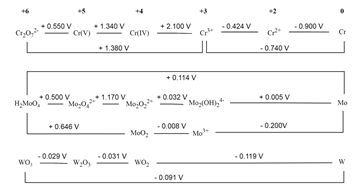
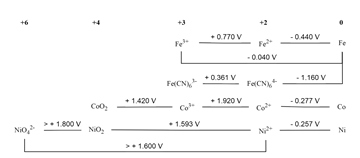
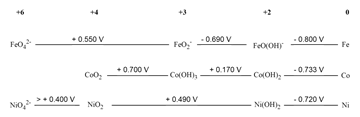
1.2. Latimer Diagram of Some ElementsThe electrode potential data are quoted from references 9, 10, 11, 12 13 14.
Subgroup IA
Acidic solution:
Basic solution:
Subgroup IIA
Acidic solution:
Basic solution:
Subgroup IIIA
Acidic solution:
Basic solution:
Subgroup IVA
Acidic solution:
Basic solution:
Subgroup VA
Acidic solution:
Basic solution:
Subgroup VIA
Acidic solution:
Basic solution:
Subgroup VIIA
Acidic solution:
Basic solution:
Subgroup VIIIA
Acidic solution:
Basic solution:
Subgroup IB
Acidic solution:
Basic solution:
Subgroup IIB
Acidic solution:
Basic solution:
Subgroup VIB
Acidic solution:
Basic solution:
Subgroup VIIB
Acidic solution:
Basic solution:
Subgroup VIIIB
Acidic solution:
Basic solution:
1.3. Predict the Stable Oxidation State of the ElementConsider the two half-reactions side by side in the Latimer diagram:
• If  >
>  then half of the reaction of the B/C pair proceeds spontaneously in the forward direction and the other half A/B in the reverse direction → B is an unstable particle, it has the ability to self-oxidize-reduce to A (higher oxidation number) and C (lower oxidation number). That process is called disproportion.
• If  <
<  then half of the reaction of the B/C pair proceeds spontaneously in the reverse direction and the other half A/B in the forward direction → B is a stable particle, particle A (higher oxidation number) will react with particle C (lower oxidation number) to produce B (intermediate oxidation number). That process is called comproportion.
Note: The standard reduction potential written on the hyphen corresponds to the half-reaction going from left to right (forward direction). When writing in the reverse direction, pay attention to changing the sign of the standard reduction potential.
Example 1: From the Latimer diagram for oxygen (see subgroup VIA), we see that H2O2 is unstable in acidic solution and is disproportioned into H2O and O2.
The total reaction potential is quite positive, so the reaction is thermodynamically favorable. In fact, H2O2 decomposes immediately under normal conditions, but occurs at a very small rate, not clearly observed. When there is a catalyst or when heated or exposed to light, the reaction occurs very quickly, sometimes causing an explosion.
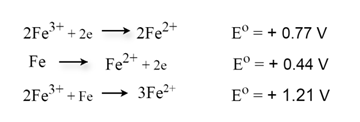
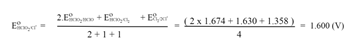
Example 2: From the Latimer diagram for iron (see subgroup VIIIB), we see  , that is, Fe2+ is stable to disproportion, while Fe3+ and Fe undergo comproportion, that is, they will interact with each other to produce Fe2+. This result is confirmed, by calculating the sum of the following two half-reactions:
The total reaction potential is quite positive (+ 1.21V), so the comproportion occurs easily in aqueous solution.
1.4. Calculate the Standard Reduction Potential of Oxidation-Reduction Pairs that are Not Close to Each OtherAnother application of the Latimer diagram is that from the diagram it is possible to calculate the standard reduction potential of oxidation-reduction pairs that are not close to each other. The calculation is based on the relationship between and Eo of the process and the reality is common
  of n successive processes is equal to the sum
 of n processes. For example, the Eo of the A/D pair can be calculated from the Latimer diagram as follows:
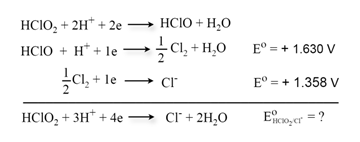
From the Latimer diagram of chlorine, we can write the half-reactions and reactions that need to determine the standard reduction potential:
Applying the above calculation we have:
1.5. Predict Reaction ProductsA new application of the Latimer diagram is to be able to predict reaction products of substances containing elements with several oxidation states. Consider, for example, the reaction of iodide anion with permanganate in acidic solution. The Latimer diagrams of the relevant elements are as follows:
From the diagram above, we see that there are 3 unstable particles with disproportion: HIO,  and Mn3+. In addition, Mn is not stable in acidic environments so there is no need to consider them. Therefore, the diagram is simplified as follows:
If permanganate ( ) is added drop by drop to a hydroiodic acid solution HI (excess I-), then the reaction product needs to be compatible with the presence of iodide ion. Therefore iodate (
 ) cannot form, because it will react with I- to form
  ion (comproportion). Similarly, MnO2 does not form because it has the ability to oxidize I-. It follows that the total reaction must be:
Conversely, if iodide solution is added drop by drop to an acidified permanganate solution (excess  ), the reaction product must be consistent with the presence of
  . Therefore, Mn2+ ion cannot form because it will react with the
  ion to produce MnO2 (comproportion). Then I- will not be completely oxidized to the
  ion because the
  ion has the ability to reduce
  ion. The fact that the H5IO6-
 and
and  -MnO2 half-reactions are potentially equal (+ 1.70 V) further complicates the problem. Therefore, we see that I- ion is not completely oxidized to
  or periodic acid (H5IO6) but to a mixture of products:
Note that changing the excess reactants can lead to different products.
In addition to the Latimer diagram, we also use the Pourbaix (Frost-Ebsworth) diagram to consider the general relationship between oxidation-reduction activity and Bronsted acid-base activity.
The Pourbaix diagram, also known as the E-pH diagram, is a graphical tool used to predict the stability of different oxidation forms of an element in solution. This chart is built based on two main factors:
Oxidation-reduction potential (E°): The ability of an element to attract or lose electrons.
pH: The acidity or basicity level of the solution.
The Pourbaix diagram can be used to determine the pH and ion concentration conditions required for a particular oxidation form of an element to be stable. This information can then be used to draw a Latimer diagram for that oxidation state.The Pourbaix diagram can also be used to determine the oxidation-reduction reactions that can occur between different oxidation forms of the element. This information can then be used to calculate the oxidation-reduction potentials of those reactions using the Latimer diagram.