The study of the phytoplankton community was conducted during the dry, intermediate, and rainy seasons between December 2018 and December 2019 in order to assess phytoplankton diversity. A 2.5-liter Van Dorn plankton bottle was used for sampling. A total of 2,629 specimens belonging to 11 taxa were collected. These taxa are distributed across the following eleven (11) classes: 54 Cyanophyceae, 72 Euglenophyceae, 50 Conjugatophyceae, 143 Chlorophyceae, 29 Dinophyceae, 28 Rhodophyceae, 55 Zygnematophyceae, 18 Xanthophyceae, and 1,936 Diatoms or Bacillariophyceae distributed across 47 genera. The Diatom class was dominated by Coscinodiscus granii and Cyclotella spp. (representing more than 1.90% and 1.86% of the total species, respectively). The study of seasonal variation of physicochemical parameters on the phytoplankton community in the Fatala estuary showed that the correlation matrix performed to evaluate the relationships between physicochemical and biological parameters revealed significant correlations only between temperature and the phytoplankton community, total diatoms, and pennate diatoms (r = 0.361; 0.356; 0.384, respectively) (p < 0.05). In contrast, salinity was significantly correlated, positively with temperature (r = 0.443) and negatively with nitrates and nitrites. This study provided the first qualitative and quantitative inventory of the phytoplankton community of the Fatala estuary prior to mining activities of the Boffa1 project. These results serve as a reference for future monitoring of the phytoplankton community and for the development of appropriate measures to ensure better protection and sustainable exploitation of the aquatic resources of this estuary.
Currently, at a global scale, industrial and agricultural activities are intensifying alongside a rapid increase in the human population. These activities have introduced substances into hydrosystems (rivers, groundwater, lakes, estuaries, lagoons, oceans, etc.) that have harmful effects on both the environment and human health. According to 1, in certain ecosystems, these chemicals can lead to the disappearance of some animal and/or plant species, thereby causing disruptions in the trophic chain 2.
Phytoplankton consists of all suspended microscopic plant organisms in water that can synthesize their own organic substances through photosynthesis, using solar energy, water, carbon dioxide, and nutrient salts. The role of phytoplankton in the functioning of marine ecosystems is essential. Phytoplankton biomass activity in offshore areas contributes to the carbon flux between the ocean and the atmosphere and thus helps regulate atmospheric carbon dioxide concentrations, which influence medium- and long-term climate evolution. Consequently, variations in biological production have major effects on the flow of matter within the ecosystem.
The present study is conducted within this context, following an approach that explores phytoplankton as distinct and precisely identified populations that can serve to …. Its objective is to analyze the influence of the spatio-temporal variability of physicochemical parameters on the phytoplankton community of the Fatala estuary according to hydrological seasons and tidal phases under conditions of strong anthropogenic pressures. This is a prospective analytical study conducted over 12 months (December 2018 – December 2019), aiming to analyze the seasonal variation of physicochemical parameters on the phytoplankton community of the Fatala estuary.
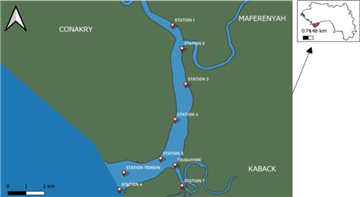
The Republic of Guinea is located in the northern tropical zone, between 7° and 13° north latitude and 7° and 16° west longitude. The estuary studied is located in the Boffa Prefecture (10°2’ N, 14° W) and corresponds to the Fatala River, which originates from the Fouta-Djalon mountainous massif.
The Rio Pongo, named after the river it borders, is also located in Boffa Prefecture in northern Guinea, between 10°01’–10°13’ N and 14°04’–14°12’ W. Its surface area is 0.300 km². It is noteworthy that Guinea ratified the Ramsar Convention in September 1992, and the region is characterized by a humid tropical climate of the Guinean type 3.
2.2. Study FrameworkThe plankton laboratory of the Centre de Recherche Scientifique de Conakry Rogbanè (CERESCOR) served as the research framework for this study.
2.3. MethodologyWater and phytoplankton samples were analyzed during the months corresponding to the hydrological seasons (dry season, intermediate season, and rainy season) from 2018 to 2020.
Temperature, turbidity, pH, dissolved oxygen, salinity, conductivity, nitrites (NO₂⁻), nitrates (NO₃⁻), and phosphates were measured at the Matoto Quality Control Laboratory in Guinea using the methods described by 4, 5.
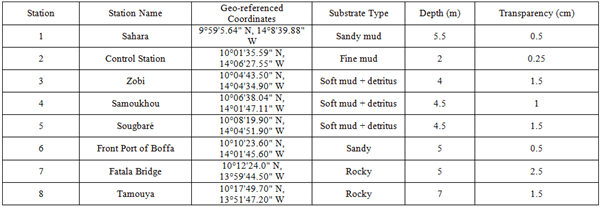
Eight stations were sampled for physicochemical analysis to evaluate water quality. The stations explored were: Sahara, Control Station, Zobi, Samoukhou, Sougbaré, the Front Port of Boffa, and Tamouya (see Figure 1).
Phytoplankton sampling was carried out using the following equipment:
• A 2.5-liter Van Dorn plankton bottle for collecting phytoplankton samples.
• A CyAnScop Cypress Diagnostic microscope (equipped with ×10, ×25, ×40, ×100 objectives and a ×10 eyepiece) used for the identification and counting of microscopic planktonic species.
Sampling was conducted between 7:00 and 10:00 a.m. For each collection, the plankton bottle was submerged in water at a selected depth (see Table 1). A messenger device was then used to trigger the automatic closure of both openings of the sampling bottle. Three samplings were carried out according to the hydrological seasons.
Microscopic counting during this study was performed using a standard microscope equipped with ×10, ×25, ×40 objectives and a ×100 oil-immersion objective, with eyepieces of ×10 magnification. The method used for phytoplankton counting followed 6, which recommends that large planktonic organisms be counted with low-magnification objectives, whereas small organisms should be counted at higher magnifications.
Phytoplankton samples intended for both quantitative and qualitative analyses were fixed in the field with Lugol’s solution. This fixative has the advantage of effectively preserving algae and highlighting the presence of starch through blue and black coloration 7.
Phytoplankton volumes were estimated by approximating each algal or phytoplankton unit to a simple geometric shape (sphere, rectangle, or cylinder) 6, 8, 9. Dimensions (length, width, thickness) were measured using a calibrated CyAnScop Cypress Diagnostic microscope with a micrometer eyepiece and a clear chamber 10. Measurements were performed on a minimum of 30 individuals per species. For filamentous algae, various lengths were measured and an average volume was calculated.
2.5. Data PresentationPhytoplankton quantification was conducted using both absolute abundance (number of cells/mL) and relative abundance (%), which considers only the number of species observed.
The relative abundance of a species i was calculated using the following formula:
Ar = (Ni × 100) / Nt
Where:
• = relative abundance (%)
• Ni = mean absolute abundance (number of cells/mL) of species i (measured at depths of 0.5, 1, 2, and 3 m for water column samples)
• Nt = total abundance of all species (number of cells/mL) in the analyzed sample
The absolute and relative abundance data obtained in this study were subjected to various statistical analyses, including correlation tests, principal component analysis (PCA), and analysis of variance (ANOVA), using XL-STAT 2018 software.
All monitored physicochemical characteristics exhibited seasonal variations across the different sampling stations (Figure 2–Figure 8). The mean values of the seasonal variations of the main physicochemical parameters (temperature, salinity, pH, dissolved oxygen, turbidity, electrical conductivity, orthophosphate, nitrates, and nitrites) are presented in the following figures.
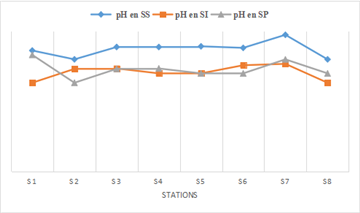
- pH
The pH of the Fatala River water ranged from 7 to 8.73 (Figure 2) depending on the season. The river exhibited a basic character. The mean pH values were 9 during the dry season, 7.5 during the intermediate season, and 7.29 during the rainy season, with the observed differences being statistically significant (ANOVA, p < 0.05). Seasonal pH variations that ensure the development and protection of aquatic life are expected to be between 6 and 9. Surface water pH primarily varies according to salinity and biological activity in the water, and secondarily according to the origin of the water feeding the river. These results are consistent with those reported by Arfi & Guiral (1994) 11.
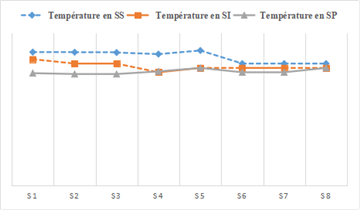
- Temperature
The temporal variability of water temperature in the Fatala River (Figure 3) varied from season to season throughout the study period, with a maximum amplitude of 31°C. The highest mean temperature (30.63°C) was recorded during the dry season, while the lowest mean temperature (25.6°C) was measured during the rainy season. The most significant difference was observed at the Control Station (ANOVA, p < 0.05). This seasonal variation in river water temperature in tropical areas is largely related to the seasonal changes in atmospheric temperature and light conditions 12.
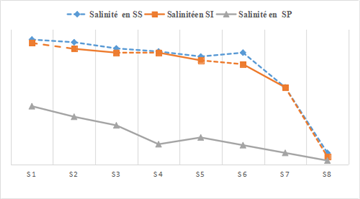
- Salinity
The salinity of the Fatala River waters ranged from 7.36 g/L to 25.44 g/L during the dry season, from 1 to 15 g/L during the rainy season, and from 2 to 31 g/L during the intermediate season (Figure 4). The highest mean values were mainly observed during the dry season. However, the differences were only significant at Station 8 (Tamouya) (ANOVA, p < 0.05).
The low salinity values recorded in the Fatala River are due to the morphology of the system. The reduced salinity observed during the rainy and intermediate seasons is likely caused by dilution from freshwater inputs. Similar observations were reported by 13, 14 in major Ivorian lagoon systems and by 15 in the lagoon of New Caledonia, east of Australia.
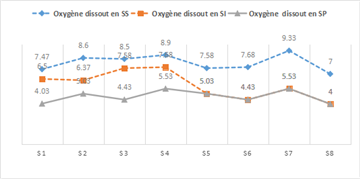
- Dissolved Oxygen
The highest mean value of dissolved oxygen (8.13 mg/L) was recorded during the dry season. Figure 5 shows the seasonal variation of dissolved oxygen, with 5 mg/L during the rainy season and 6 mg/L during the intermediate season. The observed differences were statistically significant (ANOVA, p < 0.05).
Dissolved oxygen in water has two main sources: the first is atmospheric, and the second is related to the photosynthetic activity of algae and aquatic plants 16.
- Nitrites (NO₂⁻)
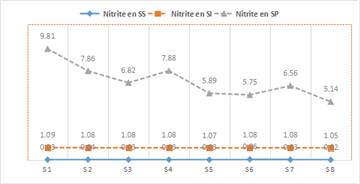
During the rainy season, nitrite concentrations ranged from 5.14 to 9.81 mg/L, with a mean value of 4.67 mg/L. In the dry season, nitrite levels in the Fatala River waters ranged from 1.05 to 1.09 mg/L, with a mean of 0.04 mg/L, while during the intermediate season, values were negligible and aligned with the x-axis. The temporal and spatial variation of nitrites is presented in Figure 6.
Analysis of Figure 6 shows that 98.23% of waters in the study area during the rainy season, 99.67% during the dry season, and 90.55% during the intermediate season had nitrite concentrations below or above the guideline value of 0.1 mg/L established by 23.
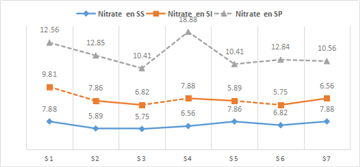
- Nitrates (NO₃⁻)
Nitrate concentrations during the rainy season ranged from 10.41 to 12.85 mg/L, with a mean value of 2.44 mg/L. In the dry season, nitrate levels ranged from 5.75 to 7.88 mg/L, with a mean of 2.12 mg/L, while in the intermediate season they ranged from 5.75 to 9.81 mg/L, with a mean value of 4.6 mg/L. Analysis of Figure 7 shows that the nitrate values obtained are below the guideline value of 50 mg/L established by 17.
Higher nitrate concentrations indicate wastewater discharge into surface and groundwater, as well as excessive use of agricultural fertilizers 18. Therefore, the river waters are of very satisfactory quality for aquatic organisms.
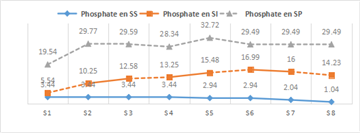
- Orthophosphates (PO₄³⁻)
Phosphate concentrations during the rainy season ranged from 19.54 to 32.72 mg/L, with a mean of 26.13 mg/L. During the dry season, phosphate levels varied from 1.04 to 3.44 mg/L, with a mean of 2.24 mg/L. Almost all waters in the study area showed concentrations below the guideline value of 50 mg/L established by 19. Figure 8 presents the spatial and seasonal variations of phosphate across the study stations.
The absence of a well-defined seasonal cycle for nutrients (PO₄³⁻, NO₃⁻, and NO₂⁻) is attributed to the fact that the stations are located in coastal areas, where sporadic terrestrial and local inputs can disrupt the natural cycle.
2.8. Phytoplankton Composition and Structure of the Fatala RiverOne of the objectives of our study was to characterize the phytoplankton of the Fatala River. A unique aspect of our contribution is the attempt, through specific analyses (pie chart comparisons, PCA, and CA), to directly compare the different sampling stations based on abundance data. This approach aims to highlight potential differences between stations to better interpret the structure of the phytoplankton community.
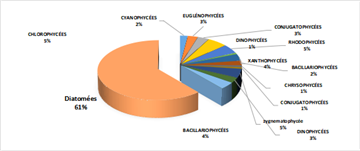
Analysis of the species composition of the samples allowed us to identify 2,629 phytoplankton specimens across 11 taxa. According to the classification proposed by Krammer and Lange-Bertalot (1986, 1988, 1991), the taxa are distributed across the following eleven classes: 54 Cyanophyceae, 72 Euglenophyceae, 50 Conjugatophyceae, 143 Chlorophyceae, 29 Dinophyceae, 28 Rhodophyceae, 55 Zygnematophyceae, 18 Xanthophyceae, and 1,936 diatoms or Bacillariophyceae distributed across 47 genera.
The Diatom class was dominated by Coscinodiscus granii and Cyclotella spp. (accounting for 1.90% and 1.86% of the total species, respectively), notably including Asterionella japonica and Asterionella formosa, which constitute a substantial part of the phytoplankton biomass.
Among the Chlorophyceae species that showed significant seasonal development:
• Ankistrodesmus bernardii was present in the Fatala River waters throughout the year, except in December, usually at relatively low densities. During December and January, it reached about 30% of the total density (80.10⁶ individuals/L) at Station S4.
• Staurodesmus subulatus, a common species in neritic and freshwater plankton, was most abundant in December at Station S2 and in March at Station S1, exceeding 35% of the total density.
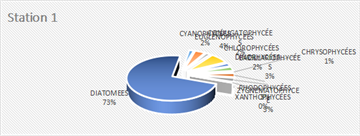
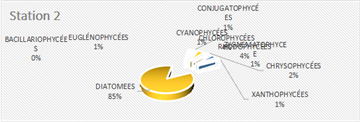
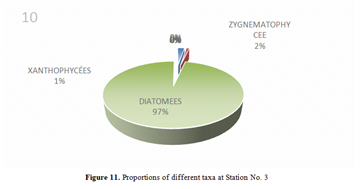
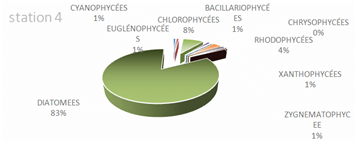
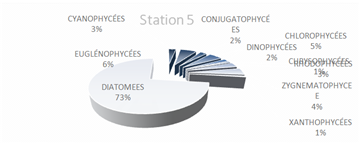
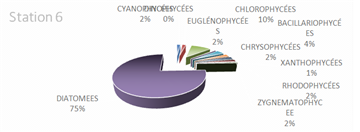
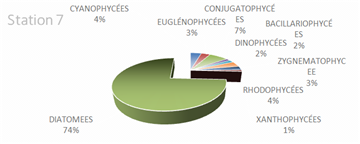
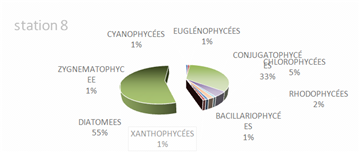
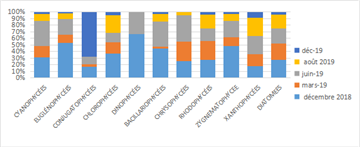
The genus Scenedesmus (Chlorophyceae), particularly Scenedesmus quadricauda, was detected in over 45% of the sampling stations. The figures below illustrate the proportional representation of the different taxa at each station in the Fatala Estuary between December 2018 and December 2019.
Absolute abundances were calculated for the 69 genera identified. These values represent an average obtained from the eight sampling depths (Table 1) and are expressed as the number of individuals per milliliter.
The distribution of relative abundances among phytoplankton classes is shown in Figure 12. At the Fatala River stations downstream (Sta. 7 and Sta. 8), middle reaches (Sta. 4 and Sta. 5), and estuary (Sta. 1, Sta. 2, and Sta. 3) diatoms were the most abundant, representing 61% of the total. They were followed by Chlorophyceae (5%), Zygnematophyceae (5%), and Rhodophyceae (5%). The least represented classes were Cyanophyceae (2%) and Conjugatophyceae (1%).
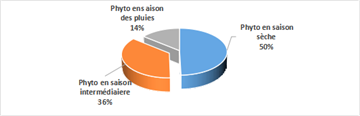
The total monthly absolute abundances of all classes appear to show seasonal variation (Figure 18). Indeed, regardless of the sampling station, higher total monthly absolute abundances were observed during the dry season (50%) (Figure 18).
When comparing the percentages of the main groups constituting the phytoplankton populations (Figure 10), it is evident that the populations are mainly composed of diatoms, which constitute almost the entire phytoplankton community in the Fatala River throughout most of the year.
The mean abundances of pennate diatoms at Stations 7 and 8 did not differ significantly from each other (p>0.05); however, the centric diatoms were more abundant at Stations 1, 2, 3, and 4, with a significant difference observed (p<0.05) (Figure 18).
Variations in total abundance data were more pronounced at the estuary stations (Sahara, Station témoin, and Zobi), particularly during the dry season.
In the Fatala River, the lowest monthly total absolute abundance was observed during the rainy season (590.7 cells/mL), while relatively high values close to 1,000 cells/mL were recorded in June and December.
At the Pont Fatala and Tamouya stations, the months corresponding to the intermediate season showed low total absolute abundances (ranging between 100 and 300 cells/mL). Only during the rainy months were total absolute abundances greater than 500 cells/mL (Figure 19).
This analysis of Figure 19 highlights a higher phytoplankton richness at the estuary stations, while the upstream Tamouya site is the poorest.
A comparison of the monthly mean total absolute abundances of phytoplankton classes using ANOVA across samples from the dry, intermediate, and rainy seasons indicated significant differences at the middle and downstream stations, while differences were not significant at Stations 7 and 8. ANOVA analysis of the different classes also revealed significant differences between upstream, downstream, and river data (p < 0.05).
Relative abundance data (Figure 8 and Figure 11) show a predominance of diatoms and Bacillariophyceae at the intermediate stations. Throughout the sampling period, the proportions of the main phytoplankton classes (diatoms, Bacillariophyceae, and Rhodophyceae) remained relatively constant monthly. However, the relative abundances of other classes varied considerably from month to month, reflecting a relative instability in the composition and structure of the phytoplankton community at these stations.
In contrast to absolute and relative numerical abundances, volumetric relative abundance data indicate that diatoms are the most important group in the river, followed by Bacillariophyceae and Rhodophyceae (Figure 9-Figure 17).
Similar to the seasonal variations in the monthly relative numerical abundances, the relative volumetric abundances of phytoplankton in the river show relative constancy, revealing a clear structure within the phytoplankton community.
This imbalance in seasonal variations among phytoplankton classes supports the relative stability of phytoplankton communities in the Fatala estuary. Comparison of seasonal mean volumetric abundances (average phytoplankton volume per mL) across different classes using ANOVA revealed significant differences between upstream, downstream, and river stations (p < 0.05). These findings corroborate observations from absolute and relative abundance data.
The anthropogenic influence of the Fatala1 project begins to manifest in the phytoplankton community, particularly observed in December 2018 during the intermediate season at Station 7, where species abundances were significantly higher compared to other months. ANOVA analysis confirmed a highly significant difference between these two months, with strong intensity.
2.9. Correlation between Physico-Chemical Parameters and PhytoplanktonA correlation matrix was constructed to examine the relationship between physico-chemical parameters and biological parameters. Significant correlations were observed only between physico-chemical parameters and the phytoplankton community, total diatoms, and pennate diatoms (r = 0.361; 0.356; 0.384, respectively) (p < 0.05).
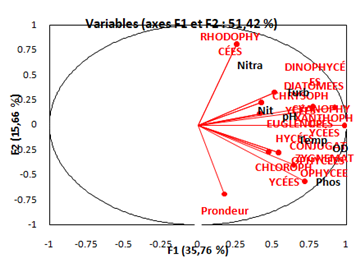
Factorial Analysis (FA) (Figure 20) reveals a disproportionate distribution of the phytoplankton community among the different stations of the Fatala estuary (p < 0.05).
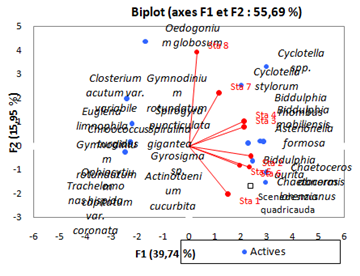
The examination of seasonal variations in numerical (absolute and relative) and volumetric abundances, together with Principal Component Analysis (PCA) and Correspondence Factor Analysis (CFA) based on absolute and relative phytoplankton abundance data, made it possible to distinguish the sampled stations along an upstream downstream gradient. This differentiation highlights differences in the composition and structure of phytoplankton communities among the stations.
These results are consistent with the findings of 20, who reported marked differences in phytoplankton composition between stations, although certain similarities were observed between upstream and downstream assemblages.
However, the analysis of seasonal variations in total monthly absolute abundances showed a tendency for higher values during the dry season. This observation corroborates the conclusions of 20, who indicated that phytoplankton density and absolute biomass are generally higher during the dry season, particularly in January following the end of the transitional season (December).
Seasonal variations in algal groups also depend on factors such as water depth and nutrient status 21, 22. Nevertheless, it is generally accepted that in the absence of external disturbances, algal succession may reach a stable state within one or two months, characterized by the coexistence of dominant and minor species 22. If changes in water characteristics are considered the main driving forces behind seasonal phytoplankton variability, only weak seasonal fluctuations are expected in tropical and equatorial regions, where climatic conditions remain relatively constant 23.
The weak seasonal variations observed, particularly in the Fatala River, can therefore be attributed to the relative stability of physico-chemical parameters. Indeed, the ranges of variation for parameters such as conductivity (61.7–81.1 µS/cm), salinity (7.36–25.44 g/L), temperature (26.15–30.63°C), pH (6.33–8.0), and dissolved oxygen (4.75–5.94 mg/L) are relatively narrow.
The absence of a well-defined cycle for nutrient salts is attributed to the littoral nature of the stations, where sporadic terrestrial and local inputs may disrupt nutrient dynamics. Furthermore, rough sea conditions may induce water mixing and resuspension of bottom particles, which subsequently release nutrients into the water column, particularly orthophosphate ions adsorbed onto sediments 24.
The physicochemical characterization of the Fatala River reveals a moderate spatial and seasonal variability, typical of tropical estuarine systems influenced by the combined effects of hydrological regimes, continental inputs, and marine dynamics. Water temperature shows only slight seasonal fluctuations, reflecting the relative thermal stability of the environment, which is characteristic of tropical and equatorial regions where annual climatic variations are weak 23. This stability favors continuous biological activity, particularly phytoplankton development. Turbidity generally increases during the rainy season due to runoff, soil erosion, and sediment resuspension, which may limit light penetration and affect primary productivity, especially at upstream and intermediate stations 21. Dissolved oxygen concentrations remain globally satisfactory and do not show significant seasonal variations (p > 0.05), with slightly higher values during the dry season, probably linked to enhanced photosynthetic activity and a lower organic load 24.
The pH of the Fatala River waters ranges from neutral to slightly alkaline, indicating an environment favorable for aquatic organisms. This moderate alkalinity is often associated with intense photosynthetic activity, which consumes dissolved CO₂ and consequently increases pH 22. However, seasonal pH variations remain weak, confirming the overall physicochemical stability of the system. In contrast, salinity shows significant seasonal variations (p < 0.05), with higher values during the dry season due to reduced freshwater inputs and increased marine intrusion, and lower values during the rainy season as a result of dilution by continental waters. This dynamic is typical of estuarine environments and plays a key role in the distribution of phytoplankton species along the upstream–downstream gradient 20. Electrical conductivity follows a similar pattern to salinity, confirming its role as an indicator of ionic content, while the relatively narrow ranges of variation suggest the absence of major short-term disturbances.
Nutrients do not exhibit a well-defined seasonal cycle, a situation attributed to the coastal nature of the sampling stations, where sporadic and localized terrestrial inputs can disrupt the classical nutrient cycle 24. Nitrite and nitrate concentrations are generally low, indicating limited anthropogenic pressure in terms of nitrogen pollution. Orthophosphate concentrations are slightly higher during the rainy season, a phenomenon linked to continental inputs and water mixing. Indeed, turbulent conditions can induce sediment resuspension, promoting the release of phosphates adsorbed onto particles into the water column 24.
Seasonal variations in algal groups are closely dependent on physicochemical parameters such as water depth, salinity, and nutrient availability 21, 22. However, in the absence of major external disturbances, algal succession may reach a quasi-stable state within a few weeks, with dominant and minor species 22. In tropical regions, where climatic conditions are relatively constant, seasonal variations in phytoplankton communities are generally weak 23. The low amplitude of variations observed in the Fatala River, both in physicochemical parameters and phytoplankton abundances, supports this hypothesis. These results are consistent with those reported by 20, who highlighted clear differences in phytoplankton composition between upstream and downstream stations, while also noting certain floristic similarities. Furthermore, the tendency toward higher phytoplankton abundances during the dry season observed in this study corroborates the findings of 20, who reported that phytoplankton density and absolute biomass are highest during the months following the intermediate season, particularly in January.
This study demonstrates that phytoplankton is an excellent bioindicator of the ecological quality of the Fatala estuary. Although the community appears globally stable, it remains sensitive to environmental variations and anthropogenic pressures. These findings provide an essential scientific basis for the development of integrated management strategies and sustainable ecological monitoring of the estuary in a context of increasing human activities.
| [1] | Meybeck, M. (2003). Global analysis of river systems: From Earth system controls to Anthropocene syndromes. Philosophical Transactions of the Royal Society B, 358, 1935–1955. | ||
| In article | View Article PubMed | ||
| [2] | Allan, J. D. (2004). Landscapes and riverscapes: The influence of land use on stream ecosystems. Annual Review of Ecology, Evolution, and Systematics, 35, 257–284. | ||
| In article | View Article | ||
| [3] | Ramsar Convention Secretariat. (2016). The Ramsar Convention Manual (6th ed.). Ramsar Convention Secretariat, Gland, Switzerland. | ||
| In article | |||
| [4] | APHA. (2017). Standard Methods for the Examination of Water and Wastewater (23rd ed.). American Public Health Association, Washington DC. | ||
| In article | |||
| [5] | Rodier, J., Legube, B., & Merlet, N. (2009). L’analyse de l’eau (9e éd.). Dunod, Paris. | ||
| In article | |||
| [6] | Utermöhl, H. (1958). Zur Vervollkommnung der quantitativen Phytoplankton-Methodik. Mitteilungen der Internationalen Vereinigung für Theoretische und Angewandte Limnologie, 9, 1–38. | ||
| In article | View Article | ||
| [7] | Throndsen, J. (1978). Preservation and storage. In A. Sournia (Ed.), Phytoplankton Manual (pp. 69–74). UNESCO, Paris. | ||
| In article | |||
| [8] | Hillebrand, H., Dürselen, C. D., Kirschtel, D., Pollingher, U., & Zohary, T. (1999). Biovolume calculation for pelagic and benthic microalgae. Journal of Phycology, 35, 403–424. | ||
| In article | View Article | ||
| [9] | Sun, J., & Liu, D. (2003). Geometric models for calculating cell biovolume and surface area for phytoplankton. Journal of Plankton Research, 25, 1331–1346. | ||
| In article | View Article | ||
| [10] | Lund, J. W. G., Kipling, C., & Le Cren, E. D. (1958). The inverted microscope method of estimating algal numbers and the statistical basis of estimations. Hydrobiologia, 11, 143–170. | ||
| In article | View Article | ||
| [11] | Arfi, R., & Guiral, D. (1994). Variations spatio-temporelles du phytoplancton dans les lagunes ivoiriennes. Hydrobiologia, 289, 43–58. | ||
| In article | |||
| [12] | Talling, J. F., & Lemoalle, J. (1998). Ecological Dynamics of Tropical Inland Waters. Cambridge University Press, Cambridge. | ||
| In article | |||
| [13] | Pagès, J., Citeau, J., & Laugier, T. (2001). Hydrology and salinity of African coastal lagoons. Oceanologica Acta, 24, 231–245. | ||
| In article | |||
| [14] | Guiral, D., & Ferhi, A. (1989). Production primaire et structure du phytoplancton des lagunes ivoiriennes. Revue d’Hydrobiologie Tropicale, 22, 1–15. | ||
| In article | |||
| [15] | Ouillon, S., Douillet, P., Lefebvre, J. P., & Jouon, A. (2010). Circulation and sediment transport in a coral reef lagoon. Marine Pollution Bulletin, 61, 269–282. | ||
| In article | View Article PubMed | ||
| [16] | Wetzel, R. G. (2001). Limnology: Lake and River Ecosystems (3rd ed.). Academic Press, San Diego. | ||
| In article | |||
| [17] | World Health Organization (WHO). (2017). Guidelines for Drinking-water Quality (4th ed.). WHO Press, Geneva. | ||
| In article | |||
| [18] | Camargo, J. A., Alonso, Á., & Salamanca, A. (2005). Nitrate toxicity to aquatic animals. Chemosphere, 58, 1255–1267. | ||
| In article | View Article PubMed | ||
| [19] | United States Environmental Protection Agency (USEPA). (2002). National Recommended Water Quality Criteria. Office of Water, Washington DC. | ||
| In article | |||
| [20] | Reynolds, C. S. (2006). The Ecology of Phytoplankton. Cambridge University Press, Cambridge. | ||
| In article | View Article | ||
| [21] | Padisák, J., Crossetti, L. O., & Naselli-Flores, L. (2009). Phytoplankton functional classification. Hydrobiologia, 621, 1–19. | ||
| In article | View Article | ||
| [22] | Sommer, U., Gliwicz, Z. M., Lampert, W., & Duncan, A. (1986). The PEG-model of seasonal succession. Archiv für Hydrobiologie, 106, 433–471. | ||
| In article | View Article | ||
| [23] | Lewis, W. M. (1996). Tropical lakes: Latitude effects. Perspectives in Tropical Limnology, 43–64. | ||
| In article | |||
| [24] | Vollenweider, R. A. (1968). Scientific fundamentals of eutrophication. OECD Technical Report, Paris. | ||
| In article | |||
Published with license by Science and Education Publishing, Copyright © 2026 Ousmane SANGARE, Azonwakin Rodrigue AKOTEGNON, Yabyouré Marc-Florent SAWADOGO, Adama OUEDA and Fanta TOURE
![]() This work is licensed under a Creative Commons Attribution 4.0 International License. To view a copy of this license, visit
http://creativecommons.org/licenses/by/4.0/
This work is licensed under a Creative Commons Attribution 4.0 International License. To view a copy of this license, visit
http://creativecommons.org/licenses/by/4.0/
| [1] | Meybeck, M. (2003). Global analysis of river systems: From Earth system controls to Anthropocene syndromes. Philosophical Transactions of the Royal Society B, 358, 1935–1955. | ||
| In article | View Article PubMed | ||
| [2] | Allan, J. D. (2004). Landscapes and riverscapes: The influence of land use on stream ecosystems. Annual Review of Ecology, Evolution, and Systematics, 35, 257–284. | ||
| In article | View Article | ||
| [3] | Ramsar Convention Secretariat. (2016). The Ramsar Convention Manual (6th ed.). Ramsar Convention Secretariat, Gland, Switzerland. | ||
| In article | |||
| [4] | APHA. (2017). Standard Methods for the Examination of Water and Wastewater (23rd ed.). American Public Health Association, Washington DC. | ||
| In article | |||
| [5] | Rodier, J., Legube, B., & Merlet, N. (2009). L’analyse de l’eau (9e éd.). Dunod, Paris. | ||
| In article | |||
| [6] | Utermöhl, H. (1958). Zur Vervollkommnung der quantitativen Phytoplankton-Methodik. Mitteilungen der Internationalen Vereinigung für Theoretische und Angewandte Limnologie, 9, 1–38. | ||
| In article | View Article | ||
| [7] | Throndsen, J. (1978). Preservation and storage. In A. Sournia (Ed.), Phytoplankton Manual (pp. 69–74). UNESCO, Paris. | ||
| In article | |||
| [8] | Hillebrand, H., Dürselen, C. D., Kirschtel, D., Pollingher, U., & Zohary, T. (1999). Biovolume calculation for pelagic and benthic microalgae. Journal of Phycology, 35, 403–424. | ||
| In article | View Article | ||
| [9] | Sun, J., & Liu, D. (2003). Geometric models for calculating cell biovolume and surface area for phytoplankton. Journal of Plankton Research, 25, 1331–1346. | ||
| In article | View Article | ||
| [10] | Lund, J. W. G., Kipling, C., & Le Cren, E. D. (1958). The inverted microscope method of estimating algal numbers and the statistical basis of estimations. Hydrobiologia, 11, 143–170. | ||
| In article | View Article | ||
| [11] | Arfi, R., & Guiral, D. (1994). Variations spatio-temporelles du phytoplancton dans les lagunes ivoiriennes. Hydrobiologia, 289, 43–58. | ||
| In article | |||
| [12] | Talling, J. F., & Lemoalle, J. (1998). Ecological Dynamics of Tropical Inland Waters. Cambridge University Press, Cambridge. | ||
| In article | |||
| [13] | Pagès, J., Citeau, J., & Laugier, T. (2001). Hydrology and salinity of African coastal lagoons. Oceanologica Acta, 24, 231–245. | ||
| In article | |||
| [14] | Guiral, D., & Ferhi, A. (1989). Production primaire et structure du phytoplancton des lagunes ivoiriennes. Revue d’Hydrobiologie Tropicale, 22, 1–15. | ||
| In article | |||
| [15] | Ouillon, S., Douillet, P., Lefebvre, J. P., & Jouon, A. (2010). Circulation and sediment transport in a coral reef lagoon. Marine Pollution Bulletin, 61, 269–282. | ||
| In article | View Article PubMed | ||
| [16] | Wetzel, R. G. (2001). Limnology: Lake and River Ecosystems (3rd ed.). Academic Press, San Diego. | ||
| In article | |||
| [17] | World Health Organization (WHO). (2017). Guidelines for Drinking-water Quality (4th ed.). WHO Press, Geneva. | ||
| In article | |||
| [18] | Camargo, J. A., Alonso, Á., & Salamanca, A. (2005). Nitrate toxicity to aquatic animals. Chemosphere, 58, 1255–1267. | ||
| In article | View Article PubMed | ||
| [19] | United States Environmental Protection Agency (USEPA). (2002). National Recommended Water Quality Criteria. Office of Water, Washington DC. | ||
| In article | |||
| [20] | Reynolds, C. S. (2006). The Ecology of Phytoplankton. Cambridge University Press, Cambridge. | ||
| In article | View Article | ||
| [21] | Padisák, J., Crossetti, L. O., & Naselli-Flores, L. (2009). Phytoplankton functional classification. Hydrobiologia, 621, 1–19. | ||
| In article | View Article | ||
| [22] | Sommer, U., Gliwicz, Z. M., Lampert, W., & Duncan, A. (1986). The PEG-model of seasonal succession. Archiv für Hydrobiologie, 106, 433–471. | ||
| In article | View Article | ||
| [23] | Lewis, W. M. (1996). Tropical lakes: Latitude effects. Perspectives in Tropical Limnology, 43–64. | ||
| In article | |||
| [24] | Vollenweider, R. A. (1968). Scientific fundamentals of eutrophication. OECD Technical Report, Paris. | ||
| In article | |||


