The glycemic index (GI) measures the postprandial glucose response (PPGR) to individual foods, while the glycemic load (GL) reflects the overall PPGR caused by the entire diet. Developing low-glycemic foods is crucial for preventing and managing type 2 diabetes, and can help alleviate feelings of hunger. The low-glycemic crunchy bites were formulated with whole grains, dried MD2 pineapple, honey, and fiber-rich seeds. These bites are typically served with beverages such as milk or coffee. Therefore, the aim of this study was to investigate the effects of various accompanying drinks on blood glucose and satiety responses in healthy individuals. 15 participants were recruited for the study conducted in a controlled research setting. Each participant consumed the reference food (RF), white bread, and the test foods (TFs) on separate days. The test foods included 1) White bread (RF), Low-GI crunchy bites (TF1), Low-GI crunchy bites with 250 mL of fresh milk (TF2), and Low-GI crunchy bites with 250 mL of unsweetened coffee (TF3). The glucose iAUC values for the tested foods were significantly lower, ranging from 46.53 ± 3.43 to 54.23 ± 3.93, compared with the reference food (220.72 ± 17.11). The tested foods were low-glycemic. According to the VAS score, the satiety index was lower than that of the reference food. A negative correlation exists between postprandial blood glucose and satiety responses. Eating crunchy bites alone, with milk, or with unsweetened coffee can slow the rise in blood glucose and reduce hunger.
The prevalence of obesity in Southeast Asia has risen markedly over the past few decades, emerging as a major public health concern. Recent research indicates a sharp increase in obesity rates across the region, with some countries reporting prevalence levels reaching up to 40% 1, 2. The proportion of overweight adults has surged by 38% since the 1990s, now affecting approximately 40.9% of the population 3. In Malaysia, nearly half of the population is classified as overweight or obese, while Indonesia records an obesity rate of 28% among adults, reflecting a substantial increase over the past twenty years 3, 4. This growing trend in obesity has contributed to a greater burden of non-communicable diseases (NCDs) including cardiovascular disease, diabetes, and hypertension; thereby exerting additional strain on healthcare systems that are often ill-equipped to handle chronic disease management 5, 6.
Diabetes has emerged as a major global health threat, ranking among the most critical public health and economic challenges worldwide 7. In the 21st century, it is expected to remain a leading global health burden. A 2024 study published in The Lancet, analyzing 1,108 population-based studies involving 141 million adults aged 18 and older, estimated that 828 million adults were living with diabetes in 2022. This reflects a dramatic increase of 630 million cases since 1990, with the largest surge in developing countries 8. Often described as a “Western disease,” diabetes is largely attributed to the adoption of Westernized lifestyles and dietary habits 9. However, it continues to pose a significant health challenge alongside other NCDs such as cardiovascular diseases. In 2017, Malaysia's total health expenditure accounted for 4.24% of the country’s GDP, amounting to RM57.4 billion, with a per capita health spending of RM1,790. Among the three principal non-communicable diseases (NCDs) are cardiovascular disease, diabetes, and cancer. Diabetes imposed the greatest direct healthcare burden, contributing RM 4.38 billion (45.38%) to total expenditures. Cardiovascular disease incurred a further RM 3.93 billion (40.73%), whereas cancer accounted for RM 1.34 billion (13.89%) of overall healthcare costs 10.
The glycemic index (GI) is a standardized measure that quantifies the postprandial blood glucose response elicited by a carbohydrate-containing food relative to a reference. Accurate determination of GI requires controlled experimental procedures and cannot be inferred solely from the food’s composition or ingredient profile 11. In contrast, glycemic load (GL) reflects the overall glycemic impact of a typical serving of food, integrating both the quality of GI and the quantity of carbohydrates consumed. Together, GI and GL provide complementary insights into the physiological effects of carbohydrate-rich foods on blood glucose regulation 12. Meanwhile, satiety refers to the postprandial sensation of fullness that suppresses further food intake and plays a critical role in appetite regulation and energy balance 13. The assessment of satiety typically involves evaluating participants' subjective sensations of hunger and fullness after consuming a test food or meal following a period of fasting. These perceptions are recorded both in the fasting state and at predetermined intervals after consumption, commonly using visual analog scales (VAS) anchored with descriptive terms representing the extremes of each sensation 14.
Human eating habits play a vital role in the development of diabetes, making low–GI dietary interventions a key strategy in managing the disease. Low-GI foods contain available carbohydrates with a GI value of 55 or lower. These foods produce a smaller area under the curve (AUC) and a lower peak in postprandial blood glucose levels, supporting the management of diabetes, cardiovascular disease, and obesity by reducing the adverse effects of elevated blood glucose 15. High-fiber diets help lower postprandial glucose levels, reduce insulin resistance, and increase satiety by altering digestion and gut hormone secretion 16. Consuming low-GI foods rich in dietary fiber (DF) has become a common strategy for blood glucose control, thanks to their ability to influence glycemic responses 17, 18.
High-fiber pineapple granola is a nutritious and flavorful snack that supports overall health. This granola is made with whole grains, dried fruits, honey, and fiber-rich ingredients, all of which help maintain a healthy digestive system. The addition of dried MD2 pineapple slices provides natural sweetness and a unique tropical flavor, while the high fiber content helps stabilize blood sugar levels and promotes feelings of fullness. Perfect for pairing with coffee or milk, or enjoyed on its own, this granola offers both great taste and nutritional benefits. Additionally, the product is preservative-free, making it a healthier and more sustainable choice. Furthermore, this granola is suitable for all dietary needs, including those on a sugar-free diet or with diabetes, as it provides sustained energy without sudden spikes in blood sugar. With a low starch digestibility percentage and a GI of 53, this granola can help regulate blood sugar levels and increase satiety, making it an excellent addition to a daily diet. Therefore, this study aims to evaluate the effects of consuming a low-GI granola bite on postprandial blood glucose and satiety responses.
Fifteen participants were recruited from the Malaysian Agricultural Research and Development Institute (MARDI) and the surrounding community through public announcements and advertisements. All volunteers completed a questionnaire assessing their overall health status and dietary habits. The inclusion criteria were as follows: adults aged 20–45 years with a body mass index (BMI) under 25 kg/m², including both men and women; fasting plasma glucose levels below 5.55 mmol/L; and stable eating patterns. Participants were required not to follow a low-calorie diet, use medications that could significantly affect body weight, appetite, lipid profile, or blood parameters, or be in good general health. Exclusion criteria included pregnancy or lactation; history of gastric bypass or other gastrointestinal weight-loss surgeries; food allergies (particularly to nuts, milk, or coffee); history of bulimia or laxative abuse; mental health disorders that impair independence; and the presence of endocrine or thyroid disorders. All participants provided informed consent and were fully briefed on the study protocol. The experimental procedure was approved by the Research Ethics Committee of the University of Technology MARA (UiTM) (Approval No. REC/10/2025 (OT/MR/37)). The study was conducted in accordance with the guidelines set out in the Declaration of Helsinki 19.
2.2. Study ProcedureAt the beginning of the study, participants’ height, weight, fasting blood glucose, and blood pressure were recorded. They were instructed to maintain consistent pre-test conditions, including similar physical activity, meal timing, and the types of their meals and snacks from the previous evening. Any deviation from these conditions would require rescheduling the test session.
Participants attended the Food Technology Research Centre at MARDI in the morning after a 12-hour overnight fast, during which fasting blood samples were collected. The study involved administering a reference food (white bread, RF) and three test foods (TFs) on separate days. Each test portion was standardized to provide 50 g of available carbohydrates. The reference food was tested twice on separate days to ensure reliability. The test foods included: (TF1) low-GI crunchy bites, (TF2) low-GI crunchy bites with 250 mL of fresh milk, and (TF3) low-GI crunchy bites with 250 mL of unsweetened coffee.
Furthermore, from the first bite of either RF or TFs, a 1.0 μL blood sample was collected at 15, 30, 45, 60, 90, and 120 minutes. The RF was consumed on the first day, and the TFs were randomized and labeled as TF1, TF2, and TF3. The TFs were consumed within 10 to 15 minutes, along with 250 mL of water. Participants sat at tables in a quiet, stress-free environment and were not allowed to eat or drink until the session ended at 120 minutes. Afterward, they were served standard food and drinks, and their intake was recorded. The tests were conducted roughly 3 to 7 days apart, starting at the same time each morning. Participants collected their own blood samples via finger prick. They were trained to take their own blood glucose samples prior to the study, with assistance from investigators. Glucose levels were measured using a glucometer (Accu-Chek Instant, Roche, Malaysia). The study duration is expected to range from 9 to 21 days, excluding RF and screening procedures.
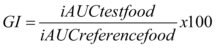
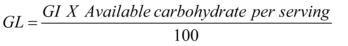
A glucose response curve was constructed, and the incremental area under the glucose response curve (iAUC) was calculated geometrically, using the trapezoid rule (FAO/WHO) 20. For each participant, the GI value for each TF was calculated by expressing each participant's iAUC after the TF ingestion as a percentage of the same participant’s mean RF iAUC. iAUC, GI, and GL for TFs were calculated using the formula:
iAUC = Σ [(Cᵢ + Cᵢ₊₁) / 2] × (tᵢ₊₁ − tᵢ)
where:
Ci = Incremental blood glucose concentration at time ti (after subtracting fasting value)
ti = Time after eating (e.g., 0, 15, 30, 45, 60, 90, 120 minutes)
 |
 |
The Visual Analogue Scale (VAS) was used to evaluate participants’ subjective appetite sensations, including hunger, satiety, prospective food consumption, perceived amount of food that could be consumed, and desire for sugary foods throughout the study period 21. Upon arriving in the morning, participants filled out a questionnaire about the previous evening’s meal and rated their recent food intake and activity levels using five-point scales, anchored from ‘much less than usual’ to ‘much more than usual.’ Appetite ratings were recorded on a 10 cm VAS (Visual Analog Scale) with a seven-point scale, anchored at -3 (extremely hungry), 0 indicating no particular hunger, and +3 (extremely full). The scores were measured concurrently with blood sample collection to assess postprandial blood glucose levels. Participants did not discuss or compare their hunger ratings with others, nor refer to previous ratings when marking the scale. Participants were informed about how to complete VAS forms prior to the study's commencement.
2.4. Anthropometric MeasurementsParticipant body composition was measured on the first day of the study. Height was measured with a stadiometer (HM200P, Charder Electronic Co., Taiwan). Weight, body mass index (BMI), skeletal muscle mass, and body fat were determined via the Advanced Body Composition Analyzer (Charder Electronic Co., Ltd., Taiwan).
2.5. Fasting Blood Glucose and Blood Pressure DeterminationFasting blood glucose was determined using a glucometer (Accu-Chek Instant, Roche, Malaysia), and blood pressure level was determined using a blood pressure monitor (BM 28, Beurer GmBH, Germany).
2.6. Statistical AnalysisThe sample size was determined using the GI methodology described by Brouns 22 and further supported by the study by Wolever 23. Their findings recommended that at least 10 participants are adequate to achieve a reasonable level of statistical power and precision while maintaining cost efficiency. Accordingly, the present study was designed to detect a significant difference in GI with 90% statistical power at a significance level of P < 0.05 (two-tailed), considering an effect size of 1.4 for glucose response over time 24. To account for potential dropouts, 15 participants were recruited. G*Power version 3.1.9.7 was used to calculate statistical power.
Baseline data were expressed as standard deviation (mean + SD), while the iAUC, blood glucose concentration, and satiety response were presented as mean ± standard error of the mean (SEM). Differences among groups were assessed using analysis of variance (ANOVA), followed by a post hoc least significant difference (LSD) test; P ≤ 0.05 was considered statistically significant. Every statistical analysis comparison test used the response to white bread as the reference to which all the other test foods’ blood glucose responses were compared. The correlation between postprandial and satiety responses was measured using the Pearson correlation coefficient (r). All data analyses were conducted using IBM SPSS Statistics version 29.0 (IBM Corp., Armonk, NY, USA).
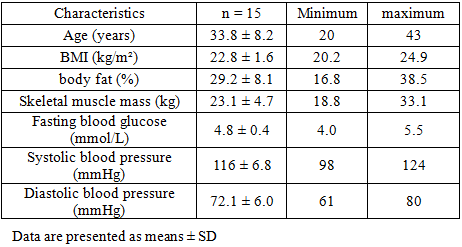
The study protocol was well tolerated. All 15 participants completed the study. The baseline characteristics of the participants are presented in Table 1. The average age was 33.8 ± 8.2 years, with females constituting 60% of the study population. The mean BMI was 22.8 ± 1.6 kg/m². The average body fat percentage was 29.2 ± 8.1%, and skeletal muscle mass was 23.1 ± 4.7 kg. Both body mass index (BMI) and body fat values for all participants were within the normal range. The average fasting blood glucose level was 4.8 ± 0.4 mmol/L. The mean systolic and diastolic blood pressures were 116 ± 6.8 mmHg and 72.1 ± 6.0 mmHg, respectively, indicating that the participants' blood glucose levels and blood pressure readings were within the normal range.
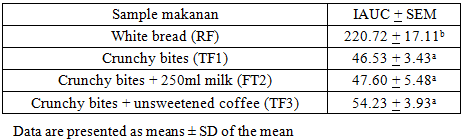
3.2. Glycemic Response of FoodTable 2 shows the average iAUC values for the test foods consumed by participants. Analysis of the glycemic responses revealed that the iAUC (46.53 ± 3.43) for crunchy bites alone was the lowest among the other TFs. The white bread exhibited the highest iAUC value (220.72 ± 17.11), which was significantly higher than those of the other TFs.
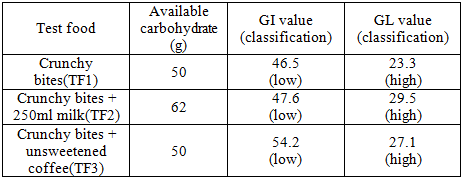
The GI test is based on 50 g of available carbohydrate per serving of test food, defined as total carbohydrate minus dietary fiber. The RF was tested using an equivalent amount of carbohydrate (50 g). Table 3 presents the GI and GL values, along with the classification of the three test foods. These results showed that the GI values for the test foods ranged from 46.5 to 54.2, placing them all in the low-GI category. Additionally, the results indicated that the GL values of the test foods ranged from 23.3 to 29.5, placing them in the high-GL category.
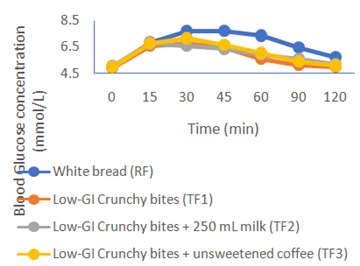
The mean plasma glucose response curves for the RF and three TFs are presented in Figure 1. The RF induced a pronounced elevation in blood glucose concentration within the first 45 minutes (7.7 ± 0.2 mmol/L), resulting in the highest overall glycemic response. TF1 and TF3 exhibited comparable temporal response patterns, with no significant difference, and peak glucose concentrations were observed at 30 minutes postprandially, at 6.8 ± 0.2 mmol/L and 6.6 ± 0.2 mmol/L, respectively. On the other hand, the TF2 showed the fastest reduction in blood glucose response, from 6.7 ± 0.3 mmol/L at 15 to 30 minutes to 6.6 ± 0.2 mmol/L. Among the test foods, TF1 elicited the lowest glycemic response, followed by TF2 and TF3, with no significant differences detected among them.
A study involving 25 healthy volunteers examined the acute effects of coffee consumption on glycemic response. The findings indicated that coffee intake had no significant impact on glycemic responses when consumed with a carbohydrate source 26. Similarly, another study on healthy young males found that consuming caffeinated coffee with a carbohydrate load significantly impaired blood glucose management 27. The aforementioned studies were concurrent with our findings. It has been proposed that bioactive compounds in coffee, in addition to caffeine, may mitigate the acute adverse effects of caffeine on glycemia. Among these, chlorogenic acids (CGA) and quinides have been identified as potential contributors. The suggested mechanisms include delayed intestinal glucose absorption due to dissipation of the sodium gradient, thereby inhibiting the sodium-glucose cotransporter 1 (SGLT1) 28, as well as enhanced glucose uptake in non-skeletal muscle tissues 29. Studies examining the effects of isolated CGA 30 and coffee enriched with CGA 31 have both reported significant reductions in postprandial glucose responses compared with control conditions.
We observed that drinking milk with a meal did not further increase the glucose response. Our study was consistent with Li et al.'s research, which found no difference in glucose AUCs between water and milk 32. This phenomenon, referred to as a “dissociation of the glycemic and insulinemic responses” 33, may be attributed to the combined effects of milk’s lactose and protein components 34. Lactose, which has a moderately low glycemic index (GI) of approximately 67, when combined with whey and casein proteins, may help attenuate the glucose response by slowing gastric emptying and stimulating insulin secretion, thereby enhancing glucose clearance and resulting in an overall reduced GI of approximately 30–40 for milk 35. It is plausible that milk ingestion slowed gastric emptying of the meal and stimulated insulin secretion, thereby facilitating the clearance of additional glucose from the bloodstream.
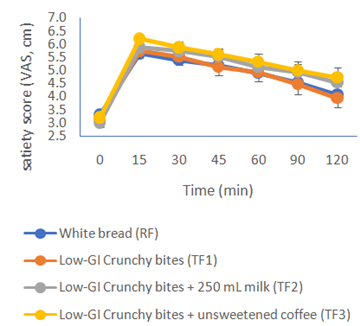
3.5. Postprandial Satiety ResponseFigure 2 illustrates the mean changes in satiety scores for the RF and the three TFs. Among all samples, TF3 elicited the highest satiety score, followed by TF2. The RF and TF1 produced comparable satiety responses, with no significant differences observed between them. Both, however, recorded lower satiety scores compared to TF2 and TF3.
In the present study, consumption of low-GI crunchy bites with milk or coffee was associated with greater satiety within 15 minutes post-ingestion. This enhanced satiety response may be partly explained by gastric distension and the activation of stretch-sensitive mechanoreceptors, such as intraganglionic laminar endings, which stimulate vagal afferent pathways to promote satiety 36. These findings suggest that adding milk or coffee may modulate physiological mechanisms that influence satiety, potentially through changes in gastric volume or nutrient interactions. Moreover, the significant interaction between food type and time on satiety and fullness suggests that consuming low-GI crunchy bites as an intermeal snack could enhance satiety and reduce subsequent energy intake 37. Evaluating appetite involves examining various interconnected sensations, including hunger, fullness, satiety, the desire to eat, and the expected amount of food intake. The visual analog scale (VAS) is a widely used and validated tool for measuring subjective appetite sensations, consisting of a continuous line anchored by descriptors that represent the extremes of each feeling. Multiple validation studies have demonstrated the reproducibility and reliability of VAS measurements in assessing appetite-related perceptions 38. Improving satiety is a key strategy for lowering total energy intake and aiding weight management. Therefore, assessing satiety responses and ad libitum food intake during subsequent meals offers a relatively simple and cost-effective method for studying appetite regulation and the mechanisms involved in weight control 39.
3.6. Correlation of the Postprandial Blood Glucose and Satiety ResponseFigure 3 presents the correlation between postprandial blood glucose concentrations and satiety responses for the three TFs. Postprandial glucose responses were strongly and inversely correlated with subjective satiety ratings across all TFs. For RF, a strong negative correlation was observed (r = -0.89, p < 0.001), indicating that higher glucose excursions were associated with lower satiety. Similarly, consumption of the low-GI crunchy bites alone showed a strong inverse relationship (r = -0.88, p < 0.001), reflecting reduced fullness with more rapid glucose increases. When crunchy bites were consumed with fresh milk, the correlation remained strong (r = -0.89, p < 0.001), suggesting that milk may modestly moderate glucose responses but does not eliminate the inverse relationship with satiety. Crunchy bites consumed with coffee also demonstrated a strong negative correlation (r = -0.85, p < 0.001), indicating that postprandial glucose rises were consistently associated with decreased satiety, with coffee potentially exerting a minor modulatory effect on appetite signals.
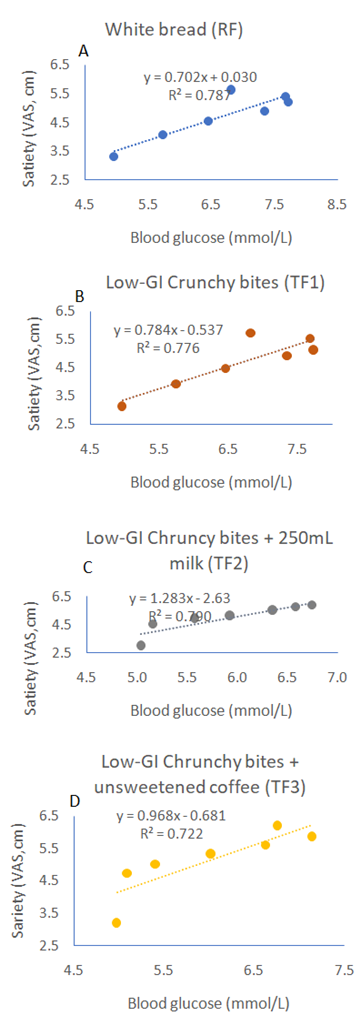
The strong inverse correlations we observed between post-meal increases in blood glucose and subjective satiety (r = –0.85 to –0.89, p < 0.001) highlight a significant association, in which higher glycemic responses are associated with reduced feelings of fullness. This pattern aligns with theories of appetite regulation: rapid and substantial increases in blood glucose after eating may compromise the effectiveness or timing of gut-produced satiety signals, such as glucagon-like peptide-1 (GLP-1) and peptide YY (PYY) 40. In our data, the inverse relationship between glucose and satiety suggests that meals causing higher glycemic peaks might weaken satiety signals. For instance, high glucose spikes can lead to less responsive or delayed GLP-1/PYY responses, which may decrease feelings of fullness and potentially increase subsequent energy intake. This idea is supported by animal studies in which blocking GLP-1 or PYY signaling affects how fermentable-fiber diets reduce fat gain 41. Our findings thus contribute novel insight; regardless of the meal type (white bread, crunchy bites alone, with milk, or with coffee), there was a consistent inverse glucose and satiety correlation, indicating that rapid glycemic rise may be a dominant driver of reduced fullness, even when modifiers such as milk or coffee are present. The slight moderation seen with milk or coffee suggests that these co-ingested items may slightly slow absorption or modify appetite signals, but they do not eliminate the underlying link between glucose and satiety.
The low-GI crunchy bites created in this study contain 12.1 grams of dietary fiber per 100 grams, roughly double the threshold required to be considered "high in fiber” under the Malaysian Food Act 42. Research with healthy adults indicates that consuming glucose drinks with soluble dietary fiber significantly lowers post-meal plasma glucose levels compared to drinks without fiber 43. Likewise, Wu et al. 44 found that meals fortified with dietary fiber had a notably lower glucose area under the curve (AUC) than meals without fiber. Dietary fibers resist breakdown by enzymes in the human small intestine. Among these, gel-forming soluble fibers are known to reduce post-meal blood sugar spikes by slowing gastric emptying, thereby prolonging feelings of fullness and suppressing appetite 16. Silva reported that high-fiber meals lowered postprandial ghrelin levels, thereby reducing hunger 45. Collectively, these hormonal responses help decrease caloric intake at subsequent meals, supporting both weight management and glycemic regulation. Beyond its role in glycemic control, dietary fiber has been shown to enhance satiety and reduce overall energy intake, a critical consideration for managing obesity, a common comorbidity of type 2 diabetes.
Heartfelt thanks go to Manjung Naluri Sdn. Bhd., Setiawan, Perak, for generously providing the low-GI crunchy bite samples. The developed low-GI crunchy bites technology has been transferred to the company for commercialization.
| [1] | Tham, K.W., et al., Obesity in South and Southeast Asia—A new consensus on care and management. Obesity Reviews, 2023. 24(2): p. e13520. | ||
| In article | View Article PubMed | ||
| [2] | Brauer, M., et al., Global burden and strength of evidence for 88 risk factors in 204 countries and 811 subnational locations, 1990–2021: a systematic analysis for the Global Burden of Disease Study 2021. The Lancet, 2024. 403(10440): p. 2162-2203. | ||
| In article | View Article PubMed | ||
| [3] | Phelps, N.H., et al., Worldwide trends in underweight and obesity from 1990 to 2022: a pooled analysis of 3663 population-representative studies with 222 million children, adolescents, and adults. The Lancet, 2024. 403(10431): p. 1027-1050. | ||
| In article | View Article PubMed | ||
| [4] | Tee, E.S. and S.H. Voon, Combating obesity in Southeast Asia countries: current status and the way forward. Global Health Journal, 2024. 8(3): p. 147-151. | ||
| In article | View Article | ||
| [5] | Ejigu, B.A. and F.N. Tiruneh, The link between overweight/obesity and noncommunicable diseases in Ethiopia: evidences from nationwide WHO STEPS survey 2015. International journal of hypertension, 2023. 2023(1): p. 2199853. | ||
| In article | View Article PubMed | ||
| [6] | Min, J., et al., Double burden of diseases worldwide: Coexistence of undernutrition and overnutrition‐related non‐communicable chronic diseases. Obesity reviews, 2018. 19(1): p. 49-61. | ||
| In article | View Article PubMed | ||
| [7] | Chen, L., D.J. Magliano, and P.Z. Zimmet, The worldwide epidemiology of type 2 diabetes mellitus—present and future perspectives. Nature reviews endocrinology, 2012. 8(4): p. 228-236. | ||
| In article | View Article PubMed | ||
| [8] | Zhou, B., et al., Worldwide trends in diabetes prevalence and treatment from 1990 to 2022: a pooled analysis of 1108 population-representative studies with 141 million participants. The Lancet, 2024. 404(10467): p. 2077-2093. | ||
| In article | View Article PubMed | ||
| [9] | Hu, F.B., Globalization of diabetes: the role of diet, lifestyle, and genes. Diabetes care, 2011. 34(6): p. 1249-1257. | ||
| In article | View Article PubMed | ||
| [10] | Gupta, A., High healthcare cost boosting medical insurance sector in Malaysia: Ken research. Retrieved June, 2017. 5: p. 2020. | ||
| In article | |||
| [11] | Brand-Miller, J.C., Postprandial glycemia, glycemic index, and the prevention of type 2 diabetes12. The American journal of clinical nutrition, 2004. 80(2): p. 243-244. | ||
| In article | View Article PubMed | ||
| [12] | Lazarim, F.L., et al., Understanding the glycemic index and glycemic load and their practical applications. Biochemistry and Molecular Biology Education, 2009. 37(5): p. 296-300. | ||
| In article | View Article PubMed | ||
| [13] | Gerstein, D.E., et al., Clarifying concepts about macronutrients’ effects on satiation and satiety. Journal of the American Dietetic Association, 2004. 104(7): p. 1151-1153. | ||
| In article | View Article PubMed | ||
| [14] | Solah, V.A., et al., Differences in satiety effects of alginate-and whey protein-based foods. Appetite, 2010. 54(3): p. 485-491. | ||
| In article | View Article PubMed | ||
| [15] | Jia, H., F. Ren, and H. Liu, Development of low glycemic index food products with wheat resistant starch: a review. Carbohydrate Polymers, 2025. 361: p. 123637. | ||
| In article | View Article PubMed | ||
| [16] | Olayinka, O., Effect of high-fiber samosa consumption on blood sugar levels and satiety in diabetic patients. 2023. | ||
| In article | View Article | ||
| [17] | He, T., et al., Insoluble dietary fiber from wheat bran retards starch digestion by reducing the activity of alpha-amylase. Food Chemistry, 2023. 426: p. 136624. | ||
| In article | View Article PubMed | ||
| [18] | Ma, F., et al., Influences of hydrothermal and pressure treatments of wheat bran on the quality and sensory attributes of whole wheat Chinese steamed bread and pancakes. Journal of Cereal Science, 2021. 102: p. 103356. | ||
| In article | View Article | ||
| [19] | Association, W.M., WMA Declaration of Helsinki-Ethical Principles for Medical Research Involving Human Subjects. | ||
| In article | |||
| [20] | Amiot, M.J., C. Riva, and A. Vinet, Effects of dietary polyphenols on metabolic syndrome features in humans: a systematic review. Obes Rev, 2016. 17(7): p. 573-86. | ||
| In article | View Article PubMed | ||
| [21] | Flint, A., et al., Reproducibility, power and validity of visual analogue scales in assessment of appetite sensations in single test meal studies. International journal of obesity, 2000. 24(1): p. 38-48. | ||
| In article | View Article PubMed | ||
| [22] | Brouns, F., et al., Glycaemic index methodology. Nutrition research reviews, 2005. 18(1): p. 145-171. | ||
| In article | View Article PubMed | ||
| [23] | Wolever, T.M. and D.J. Jenkins, The use of the glycémie index in predicting the blood glucose response to mixed meals. The American journal of clinical nutrition, 1986. 43(1): p. 167-172. | ||
| In article | View Article PubMed | ||
| [24] | Al Dhaheri, A.S., et al., The effect of nutritional composition on the glycemic index and glycemic load values of selected Emirati foods. Bmc Nutrition, 2015. 1(1): p. 4. | ||
| In article | View Article | ||
| [25] | Salmeron, J., et al., Dietary fiber, glycemic load, and risk of non—insulin-dependent diabetes mellitus in women. Jama, 1997. 277(6): p. 472-477. | ||
| In article | View Article PubMed | ||
| [26] | Hätönen, K.A., et al., Coffee does not modify postprandial glycaemic and insulinaemic responses induced by carbohydrates. European journal of nutrition, 2012. 51(7): p. 801-806. | ||
| In article | View Article PubMed | ||
| [27] | Moisey, L.L., L.E. Robinson, and T.E. Graham, Consumption of caffeinated coffee and a high carbohydrate meal affects postprandial metabolism of a subsequent oral glucose tolerance test in young, healthy males. British journal of nutrition, 2010. 103(6): p. 833-841. | ||
| In article | View Article PubMed | ||
| [28] | Johnston, K.L., M.N. Clifford, and L.M. Morgan, Coffee acutely modifies gastrointestinal hormone secretion and glucose tolerance in humans: glycemic effects of chlorogenic acid and caffeine. The American journal of clinical nutrition, 2003. 78(4): p. 728-733. | ||
| In article | View Article PubMed | ||
| [29] | Shearer, J., et al., Quinides of roasted coffee enhance insulin action in conscious rats. The Journal of nutrition, 2003. 133(11): p. 3529-3532. | ||
| In article | View Article PubMed | ||
| [30] | Van Dijk, A.E., et al., Acute effects of decaffeinated coffee and the major coffee components chlorogenic acid and trigonelline on glucose tolerance. Diabetes care, 2009. 32(6): p. 1023-1025. | ||
| In article | View Article PubMed | ||
| [31] | Thom, E., The effect of chlorogenic acid enriched coffee on glucose absorption in healthy volunteers and its effect on body mass when used long-term in overweight and obese people. Journal of International Medical Research, 2007. 35(6): p. 900-908. | ||
| In article | View Article PubMed | ||
| [32] | Li, J., E. Janle, and W.W. Campbell, Postprandial Glycemic and Insulinemic Responses to Common Breakfast Beverages Consumed with a Standard Meal in Adults Who Are Overweight and Obese. Nutrients, 2017. 9(1): p. 32. | ||
| In article | View Article PubMed | ||
| [33] | Hoyt, G., M.S. Hickey, and L. Cordain, Dissociation of the glycaemic and insulinaemic responses to whole and skimmed milk. British Journal of Nutrition, 2005. 93(2): p. 175-177. | ||
| In article | View Article PubMed | ||
| [34] | Nilsson, M., et al., Glycemia and insulinemia in healthy subjects after lactose-equivalent meals of milk and other food proteins: the role of plasma amino acids and incretins. The American journal of clinical nutrition, 2004. 80(5): p. 1246-1253. | ||
| In article | View Article PubMed | ||
| [35] | van Meijl, L.E. and R.P. Mensink, Effects of milk and milk constituents on postprandial lipid and glucose metabolism in overweight and obese men. British journal of nutrition, 2013. 110(3): p. 413-419. | ||
| In article | View Article PubMed | ||
| [36] | Feinle-Bisset, C. and M. Horowitz, Appetite and Satiety Control—Contribution of Gut Mechanisms. 2021, MDPI. p. 3635. | ||
| In article | View Article PubMed | ||
| [37] | Vatanparast, H., et al., Time, location and frequency of snack consumption in different age groups of Canadians. Nutrition journal, 2020. 19(1): p. 85. | ||
| In article | View Article PubMed | ||
| [38] | Gilbert, J.-A., et al., Relationship between diet-induced changes in body fat and appetite sensations in women. Appetite, 2009. 52(3): p. 809-812. | ||
| In article | View Article PubMed | ||
| [39] | Federici, A., Handbook of Assessment Methods for Eating Behaviors and Weight-Related Problems: Measures, Theory, and Research by David B. Allison and Monica L. Baskin (Eds.). Los Angeles, CA: Sage Publications, Inc., 2009, 701 pages, $130.00. 2011, Taylor & Francis. | ||
| In article | |||
| [40] | Barakat, G.M., et al., Satiety: a gut–brain–relationship. The journal of physiological sciences, 2024. 74(1): p. 11. | ||
| In article | View Article PubMed | ||
| [41] | Zhou, J., et al., The importance of GLP‐1 and PYY in resistant starch's effect on body fat in mice. Molecular nutrition & food research, 2015. 59(5): p. 1000-1003. | ||
| In article | View Article PubMed | ||
| [42] | Programme, F.S.a.Q., Guideline on Labelling Requirement Under Food Act 1983 and Regulations Thereunder, K.K. Malaysia, Editor. 2023. | ||
| In article | |||
| [43] | Kim, H.-K., et al., Effect of the intake of a snack containing dietary fiber on postprandial glucose levels. Foods, 2020. 9(10): p. 1500. | ||
| In article | View Article PubMed | ||
| [44] | Wu, S., et al., A new dietary fiber can enhance satiety and reduce postprandial blood glucose in healthy adults: A randomized cross-over trial. Nutrients, 2023. 15(21): p. 4569. | ||
| In article | View Article PubMed | ||
| [45] | Silva, F.M., et al., A high–glycemic index, low-fiber breakfast affects the postprandial plasma glucose, insulin, and ghrelin responses of patients with type 2 diabetes in a randomized clinical trial. The journal of nutrition, 2015. 145(4): p. 736-741. | ||
| In article | View Article PubMed | ||
Published with license by Science and Education Publishing, Copyright © 2026 Hussain Zaki U.K., Jack A., Khalid K.H., Ahmad Rudin A.M. and Imam Musaniff A.H.
![]() This work is licensed under a Creative Commons Attribution 4.0 International License. To view a copy of this license, visit
http://creativecommons.org/licenses/by/4.0/
This work is licensed under a Creative Commons Attribution 4.0 International License. To view a copy of this license, visit
http://creativecommons.org/licenses/by/4.0/
| [1] | Tham, K.W., et al., Obesity in South and Southeast Asia—A new consensus on care and management. Obesity Reviews, 2023. 24(2): p. e13520. | ||
| In article | View Article PubMed | ||
| [2] | Brauer, M., et al., Global burden and strength of evidence for 88 risk factors in 204 countries and 811 subnational locations, 1990–2021: a systematic analysis for the Global Burden of Disease Study 2021. The Lancet, 2024. 403(10440): p. 2162-2203. | ||
| In article | View Article PubMed | ||
| [3] | Phelps, N.H., et al., Worldwide trends in underweight and obesity from 1990 to 2022: a pooled analysis of 3663 population-representative studies with 222 million children, adolescents, and adults. The Lancet, 2024. 403(10431): p. 1027-1050. | ||
| In article | View Article PubMed | ||
| [4] | Tee, E.S. and S.H. Voon, Combating obesity in Southeast Asia countries: current status and the way forward. Global Health Journal, 2024. 8(3): p. 147-151. | ||
| In article | View Article | ||
| [5] | Ejigu, B.A. and F.N. Tiruneh, The link between overweight/obesity and noncommunicable diseases in Ethiopia: evidences from nationwide WHO STEPS survey 2015. International journal of hypertension, 2023. 2023(1): p. 2199853. | ||
| In article | View Article PubMed | ||
| [6] | Min, J., et al., Double burden of diseases worldwide: Coexistence of undernutrition and overnutrition‐related non‐communicable chronic diseases. Obesity reviews, 2018. 19(1): p. 49-61. | ||
| In article | View Article PubMed | ||
| [7] | Chen, L., D.J. Magliano, and P.Z. Zimmet, The worldwide epidemiology of type 2 diabetes mellitus—present and future perspectives. Nature reviews endocrinology, 2012. 8(4): p. 228-236. | ||
| In article | View Article PubMed | ||
| [8] | Zhou, B., et al., Worldwide trends in diabetes prevalence and treatment from 1990 to 2022: a pooled analysis of 1108 population-representative studies with 141 million participants. The Lancet, 2024. 404(10467): p. 2077-2093. | ||
| In article | View Article PubMed | ||
| [9] | Hu, F.B., Globalization of diabetes: the role of diet, lifestyle, and genes. Diabetes care, 2011. 34(6): p. 1249-1257. | ||
| In article | View Article PubMed | ||
| [10] | Gupta, A., High healthcare cost boosting medical insurance sector in Malaysia: Ken research. Retrieved June, 2017. 5: p. 2020. | ||
| In article | |||
| [11] | Brand-Miller, J.C., Postprandial glycemia, glycemic index, and the prevention of type 2 diabetes12. The American journal of clinical nutrition, 2004. 80(2): p. 243-244. | ||
| In article | View Article PubMed | ||
| [12] | Lazarim, F.L., et al., Understanding the glycemic index and glycemic load and their practical applications. Biochemistry and Molecular Biology Education, 2009. 37(5): p. 296-300. | ||
| In article | View Article PubMed | ||
| [13] | Gerstein, D.E., et al., Clarifying concepts about macronutrients’ effects on satiation and satiety. Journal of the American Dietetic Association, 2004. 104(7): p. 1151-1153. | ||
| In article | View Article PubMed | ||
| [14] | Solah, V.A., et al., Differences in satiety effects of alginate-and whey protein-based foods. Appetite, 2010. 54(3): p. 485-491. | ||
| In article | View Article PubMed | ||
| [15] | Jia, H., F. Ren, and H. Liu, Development of low glycemic index food products with wheat resistant starch: a review. Carbohydrate Polymers, 2025. 361: p. 123637. | ||
| In article | View Article PubMed | ||
| [16] | Olayinka, O., Effect of high-fiber samosa consumption on blood sugar levels and satiety in diabetic patients. 2023. | ||
| In article | View Article | ||
| [17] | He, T., et al., Insoluble dietary fiber from wheat bran retards starch digestion by reducing the activity of alpha-amylase. Food Chemistry, 2023. 426: p. 136624. | ||
| In article | View Article PubMed | ||
| [18] | Ma, F., et al., Influences of hydrothermal and pressure treatments of wheat bran on the quality and sensory attributes of whole wheat Chinese steamed bread and pancakes. Journal of Cereal Science, 2021. 102: p. 103356. | ||
| In article | View Article | ||
| [19] | Association, W.M., WMA Declaration of Helsinki-Ethical Principles for Medical Research Involving Human Subjects. | ||
| In article | |||
| [20] | Amiot, M.J., C. Riva, and A. Vinet, Effects of dietary polyphenols on metabolic syndrome features in humans: a systematic review. Obes Rev, 2016. 17(7): p. 573-86. | ||
| In article | View Article PubMed | ||
| [21] | Flint, A., et al., Reproducibility, power and validity of visual analogue scales in assessment of appetite sensations in single test meal studies. International journal of obesity, 2000. 24(1): p. 38-48. | ||
| In article | View Article PubMed | ||
| [22] | Brouns, F., et al., Glycaemic index methodology. Nutrition research reviews, 2005. 18(1): p. 145-171. | ||
| In article | View Article PubMed | ||
| [23] | Wolever, T.M. and D.J. Jenkins, The use of the glycémie index in predicting the blood glucose response to mixed meals. The American journal of clinical nutrition, 1986. 43(1): p. 167-172. | ||
| In article | View Article PubMed | ||
| [24] | Al Dhaheri, A.S., et al., The effect of nutritional composition on the glycemic index and glycemic load values of selected Emirati foods. Bmc Nutrition, 2015. 1(1): p. 4. | ||
| In article | View Article | ||
| [25] | Salmeron, J., et al., Dietary fiber, glycemic load, and risk of non—insulin-dependent diabetes mellitus in women. Jama, 1997. 277(6): p. 472-477. | ||
| In article | View Article PubMed | ||
| [26] | Hätönen, K.A., et al., Coffee does not modify postprandial glycaemic and insulinaemic responses induced by carbohydrates. European journal of nutrition, 2012. 51(7): p. 801-806. | ||
| In article | View Article PubMed | ||
| [27] | Moisey, L.L., L.E. Robinson, and T.E. Graham, Consumption of caffeinated coffee and a high carbohydrate meal affects postprandial metabolism of a subsequent oral glucose tolerance test in young, healthy males. British journal of nutrition, 2010. 103(6): p. 833-841. | ||
| In article | View Article PubMed | ||
| [28] | Johnston, K.L., M.N. Clifford, and L.M. Morgan, Coffee acutely modifies gastrointestinal hormone secretion and glucose tolerance in humans: glycemic effects of chlorogenic acid and caffeine. The American journal of clinical nutrition, 2003. 78(4): p. 728-733. | ||
| In article | View Article PubMed | ||
| [29] | Shearer, J., et al., Quinides of roasted coffee enhance insulin action in conscious rats. The Journal of nutrition, 2003. 133(11): p. 3529-3532. | ||
| In article | View Article PubMed | ||
| [30] | Van Dijk, A.E., et al., Acute effects of decaffeinated coffee and the major coffee components chlorogenic acid and trigonelline on glucose tolerance. Diabetes care, 2009. 32(6): p. 1023-1025. | ||
| In article | View Article PubMed | ||
| [31] | Thom, E., The effect of chlorogenic acid enriched coffee on glucose absorption in healthy volunteers and its effect on body mass when used long-term in overweight and obese people. Journal of International Medical Research, 2007. 35(6): p. 900-908. | ||
| In article | View Article PubMed | ||
| [32] | Li, J., E. Janle, and W.W. Campbell, Postprandial Glycemic and Insulinemic Responses to Common Breakfast Beverages Consumed with a Standard Meal in Adults Who Are Overweight and Obese. Nutrients, 2017. 9(1): p. 32. | ||
| In article | View Article PubMed | ||
| [33] | Hoyt, G., M.S. Hickey, and L. Cordain, Dissociation of the glycaemic and insulinaemic responses to whole and skimmed milk. British Journal of Nutrition, 2005. 93(2): p. 175-177. | ||
| In article | View Article PubMed | ||
| [34] | Nilsson, M., et al., Glycemia and insulinemia in healthy subjects after lactose-equivalent meals of milk and other food proteins: the role of plasma amino acids and incretins. The American journal of clinical nutrition, 2004. 80(5): p. 1246-1253. | ||
| In article | View Article PubMed | ||
| [35] | van Meijl, L.E. and R.P. Mensink, Effects of milk and milk constituents on postprandial lipid and glucose metabolism in overweight and obese men. British journal of nutrition, 2013. 110(3): p. 413-419. | ||
| In article | View Article PubMed | ||
| [36] | Feinle-Bisset, C. and M. Horowitz, Appetite and Satiety Control—Contribution of Gut Mechanisms. 2021, MDPI. p. 3635. | ||
| In article | View Article PubMed | ||
| [37] | Vatanparast, H., et al., Time, location and frequency of snack consumption in different age groups of Canadians. Nutrition journal, 2020. 19(1): p. 85. | ||
| In article | View Article PubMed | ||
| [38] | Gilbert, J.-A., et al., Relationship between diet-induced changes in body fat and appetite sensations in women. Appetite, 2009. 52(3): p. 809-812. | ||
| In article | View Article PubMed | ||
| [39] | Federici, A., Handbook of Assessment Methods for Eating Behaviors and Weight-Related Problems: Measures, Theory, and Research by David B. Allison and Monica L. Baskin (Eds.). Los Angeles, CA: Sage Publications, Inc., 2009, 701 pages, $130.00. 2011, Taylor & Francis. | ||
| In article | |||
| [40] | Barakat, G.M., et al., Satiety: a gut–brain–relationship. The journal of physiological sciences, 2024. 74(1): p. 11. | ||
| In article | View Article PubMed | ||
| [41] | Zhou, J., et al., The importance of GLP‐1 and PYY in resistant starch's effect on body fat in mice. Molecular nutrition & food research, 2015. 59(5): p. 1000-1003. | ||
| In article | View Article PubMed | ||
| [42] | Programme, F.S.a.Q., Guideline on Labelling Requirement Under Food Act 1983 and Regulations Thereunder, K.K. Malaysia, Editor. 2023. | ||
| In article | |||
| [43] | Kim, H.-K., et al., Effect of the intake of a snack containing dietary fiber on postprandial glucose levels. Foods, 2020. 9(10): p. 1500. | ||
| In article | View Article PubMed | ||
| [44] | Wu, S., et al., A new dietary fiber can enhance satiety and reduce postprandial blood glucose in healthy adults: A randomized cross-over trial. Nutrients, 2023. 15(21): p. 4569. | ||
| In article | View Article PubMed | ||
| [45] | Silva, F.M., et al., A high–glycemic index, low-fiber breakfast affects the postprandial plasma glucose, insulin, and ghrelin responses of patients with type 2 diabetes in a randomized clinical trial. The journal of nutrition, 2015. 145(4): p. 736-741. | ||
| In article | View Article PubMed | ||


