This study determines the best machine learning (ML) models to predict the most accurate results in COVID-19 seropositivity using existing data. The study used the New York City Community Health Survey (NYC CHS) 2020 dataset for the analysis, and a predictive modeling approach to develop and select an optimal ML model that would accurately predict COVID-19 seropositivity from various ML algorithms. Thus, the LightGBM was found to have the highest Area Under the Curve and overall test metrics including accuracy, precision, and recall, and was therefore selected as the best-performing machine learning model.
The novel coronavirus, first identified in Wuhan, China, in December 2019, prompted the World Health Organization to declare a global health emergency by January 30, 2020. The immense burdens placed on the most vulnerable groups emerged and were brought to light by relevant epidemiologic trends. By May 1, 2022, an estimated 10.5 million children worldwide had lost parents or caregivers, with around 7.5 million orphaned 1. In the US, 204,000 children and teens lost caregivers 2, and 115,000 healthcare workers died from the virus 3. According to Uphoff et al., 4, "Although most countries and healthcare systems worldwide have been affected by the COVID-19 pandemic, some groups of the population may be more vulnerable to detrimental effects of the pandemic" (p. 2). Developing proof demonstrates that disability and incapacity due to the coronavirus among racial-ethnic minorities is visible at disproportionate levels, given the transmission rates as compared to other population segments worldwide. Vulnerable groups like daily wage-based workers, children and others faced significant challenges, as documented by studies worldwide. A study in Bangladesh found severe food insecurity among households relying on daily-wage workers, who experienced considerable economic loss due to lockdowns, to an estimate of US$ 64.2 million 5. In Australia, vulnerable children and young people faced compounded health risks and barriers to accessing support (Jones et al., 2020), while disparities in occupational risk highlighted the plight of workers in health, tourism, and retail industries 6.
In the US, too, the pandemic led to significant job losses, disproportionately affecting minorities 7, 8. The loss of jobs meant the loss of health insurance, thus creating barriers to treatment, support programs for employment, childcare, and healthy food access, which are critical for vulnerable populations. These determinants significantly impacted COVID-19 morbidity and mortality, exacerbating health disparities in underserved populations 8.
Such public health emergencies can occur anytime, and boosting preparedness will help save lives. The Healthy People (HP) initiative, designed to guide national health programs and disease prevention, brought out the Healthy People 2030, which set data-driven national objectives to improve health and well-being over the next decade. These objectives ensure that individuals, communities, and organizations are prepared for disasters, disease outbreaks, and medical emergencies by planning and training individuals in emergency response, including evacuation plans in case of natural disasters 9. Additionally, it ensures that people are prepared for disease outbreaks and most importantly, providing accurate and complete information through effective multidirectional communication models to help people protect themselves during emergencies.
Enhancing the use and potential of information technology in public health is yet another goal 10. This is complemented by the goal of increasing the manpower trained globally to prevent, detect, or respond to public health threats 10.
These goals can be achieved by: i) using currently available data to learn more about the social, environmental, and individual determinants of health in a given population, enabling us to identify and support vulnerable populations during emergencies; ii) by using data science methodologies to create predictive models that can be used in future pandemic scenarios, as well as for training public health professionals to improve response efforts.
This study also addresses the need for predictive models using AI and ML technologies to predict disease seropositivity. The ability to forecast future health disasters and control the main factors that affect the prevalence of disease using informatics allows for sophisticated readiness among public health professionals who are then tasked with managing policies, programs, and communications. Decision making for the allocation of funds and the creation of programs that improve individuals' social and economic conditions, which often lead to health disparities, form another dimension of the issue. Therefore, using such models align with the possible objectives of HP 2030.
The research question guiding this study is: Which machine learning models predict COVID-19 seropositivity using existing data with the highest accuracy?
The analyses assess the relative effects of each variable in the study, when making a prediction using the feature importance methodology to indicate their significance. The investigation will create four ML models: the random forest, neural network, XGBoost, and LightGBM. Scores will then be assigned to input features used in predictive modeling. These analyses are expanded upon in the methodology section.
This study mainly focuses on developing a model that will help in accurately predicting COVID-19 seropositivity with future data with similar variables. Using machine learning algorithms, it also assesses which variables (examples of SDOH) are highly correlated to COVID seroprevalence. As discussed above, machine learning algorithms look for innate patterns that provide insight into and aid in prediction and decision-making. They are also recommended when a study has many variables in the dataset, like in this study where approximately 38 variables were analyzed. Using machine learning techniques such as feature selection help segregate variables based on their contribution or need in such models. Moreover, given that predictive models frequently incorporate a machine learning algorithm, such analytics and machine learning go hand in hand. These models can be trained to react to new information or values and produce outcomes that the research question requires. Hence, the study serves as a foundation for future research where models can be tweaked to respond to new data.
1.1. Emergency PreparednessAccording to Nelson et al. 11, Public health emergency preparedness (PHEP) can be defined as “the capability of the public health and health care systems, communities, and individuals, to prevent, protect against, quickly respond to, and recover from health emergencies, particularly those whose scale, timing, or unpredictability threatens to overwhelm routine capabilities” (p. 1) like in outbreaks of SARS, H1N1, Ebola, Zika and the more recent COVID-19. An emergent situation is when the health effects can overwhelm the community’s ability to deal with them. “Responsibility for the preparedness of the nation’s communities lie not only with governmental agencies but also with active, engaged, and mobilized community residents, businesses, and nongovernmental organizations” 11.
Nelson et al. 11 have proposed the following about the PHEP approach:
As much as possible, PHEP should be integrated with and expand upon day-to-day public health practices and build upon existing systems, not developed de novo. PHEP should also involve scalable responses, with core building-block capabilities and functions that can be used during small, routine events and scaled up for more significant events. Finally, justice, accountability, transparency, and public engagement are essential in all aspects of PHEP (p.2).
Even though the federal government invested more than $6 billion to improve the United States’ capacity to prepare for and respond to public health emergencies since September 11, 2001, it was unclear if these efforts enhanced the nation’s capacity to respond to another public health emergency. The need for an agreeable PHEP and how it should be measured was recognized as part of the issue. To elucidate this issue, the Health and Human Services recruited the RAND team – a nonprofit that helps improve policy and decision-making through research and analysis – in February 2007 to generalize PHEP guidelines and measures 11.
For jurisdictions to achieve the PHEP’s vision, the following list of action-oriented elements was created with specific and measurable aspects:
1.2. Key Elements of PreparednessA prepared community develops, maintains, and uses a realistic preparedness plan, integrated with routine practices. Such plans encompass the following components:
• Health risk assessment: Identify hazards and vulnerabilities (e.g., community health assessment, populations at risk, high-hazard industries, physical structures of importance) that are the basis of planning.
• Legal climate: Identify and address issues concerning legal authority and liability barriers to effectively monitor, prevent, or respond to a public health emergency.
• Roles and responsibilities: Clearly define, assign, and test responsibilities in all sectors, at all levels of government, and with individuals and ensure each group’s integration.
• Incident Command System: Develop, test, and improve decision-making and response capability using an integrated Incident Command System (ICS) at all response levels.
• Public engagement: Educate, engage, and mobilize the public for full and active participation in public health emergency preparedness.
• Epidemiology functions: Maintain and improve the systems that monitor, detect, and investigate potential hazards, particularly those that are environmental, radiological, toxic, or infectious.
• Laboratory functions: Maintain and improve the systems that test for potential hazards, particularly in environmental, radiological, toxic, or infectious categories.
• Countermeasures and mitigation strategies: Develop, test, and improve community mitigation strategies (e.g., isolation and quarantine, social distancing) and countermeasure distribution strategies when and where appropriate.
• Mass health care: Develop, test, and improve the provision of mass health care services.
• Public information and communication: Develop, practice, and improve the rapid provision of accurate and credible information publicly that is culturally appropriate.
• Robust supply chain: Identify critical resources for public health emergency response and practice and improve the ability to deliver these resources throughout the supply chain.
• Operations-ready workers and volunteers: Develop and maintain a public health and health care workforce with skills and capabilities to perform optimally in a public health emergency.
• Leadership: Train, recruit, and develop public health leaders (e.g., to mobilize resources, engage the community, develop interagency relationships, communicate with the public).
• Testing operational capabilities: Practice, review, report on, and improve public health emergency preparedness with regular public health events, supplemented with drills and exercises when appropriate.
• Performance management: Implement a performance management and accountability system.
• Financial tracking: Develop, test, and improve charge capture, accounting, and other financial systems to track resources and ensure adequate and timely reimbursement.
The research aims here focus on predictive modeling to develop a model that will help in accurately predicting COVID-19 seropositivity with future data with similar variables. Using machine learning algorithms, we will also assess which variables (examples of SDOH) are highly correlated to COVID seroprevalence. When considering the above-mentioned PHEP action items for Preplanned and Coordinated Rapid-Response Capability, it is comprehensible that elements 1 & 2 revolve around community assessments, and elements 3, 4, & 5 are focused on communications and rapid response. Importantly, the rest of the elements “involve the ability to rapidly implement public health functions, including capabilities to detect, investigate, and identify health hazards; deploy mitigation and countermeasure strategies; and provide accurate and credible messages to the public during a crisis” 11. This study aspires to contribute to these elements so that the models will help in early identification of high-risk populations and mitigate hazards through various public health efforts and sustain emergency preparedness goals.
The variables of interest in this study include: general health status; access to health insurance; access to a personal care provider; ability to receive medical care (12 months); prescription medication use; the prevalence of diseases such as hypertension, asthma, and diabetes (either type 1 or 2); Kessler-6 index score for mental health; the prevalence of non-specific psychological distress; mental health treatment utilization; tobacco use; alcohol use; home ownership; rent payment delays; the borough of residence; flu vaccination status; physical activity engagement (30 days); consumption of fruits and vegetables; consumption of sugar-sweetened beverages; difficulty in performing daily activities; assisted device utilization; engagement in HIV testing; the incidence of interpersonal violence; the incidence of suicidal thoughts; and lastly demographics such as age, race, birth sex, orientation, gender, marital status, education levels, employment status, number of adults in the household, imputed poverty level, citizenship, and BMI. The outcome variable will be COVID-19 seropositivity. These variables fall under the three categories of determinants of health: social and economic, environmental, and individual. The objective behind the variable selection in this study is discussed in the literature review section.
The data used in this analysis comes from the New York City Community Health Survey (CHS), conducted by the New York City Department of Health and Mental Hygiene, a part of the Bureau of Epidemiology Services 12. The annual telephonic cross-sectional survey provides substantial insight into the health of New Yorkers with neighborhood, borough, and citywide estimations. The CHS uses a disproportionate stratified random sample to help assure geographic representativeness across the city 13. “Participation goals are set for 42 United Hospital Fund neighborhoods, defined by contiguous zip codes” (p. 188).
The survey recruits approximately 10,000 randomly selected adults every year from all five boroughs in New York City (Manhattan, Brooklyn, Queens, Bronx, and Staten Island). The data is collected from landline and mobile phone participants through a computer-assisted telephone interviewing (CATI) system. The target population includes adults in non-group quarters aged 18 and above who live in New York City. The survey is also translated into languages other than English, like Spanish, Russian, Mandarin, Cantonese, Bengali and Haitian Creole.
The CHS for COVID-19 included data collection for children. 5,305 adults were interviewed with this module from March to August 2020. A total of 6,777 New Yorkers were included in the sample and asked about the experiences of an additional 1,472 children. 75% of homes with minors were asked to answer the COVID-19 module questions on behalf of the child from March through May 2020 if the adult conducting the survey knew enough of them. Participants under 18 were not included in this study. Participants for the serosurvey were recruited from the ongoing NYC CHS. From June to October 2020, 1074, respondents completed the survey; 497 provided whole blood, and 577 provided only self-reported antibody test results 13.
The data are self-reported, and the questionnaire consists of approximately 125 questions focusing on general health status, mental health, health care access, cardiovascular health, diabetes, asthma, immunizations, nutrition and physical activity, smoking, HIV, sexual behavior, alcohol consumption, cancer screening, and other health topics, apart from a few demographic questions. Key decision-makers use the data from this study to understand New York City residents' behaviors and health status and the social determinants of health that influence them.
This study uses a complete case analysis in the form of a case deletion if data is missing. This involves discarding cases with missing values and proceeding with the analysis using standard methods. While more statistical power and large datasets are preferred for machine learning, including missing data for certain variables in the logistic regression or machine learning model is not feasible. For instance, in 2020, 187 people who completed the COVID-19 module did not meet the essential requirements to be included in the primary CHS dataset. Data about these individuals are included in the COVID-19 module dataset but not in the CHS dataset; hence, their demographic variables from the CHS dataset cannot be pulled in. Therefore, the Bureau of Epidemiology recommends that the demographic variables prepared for and included in the stand-alone COVID-19 module dataset is to be only used for the analysis. Additionally, the variable frequencies for COVID-19 module adult demographics differ from the primary CHS demographics, because information was collected about a child living in the household for a section of COVID-19 module respondents. Although the variables represent the same information, the frequencies in the CHS dataset are higher than in the COVID-19 dataset.
CID links the CHS and Population Health Survey responses to results from the NYC Serosurvey. Thus, COVID-19 data may have also been linked to the Serosurvey dataset using CID. The serosurvey dataset includes the results of SARS-CoV-2 antibody tests for a subset of the adult survey population that agreed to provide blood samples for this purpose. The 2020 serosurvey is linked with the Population Health Survey dataset to run analyses by demographic groups or other variables of interest.
The CHS NYC 2020 weights sum to the entire adult and child populations of New York City. Base weight was created using the total population of telephone numbers in each sampling stratum divided by the number of completed interviews for each frame. The number of completed interviews was used instead of the number of phone numbers released for dialing due to the operational burden of gathering those numbers each month and using completed counts accounts for any nonresponse. Some raking variables had missing values; thus imputation was performed. These imputations included assigning missing education to the college graduate category (n=3) and assigning the missing number of children in a household to zero (n=5). The missing sex of the adult (n=2) and the sex of the child (n=6) were randomly assigned to the male or female category with equal probability. The missing child age group (n=7) was randomly assigned to the 0-4 or 5-17 age category with probabilities equal to the NYC population (31% vs. 69%).
A design weight was created by adjusting the base weight by several factors. The first factor was adjusted for landline respondents who confirmed they have multiple landline telephone numbers. The second factor accounted for the oversampling of children in households. The third factor accounted for the random selection of the adult or child within the household. The within-household adjustment was capped at a value of three persons. Telephone status was determined by frame and the responses to questions about landline use on the CHS. Frame overlap was accounted for using the same procedure for the CHS annual weights. Finally, the design weight was multiplied by the compositing factor to create the composite weight.
The age category was split into eight sections: 0-4, 5-17, 18-24, 25-29, 30-44, 45-64, 65-74, and 75+. All children were assigned to a child category for education, whereas adults were assigned according to their education level (less than high school, high school, some college, or college graduate). All other margins were created using all age category. The raking margin variables were created in the completed interview file. Some ranking cells contained very few interviews and thus collapsed. Due to the overall sample size, raking cells of fewer than ten cases were targeted for collapse. The sample was raked to the control totals using the SAS raking macro rake_and_trim_G4_VS. The raking macros were set to a convergence criterion of a maximum difference of 0.05 percentage points between a control total percent and the corresponding weighted sample percent. All interviews were raked together. Trimming parameters were set to limit the weights to 0.12 to 9.0 times the average weight. The resulting weight is named "COVID_RAKED_WT."
To begin with, the R libraries were loaded in RStudio v2022. Then, the haven and Dplyr libraries were loaded in the R script. After loading the combined dataset into the R script, the dimensions were assessed. The SORT command was used to assess the column names (variables). The combined dataset without missing cases has 5305 observations with 202 variables. This dataset is used for RQ1 to assess the characteristics of the population. The FILTER command only added the ‘sero1_result’ to the new dataset. Thus, cases without serosurvey results were removed, and the new data set was left with 928 observations and 202 variables. Interpersonal violence variables were combined with the OR clause. Furthermore, the categorical variables were changed into factors using the MUTATE clause.
One-hot encoding was performed on the categorical variables of the dataset, recording each category variable into individual-level variables with binary coding. This dataset was then split into train and test datasets with a 7:3 ratio for developing and validating the machine learning model.
Each machine learning algorithm is modeled from the training dataset, which is tested on the test dataset to check for its accuracy. This technique also prevents overfitting, which may reduce accuracy on new and future data. The random forest model is conducted in an ensemble technique, combining multiple decision tree models from multiple sample variations to optimize its accuracy. Steps incorporating the procedure to use a random forest model include creating a bootstrapped dataset, creating a decision tree using the bootstrapped dataset only using random variable subsets, and repeating that last step multiple times to create trees. A wide variety of trees make the random forest model more effective than decision trees.
As mentioned above, the study will generate four machine learning algorithm models that predict COVID-19 seropositivity: random forest, neural network, XGBoost, and LightGBM.
Artificial Neural Network (ANN) is a machine learning algorithm that imitates human neurons to predict from a given data. First, the data enters an input layer, which passes onto the hidden layer. The hidden layer conducts most computations and predictions through a complex web of unique mathematical functions called nodes. Finally, the result is given to the output layer, thus displaying the final prediction.
Extreme Gradient Boosting (XGBoost) is a machine learning algorithm developed by Tianqi Chen that uses a boosting method, another type of ensemble learning method. While the boosting method uses a decision tree like a bagging method (e.g., random forest), it improves a single, weak iteration instead of combining multiple equally strong iterations to create an optimal prediction model. Like XGBoost, LightGBM (LGBM), developed by Microsoft, also uses a gradient-boosting technique to create the model, but it is known to produce models significantly faster than other boosting algorithms.
Due to these algorithms’ ‘black box’ nature, it is difficult to interpret the model and identify critical predictors as one would from a linear regression analysis. So instead, the study will assess each model's effectiveness by predicting seropositivity with the test dataset and formulating a confusion matrix, which includes the total number of true positives (TP), true negatives (TN), false positives (FP), and false negatives (FN). From the confusion matrix, three main metrics of model performance will be calculated: accuracy, precision, and recall. Accuracy depicts the proportion of correct predictions; precision measures the proportion of correct positive predictions, while recall measures the proportion of actual positives correctly identified.
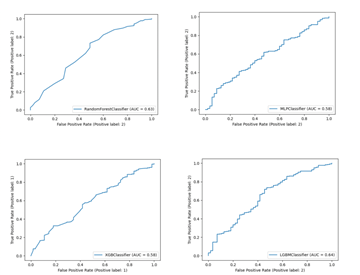
Lastly, the study generates a receiver operating characteristic (ROC) curve with a calculated area under the curve (AUC) to visualize and assess the models’ classification capacity. The study then compares the measures listed above among all models to select the best-performing model.
All analyses of RQ3 are performed in Python 3.8.5. Pandas and Numpy packages are used to handle data. The scikit-learn package is used for the random forest, neural network, confusion matrix, ROC curve, and hyperparameter tuning. Lightgbm and xgboost.sklearn packages are used to generate respective machine learning models. The Matplotlib package is used to generate ROC graphs, and the pickle package is used to save and load generated models for stable reference of the models.
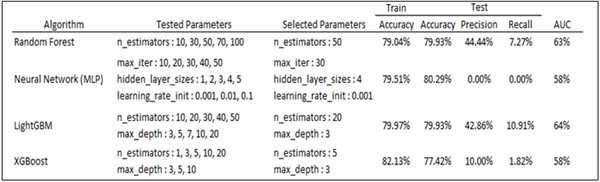
Since the previous random forest model was fit with complete data as its purpose was only to generate a variable importance plot and identify key contributing factors, a new random forest model was fit with the training dataset. Hyperparameter tuning was conducted with multiple levels of estimators. The resulting model identified the ideal number of estimators as 50. The training accuracy was 79.04%, and the test accuracy was 79.93%. The model’s precision and recall were 44% and 7%, respectively. The AUC from the ROC curve was 63% (Table 2).
The neural network model with multi-layer perceptron (MLP) was tuned with three sets of parameters: number of max iterations, hidden layer sizes, and initial learning rate. The selected set of parameters was 30 max iterations, 4 hidden layers, and a 0.001 initial learning rate. The tuned model yielded 79.51% train accuracy, 80.29% test accuracy, and 58% AUC. As the model predicted all cases as negative, its precision and recall were 0 (table 9). Precision and recall calculated how much true positive is correctly predicted. Since the neural network model predicted everything as negative, even originally positive ones, the values are 0.
Next, the LightGBM model was generated with two sets of parameters: the number of estimators, and max depth. The selected set of parameters was 20 estimators with 3 max depths. The model yielded 79.97% train accuracy, 79.93% test accuracy, and 64% AUC. The model’s precision and recall were 43% and 11%, respectively (Table 2).
Lastly, the Xgboost model was similarly tuned with LightGBM, with estimators and max depth as tuning parameters. The resulting model selected 5 estimators and 3 max depths, with 82.13% train accuracy, 77.42% test accuracy, and 58% AUC. The model’s precision and recall were 10% and 2%, respectively (Table 2).
Each model’s summary, ROC curve, and confusion matrix can be found below (Table 2, Figure 1 and 2). While all models had very similar accuracies, the neural network model had the highest accuracy of 80.29%. However, its precision and recall were 0, signifying that the model predicted all cases to have negative seropositivity. Its area under the ROC curve was also 58%, signifying underperformance. Out of the models, LightGBM was found to have the highest AUC and overall test metrics (accuracy, precision, and recall), and thus is selected to be the best-performing machine learning model.

For the research objective, a new random forest model was fitted using the training dataset. The previous random forest model was fitted with complete data (not just training data) to generate the variable importance plots and identify significant contributing factors. The resulting model determined that 50 was the ideal estimator number ideal. The accuracy of the training dataset was 79.04%, while the accuracy of the test was 79.93%. Precision and recall for the model were 44% and 7%, respectively, indicating limited ability to detect true positives. The ROC curve’s AUC was 63%. The tuned Neural Network model produced results of 58% AUC, 80.29% test accuracy, and 79.51% training dataset accuracy. The model’s accuracy and recall were zero since it anticipated that all cases would be negative. For the LightGBM model, 20 estimators with a maximum depth of three were the parameters that were chosen. The model produced 64% AUC, 79.97% training dataset accuracy, and 79.93% test accuracy. Precision and recall for the model were 43% and 11%, respectively. For the XGBoost model, 82.13% training dataset accuracy, 77.42% test accuracy, and 58% AUC were noted. Precision and recall for the model were 10% and 2%, respectively.
Based on the random forest model created, some interpretations of the performance are as follows: The difference between the training dataset and test accuracy is small, indicating that the model is not overfitting the training data. However, the precision and recall scores are low, which suggests that the model needs to perform better in correctly identifying positive samples. This could be due to imbalanced data or insufficient feature engineering. The AUC score of 63% indicates that the model’s ability to distinguish between positive and negative samples is slightly better than the random guess accuracy. However, there is much room for improvement.
Regarding the performance of the MLP model, the model’s training and test accuracy is reasonably high, indicating that it performs well on the training and test data. However, the AUC score of 58% indicates that the model’s ability to distinguish between positive and negative samples is similar to random guess accuracy. Furthermore, zero’s precision and recall scores suggest that the model cannot correctly identify positive samples. Therefore, the selected set of parameters may not be the best for the given dataset, and further hyperparameter tuning may be required.
The LightGBM model’s performance suggests that its training and test accuracy are reasonably high, indicating that it performs well on the training and test data. The AUC score of 64% indicates that the model’s ability to distinguish between positive and negative samples is better than random guess accuracy, but there is still room for improvement. The precision and recall scores are low, which also indicates room for improvement, though the recall score could be low due to imbalanced data or insufficient feature engineering. Additionally, the selected set of parameters may not be the best for the given dataset, and further hyperparameter tuning may be required.
The XGBoost model train accuracy is very high according to its insights. In contrast, the test accuracy is relatively lower, suggesting overfitting in the training data. The AUC score of 58% indicates a higher accuracy in the model’s ability to distinguish between positive and negative than that of random guess. However, the precision and recall scores are both low, indicating that the model needs improvement in identifying positive samples. The selected set of parameters may not be the best for the given dataset, and further hyperparameter tuning may be required. Some suggestions to improve these models and directions for future work are discussed in the sections below.
This study highlights the potential of applying machine learning algorithms to public health datasets like the NYC CHS to uncover hidden patterns and trends that may not be apparent. This approach can help public health professionals make more informed decisions in resource allocation, intervention development, and emergency preparedness. Predictive modeling can be beneficial in identifying vulnerable populations, potential outbreak locations, and effective interventions in case of public health emergencies. This study used predictive modeling to forecast the spread of infectious diseases, which can be further developed to determine the most effective interventions to control their spread. The implications of this work are far-reaching, as it can help public health professionals to better prepare for and respond to emergencies, ultimately improving public health outcomes.
Public health emergency preparedness efforts increasingly leverage emerging technologies such as artificial intelligence, machine learning, and blockchain to improve response efforts and enhance preparedness planning. As shown in this study, using machine learning algorithms with public health datasets can provide more accurate predictions and insights, which can inform emergency response planning and resource allocation. By integrating emerging technologies like machine learning into emergency preparedness efforts, public health professionals can improve their ability to detect, track, and respond to outbreaks, identify at-risk populations, and deploy support to prevent disease and disability, ultimately improving public health outcomes. Therefore, this study’s findings can aid in developing more effective emergency preparedness strategies incorporating emerging technologies.
This study uses large datasets and machine learning algorithms to identify patterns that may not be apparent through traditional data analysis methods. Thus aiding data-driven decision-making for health policies and interventions. This idea aligns with the importance of collaboration and coordination across agencies and sectors in emergency preparedness efforts.
Finally, the study recognizes the importance of addressing mental health needs in emergency preparedness planning and response by advocating for mental health support to survivors of disasters and pandemics; and training emergency responders to recognize and address mental health needs. Overall, this study contributes to multiple new developments and trends in emergency preparedness in public health by using innovative approaches and technologies to enhance response efforts and improve community resilience.
Public health and health education sectors can benefit greatly from data science skills at various levels and the communities they serve. In today’s job market, having strong data analytics skills can give individuals a competitive advantage. However, students sometimes need help competing with statistics or computer science majors with more training in handling large datasets. To ensure public health and health promotion students are prepared for entry-level jobs, they must develop complex data skills. This study can serve as an example for health education programs using AI and ML methodologies to analyze the datasets generated in the field.
This study faced the limitation of the self-reported nature of the NYC CHS. There are several limitations of a study that relies on participants’ self-reported survey responses. One is response bias, where participants may provide inaccurate or biased responses due to social desirability or responses that they think are socially acceptable rather than their actual beliefs or behaviors. Similarly, participants may provide responses they believe the researcher wants to hear. Recall bias is also prevalent, where participants may have difficulty recalling events accurately, especially those in the distant past. This may lead to inaccuracies. Misinterpretation of questions is another common problem. Participants may need to be clear in understanding the meaning of the survey questions, leading to accurate responses. This is especially true for complex questions requiring a certain level of knowledge or understanding. Often incomplete responses also pose a problem. Participants may only respond to some survey questions or skip specific questions, which can result in incomplete data. Finally, there is often limited generalizability as self-reported survey data may not represent the population. For example, participants who choose to respond to a survey may differ from those who do not respond, limiting the generalizability of the findings. While self-reported survey data can help explore specific research questions, knowing the limitations and potential biases associated with this data type is vital.
The study recognizes that the models used and suggested in research question are preliminary machine learning models that could be improved with a larger sample. The efficacy of machine learning in recognizing patterns is proportional to the size of the dataset. The smaller the dataset, the less powerful and inaccurate the machine learning algorithms are. The AUC for the ML models is very low in this study, which is an effect of the small sample size. The researcher intends to pursue this work with more extensive datasets from firms such as MarketScan data, Healthcare Cost and Utilization Project (HCUP) data, and Blue Cross Blue Shield (BCBS) association data.
The study also notes that machine learning algorithms may be biased if the data used to train the model does not represent the studied population. It is essential to address potential biases and ensure that models are designed and trained using representative data. This reason, as well as the sample size, could indicate a low AUC. There are also several reasons why the AUC may need to be higher, including the noise in the data that was received. If the model is not trained with enough data, it may not have learned the underlying patterns. The limitation of this study lies in the fact that the sample size was not big enough after the missing data cases were deleted.
In addition, the random forest and LightGBM models had noticeably higher AUC than the neural network model. Given that AUC provides a better insight into model performance and captures its ability to identify correctly, LightGBM is selected as the best-performing model.
To improve the performance of the ML models, future research could include conducting further engineering to identify more informative features and improve the quality of the input data by using extensive datasets. In addition, future studies could experiment with different hyperparameters and consider adding regularization techniques to reduce overfitting. Other machine learning models can also be tested. To improve the performance of the MLP model specifically, future studies could experiment with different sets of hyperparameters to find the combination that yields the best performance on the given dataset and use regularization techniques such as dropout or L2 regularization to reduce overfitting. To improve the performance of the XGBoost model, the issue of overfitting could be addressed by using techniques such as early stopping, regularization, or reducing the complexity of the model. The study may improve the model’s precision, recall, and AUC score by making these adjustments, resulting in a more effective and accurate model.
We would like to thank the Bureau of Epidemiology Services and DOHMH in NYC for getting access to the dataset.
| [1] | Bellandi D., “Estimate: 10.5 Million Children Lost a Parent, Caregiver to COVID-19,” JAMA, 328(15). 1490. 2022. | ||
| In article | View Article | ||
| [2] | Rady Children's Hospital. COVID collaborative for children [Internet]. San Diego. Rady Children's Hospital. [Cited 2023 March 17] Available from: https://www.rchsd.org/health-safety/health-alerts/covid-collaborative-for-children. | ||
| In article | |||
| [3] | ICN. ICN says 115,000 healthcare worker deaths from COVID-19 exposes collective failure of leaders to protect global workforce [Internet]. Place unknown; Oct 2021. [Cited 2023 March 17] Available from: https:// www.icn.ch/ news/icn-says-115000-healthcare-worker-deaths-covid-19-exposes-collective-failure-leaders-protect. | ||
| In article | |||
| [4] | Uphoff, E. P., Lombardo, C., Johnston, G., Weeks, L., Rodgers, M., Dawson, S., Seymour, C., Kousoulis, A. A., & Churchill, R. (2021). Mental health among healthcare workers and other vulnerable groups during the COVID-19 pandemic and other coronavirus outbreaks: A rapid systematic review. PLOS ONE, 16(8). | ||
| In article | View Article PubMed | ||
| [5] | Mottaleb, K.A., Mainuddin, M., and Sonobe, T., “Covid-19 induced economic loss and ensuring food security for vulnerable groups: Policy implications from Bangladesh,” PLOS ONE, 15(10), Oct. 2020. | ||
| In article | View Article PubMed | ||
| [6] | Koh, D., “Occupational risks for COVID-19 infection,” Occupational Medicine, 70(1), 3–5, January 2020. | ||
| In article | View Article PubMed | ||
| [7] | Couch, K.A., Fairlie, R.W., and Xu, H., “Early evidence of the impacts of COVID-19 on minority unemployment,” Journal of Public Economics, 192, 104287, 2020. | ||
| In article | View Article PubMed | ||
| [8] | Singu, S., Acharya, A., Challagundla, K., and Byrareddy, S.N., “Impact of social determinants of health on the emerging COVID-19 pandemic in the United States,” Frontiers in Public Health, 8.[Online] Available on: https:// www.frontiersin.org/ journals/ public-health/articles/10.3389/fpubh.2020.00406. | ||
| In article | View Article PubMed | ||
| [9] | Education Access and Quality. Education Access and Quality - Healthy People 2030. (n.d.). Retrieved November 29, 2022, from https://health.gov/healthypeople/objectives-and-data/browse-objectives/education-access-and-quality. | ||
| In article | |||
| [10] | Health IT. Health IT - Healthy People 2030. (2022). Retrieved December 4, 2022, from https:// health.gov/ healthypeople/ objectives-and-data/browse-objectives/health-it. | ||
| In article | |||
| [11] | Nelson, C., Lurie, N., Wasserman, J., & Zakowski, S. (2007). Conceptualizing and defining public health emergency preparedness. American Journal of Public Health, 97(Supplement_1). | ||
| In article | View Article PubMed | ||
| [12] | New York City Department of Health and Mental Hygiene (2020) Community Health Survey—Methodology. New York, NY: Department of Health and Mental Hygiene. | ||
| In article | |||
| [13] | Parrott, J. C., Maleki, A. N., Vassor, V. E., Osahan, S., Hsin, Y., Sanderson, M., Fernandez, S., Levanon Seligson, A., Hughes, S., Wu, J., DeVito, A. K., LaVoie, S. P., Rakeman, J. L., Gould, L. H., & Alroy, K. A. (2021). Prevalence of SARS-COV-2 antibodies in New York City adults, June–October 2020: A population-based survey. The Journal of Infectious Diseases, 224(2), 188–195. | ||
| In article | View Article PubMed | ||
Published with license by Science and Education Publishing, Copyright © 2025 Apeksha Mewani, Vincent Jones II and Alejandro Sanchez
![]() This work is licensed under a Creative Commons Attribution 4.0 International License. To view a copy of this license, visit
http://creativecommons.org/licenses/by/4.0/
This work is licensed under a Creative Commons Attribution 4.0 International License. To view a copy of this license, visit
http://creativecommons.org/licenses/by/4.0/
| [1] | Bellandi D., “Estimate: 10.5 Million Children Lost a Parent, Caregiver to COVID-19,” JAMA, 328(15). 1490. 2022. | ||
| In article | View Article | ||
| [2] | Rady Children's Hospital. COVID collaborative for children [Internet]. San Diego. Rady Children's Hospital. [Cited 2023 March 17] Available from: https://www.rchsd.org/health-safety/health-alerts/covid-collaborative-for-children. | ||
| In article | |||
| [3] | ICN. ICN says 115,000 healthcare worker deaths from COVID-19 exposes collective failure of leaders to protect global workforce [Internet]. Place unknown; Oct 2021. [Cited 2023 March 17] Available from: https:// www.icn.ch/ news/icn-says-115000-healthcare-worker-deaths-covid-19-exposes-collective-failure-leaders-protect. | ||
| In article | |||
| [4] | Uphoff, E. P., Lombardo, C., Johnston, G., Weeks, L., Rodgers, M., Dawson, S., Seymour, C., Kousoulis, A. A., & Churchill, R. (2021). Mental health among healthcare workers and other vulnerable groups during the COVID-19 pandemic and other coronavirus outbreaks: A rapid systematic review. PLOS ONE, 16(8). | ||
| In article | View Article PubMed | ||
| [5] | Mottaleb, K.A., Mainuddin, M., and Sonobe, T., “Covid-19 induced economic loss and ensuring food security for vulnerable groups: Policy implications from Bangladesh,” PLOS ONE, 15(10), Oct. 2020. | ||
| In article | View Article PubMed | ||
| [6] | Koh, D., “Occupational risks for COVID-19 infection,” Occupational Medicine, 70(1), 3–5, January 2020. | ||
| In article | View Article PubMed | ||
| [7] | Couch, K.A., Fairlie, R.W., and Xu, H., “Early evidence of the impacts of COVID-19 on minority unemployment,” Journal of Public Economics, 192, 104287, 2020. | ||
| In article | View Article PubMed | ||
| [8] | Singu, S., Acharya, A., Challagundla, K., and Byrareddy, S.N., “Impact of social determinants of health on the emerging COVID-19 pandemic in the United States,” Frontiers in Public Health, 8.[Online] Available on: https:// www.frontiersin.org/ journals/ public-health/articles/10.3389/fpubh.2020.00406. | ||
| In article | View Article PubMed | ||
| [9] | Education Access and Quality. Education Access and Quality - Healthy People 2030. (n.d.). Retrieved November 29, 2022, from https://health.gov/healthypeople/objectives-and-data/browse-objectives/education-access-and-quality. | ||
| In article | |||
| [10] | Health IT. Health IT - Healthy People 2030. (2022). Retrieved December 4, 2022, from https:// health.gov/ healthypeople/ objectives-and-data/browse-objectives/health-it. | ||
| In article | |||
| [11] | Nelson, C., Lurie, N., Wasserman, J., & Zakowski, S. (2007). Conceptualizing and defining public health emergency preparedness. American Journal of Public Health, 97(Supplement_1). | ||
| In article | View Article PubMed | ||
| [12] | New York City Department of Health and Mental Hygiene (2020) Community Health Survey—Methodology. New York, NY: Department of Health and Mental Hygiene. | ||
| In article | |||
| [13] | Parrott, J. C., Maleki, A. N., Vassor, V. E., Osahan, S., Hsin, Y., Sanderson, M., Fernandez, S., Levanon Seligson, A., Hughes, S., Wu, J., DeVito, A. K., LaVoie, S. P., Rakeman, J. L., Gould, L. H., & Alroy, K. A. (2021). Prevalence of SARS-COV-2 antibodies in New York City adults, June–October 2020: A population-based survey. The Journal of Infectious Diseases, 224(2), 188–195. | ||
| In article | View Article PubMed | ||


