The Sassandra river, which flows in the western part of Côte d'Ivoire, is one of the most affected by hydropower developments, with three dams constructed along its course. The objective of the study was to evaluate the physical health of the Sassandra River prior to and following the construction of the Buyo and Soubré hydroelectric dams. To achieve this, satellite images from four years were selected: 1990, 2005, 2015, and 2025. Using these images and field data, mapping and remote-sensing tools were employed to determine several river–environment parameters, including riparian vegetation, width, sinuosity, width–depth ratio, slope, and the confinement index, among others. The vegetation on the east bank decreased from 72% in 1990 to 60% in 2025, with a slight recovery after 2005, while the vegetation on the west bank increased from 64% to 79%, at the expense of bare soil and cultivated areas. In terms of morphodynamics, the balance between erosion and accretion varied along the river: there was substantial accumulation upstream of the Buyo Dam, while the intermediate zone experienced increased erosion since 2005. The river’s morphology, particularly its meandering character (SI = 2 upstream; 1.4 in the highly sinuous zone; 1.15 downstream), shows an evolution influenced by the dams, with a decrease in sinuosity during the construction of the Soubré Dam, followed by recovery in 2025. The confinement index (> 1.5) and the width/depth ratio (< 12) suggest relative stability of the channel, modulated by river dynamics.
Dams meet human needs, ensuring food security and the availability of water worldwide. They are used to store water for irrigation, recreation, and navigation, to manage aquatic resources, and to generate energy 1. Hydroelectric dams produce the principal source of renewable energy in the world, accounting for up to 71% of supply in 2016 2. They help reduce dependence on fossil fuels and lower greenhouse gas emissions 3. The commercialisation of this energy permits profits that are used to fund other essential infrastructure for human well-being 1.
Despite their important role in river regulation, dams markedly perturb the natural patterns of river flow. Dams modify the regime of flow and sedimentation 4, thereby altering geomorphological processes that involve spectacular adjustments of the downstream channel. Changes in grain size of sediments are also associated with changes in river bedforms 5. Arroyo 6 warned that the enlargement of the Rio Grande bed downstream of the Elephant Butte storage and diversion project endangered the fertile lowlands. Later, Stanley 7 reported substantial aggradation along the Colorado River downstream of Parker and Hoover Dams, and Malhotra 8 recorded rapid channel incision and sandy-bed aggradation downstream of dams in the Indus system. Indeed, river dynamics rest on a complex interaction between multiple physical processes. The hydrological regime, characterised by seasonal variations in discharge, directly influences the transport capacity and energy of the river. These fluctuations determine the intensity of erosion and sedimentation processes 9.
Dams are undoubtedly among the principal engines of change in river systems 10. They modify aquatic and riparian ecology by altering downstream hydrology in terms of quality, quantity, and timing of flows 11. Hydroelectric dams disrupt aquatic ecosystems by altering the spatio-temporal dynamics of fish communities through obstruction of migratory routes and by modifying sediment transport and water quality.
The Sassandra River, one of the largest rivers in Côte d’Ivoire, is by no means exempt from this reality. Hydroelectric development of the Sassandra basin began in the early 1970s with the construction of the Buyo reservoir dam for energy purposes, commissioned in 1980. To increase the energy potential of Côte d’Ivoire, the Soubré dam, with an installed capacity of 275 MW and a maximum head of 43 metres, was built downstream of the first and commissioned in 2017 12. Today, a third dam is under construction, Gribo-Popoli, about 15 km downstream of the Soubré dam. It has a capacity of 112 MW, built on an area of 700 hectares with a maximum height of 18 metres and 700 m³.s⁻¹, and the structure is equipped with three power-generation units 13. Consequently, the Sassandra River experiences a clear degree of anthropisation likely to perturb and alter the river’s morphology. As a result, there may be:
• over-dimensioning of the river bed, leading to a lowering of water height and, in some cases, increased water temperature, thus worsening eutrophication phenomena;
• a reduction in river length, triggering a cascade of phenomena (steepening of the slope and thus increased flow velocities);
• bank erosion and incision of the bed;
• degradation of benthic habitats, etc. 14.
Precise knowledge of these hydromorphological dysfunctions and their origins will enable the implementation of comprehensive, coherent, and sustainable restoration actions. The objective of this study is to characterise the hydromorphological modifications of the Sassandra River using satellite imagery before and after the construction of the Buyo and Soubré dams. This requires an examination of the dynamics of riparian vegetation and morphological parameters upstream and downstream of the dams.
The Sassandra River is a watercourse whose catchment is one of the four major basins of Côte d’Ivoire. It lies between 6°0′ and 9°50′ N and 6°0′ and 8°20′ W, with a surface area of 54,670 km². The Sassandra River takes its source in the Beyla region of Guinea, under the name Feroudougouba. It is 442 km long and receives two significant right-bank tributaries: the Bafing (280 km) and the N’Zo (255 km). On the left bank it subsequently receives the Lobo, which is the last tributary before the locality of Soubré when traced from upstream to downstream (amont–aval) 15.
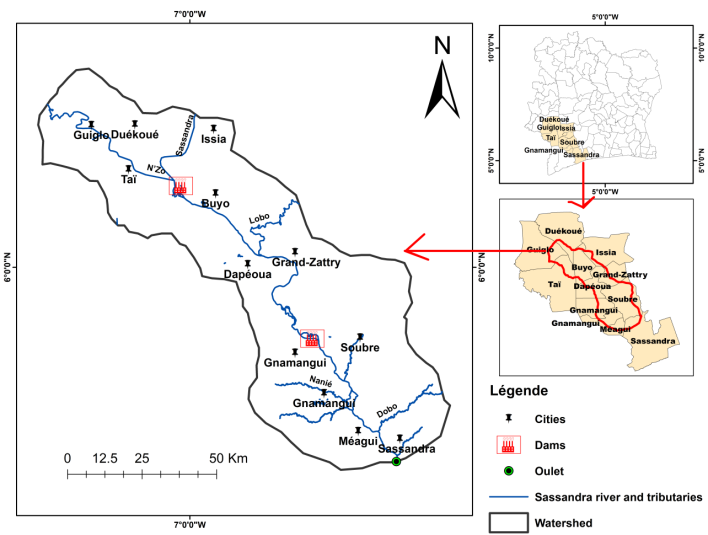
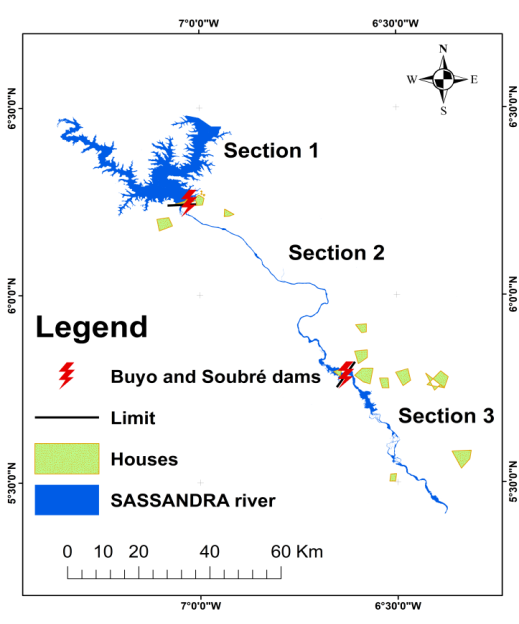
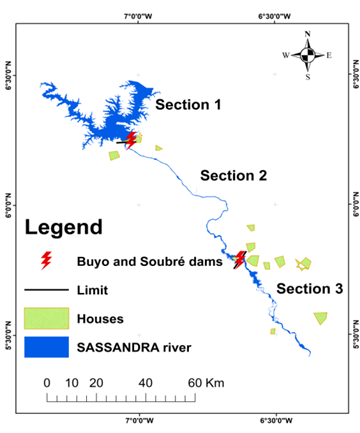
The relief of the study area is only weakly contrasted. It is characterised by a monotony of plains and plateaus with elevations ranging from 37 to 200 m 16. The section of the Sassandra River that is the subject of this study (see Figure 1) lies between the Sassandra and Guiglo departments, at longitudes 6°8′55″ to 7°24′00″ W and latitudes 5°23′10″ to 6°35′15″ N. This section is marked by the construction of the hydroelectric dams at Buyo and Soubré on the main course of the river. The Buyo Dam is situated upstream of the Soubré Dam. The length of the river segment connecting the two dams is 88 km (Figure 1). The Buyo Dam has a minimum crest level of 186 m and a maximum crest level of 200 m. Discharge during flood events occurs between 10 and 14 days. The design flood discharge is 5000 m³/s with a spill discharge of 151 m³/s. The dam contains five spill gates for flood discharge. Each gate releases 800 m³/s of water.
The Soubré Dam is river-seated (i.e., its crest tracks the river level). Its flood regime is dependent on Buyo’s. The operational minimum crest level is 151.6 m and the maximum high-water crest level is 153.4 m. The reservoir area is 17 km². The project flood for the Soubré dam is 5500 m³/s, with a reserved discharge of 50 m³/s 13.
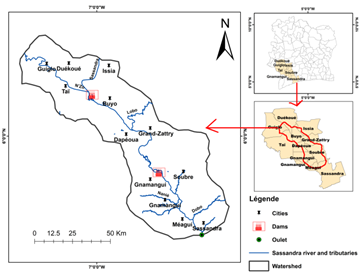
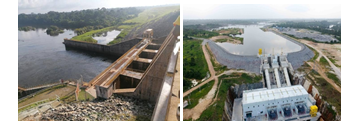
Remote-sensing imagery from LANDSAT, SENTINEL, and Digital Elevation Model (DEM) data were used to evaluate the morphometric parameters of the river and the land use/land cover of the watershed. The images cover a segment of the Sassandra River beginning 46 km upstream from the Buyo Dam and terminating 164.14 km downstream from the Soubré Dam. Four dates (1995, 2005, 2015, and 2025), with a 10-year interval, were deliberately chosen to monitor the geomorphological change dynamics of the river before and after the construction of the two dams. Data consist of 10 images from the MSI-L2A, MSI-L1C, OLI, ETM, and TM sensors. For Landsat 5 TM, two images were acquired for the year 1995. Four images were used for the OLI and ETM sensors, with two images per sensor for the years 2005, 2015, and 2025 respectively. The SENTINEL-2 MSI-L2A and MSI-L1C sensors provided four images for the year 2025. The acquisition period for the imagery was chosen between November and February, corresponding to the dry season to avoid cloud cover and to exclude flood periods. Morphogenetic water releases occur from September to November. The data were downloaded from the USGS EarthExplorer site (for LANDSAT images and DEM), and from the Copernicus Open Access Hub (for SENTINEL-2 images). On the ground, a GARMIN GPS device was used to geolocate the coordinates of land-use classes to be validated and the sediment sampling sites. Fieldwork also provided ground-truth photographs documenting the current morphologic state of the Sassandra River and certain land-use units, each associated with geographic coordinates.
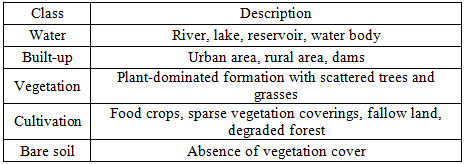
2.3. MethodsTo evaluate the type and percentage of vegetation along the river, a buffer zone was selected along the watercourse from the satellite images. A land-use/land-cover (LULC) map was produced for the chosen buffer. Land use/cover classification was performed with QGIS equipped with the Semi-Automatic Classification Plugin (SCP) 17. The supervised classification is based on five land-use/land-cover classes: water, built-up areas, vegetation, crops, and bare soil (Table 1). It is important to note that the quality of thematic maps derived from remote-sensing data can be evaluated and expressed in a meaningful way. A classification error represents, therefore, a certain mismatch between the class depicted on the thematic map and the ground truth. Conventional methods for assessing the thematic accuracy of a map are the confusion matrix and the Kappa statistic 18. The Kappa quality index assesses, within the confusion matrix, the agreement between the results obtained and the ground truth. It ranges from 0 to 1 and is commonly interpreted using five categories. The closer to 1, the agreement is nearly perfect 19.
The supervised classification involved representing the 64 updated training classes on the band composite that comprises the image files. Subsequently, the Maximum Likelihood algorithm grouped the spectral signatures according to the validated training file. Consequently, the output image from the algorithm consisted of the predefined five land-cover classes as specified in the training file. The processing steps were:
• Band_set creation (Band_set: creation of the composite image),
• Creation of training plots (training),
• Classification by the Maximum Likelihood method,
• Formatting and exporting the file.
Extraction of water bodies
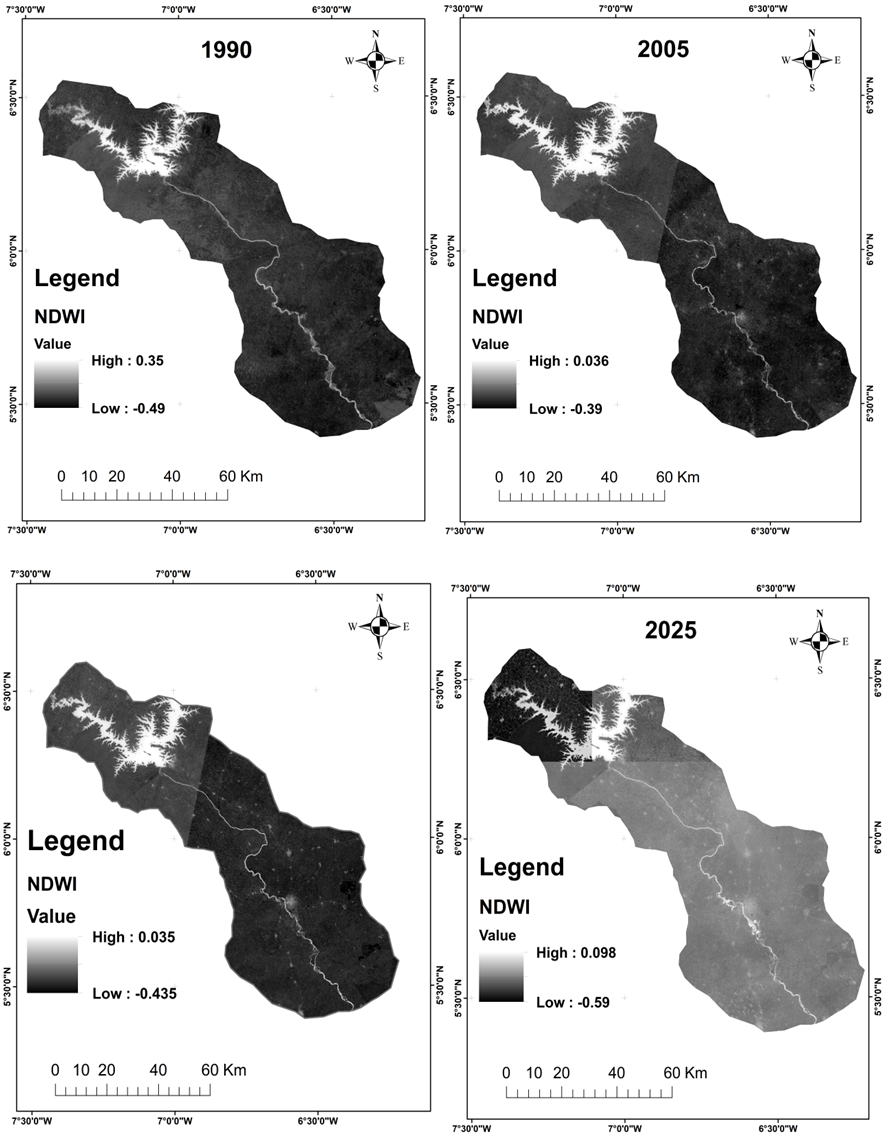
The Normalised Difference Water Index (NDWI) is a band-ratio method computed from various band combinations (green, near infrared, middle infrared, and short-wave infrared). The NDWI is employed to generate differences in spectral signatures between water and land features by analyzing the spectral responses of each spatial object across different band combinations, thereby discriminating land from water surfaces 20.
 | (1) |
GREEN and NIR denote, respectively, the green and near-infrared bands..
For water body detection, which is one of the primary applications of NDWI 21:
• values > 0.3 usually indicate clear, open water bodies;
• values between 0 and 0.3 may represent shallow water, wetlands, or areas with high soil moisture;
• values < 0: Typically represent non-water features.
The selection of river reaches studied was based on the influence of reservoirs on the river channel. Thus, the first reach was chosen upstream of the Buyo Dam (section 1), characterized by the absence of dam-induced impacts on this portion of the river. Subsequently, a reach was selected between the Buyo and Soubré Dams (section 2), characterized by the effects of both dams on the river. A third reach was selected downstream of the Soubré Dam (section 3), characterised solely by the effects of the Soubré Dam on the river (Figure 3).
The NDWI image, extracted at multiple dates, and the ARCGIS Fluvial Corridor tool facilitated the calculation of several river parameters, including channel width, width of the floodplain, slope, contact length (ecotone), index, and degree of confinement. The sinuosity and braid index were determined using the RiverGis tool in QGIS. Other parameters calculated include the erosion/accumulation area (m² or m² per year), the discharge power of the River (P), and the width–depth ratio (W/D).
Channel width and floodplain width
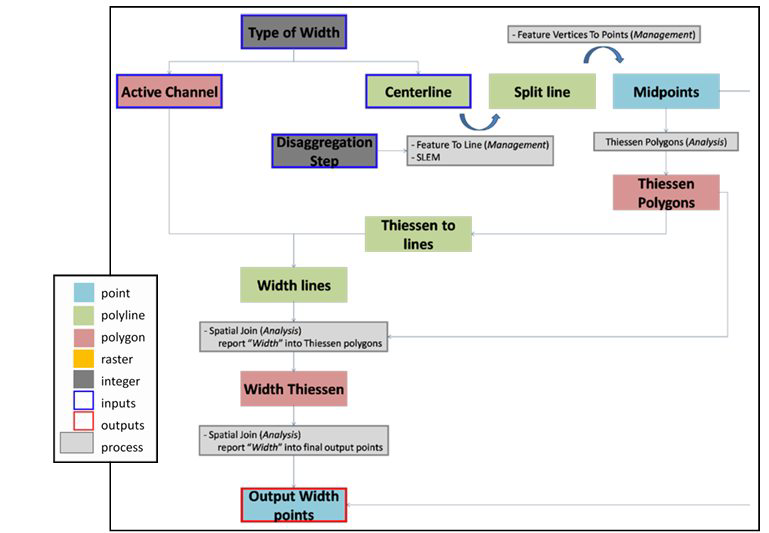
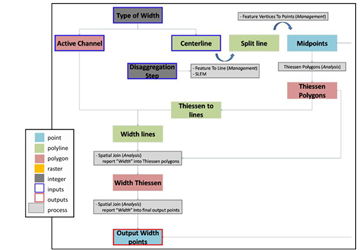
The river widths by reach were calculated as follows (Figure 4). First, the river thalweg was digitised by reach. Then the river was segmented at 100 m intervals. These segments were converted into location points along the thalweg. From these points, Thiessen polygons were created. Each polygon is formed around a point by the perpendicular bisectors to the lines joining neighboring points. Finally, the two vector layers (valley floor and channel) were clipped according to the geometry of the Thiessen polygons.
Confinement and sinuosity indexes
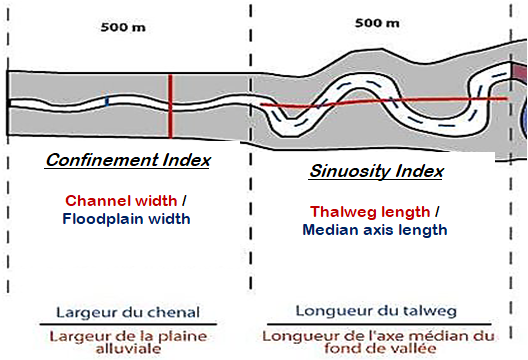
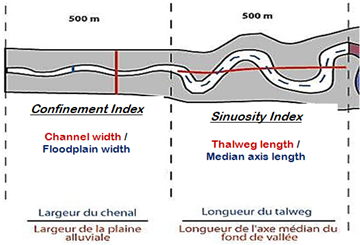
Figure 6 shows the parameters involved in the calculation of these two indices 22.
The confinement index (channel width / floodplain width), which provides indications of the potential lateral migration of the channel 23.
According to 24, the degree of valley confinement is the principal control factor differentiating geomorphological processes along a river course (Figure 5). The sinuosity index, as defined by 25 (thalweg length/median axis length of the valley floor), was derived to demonstrate the effects of dams and bridges on channel morphology.
Ecotone and braiding index
Contact length refers to the transitional boundary shared by two different ecosystems. In fluvial geomorphology, this is termed an ecotone and may correspond to the interface between water and vegetation, depositional bars and water, or vegetation and depositional bars. Several authors have highlighted the ecological importance of these zones, particularly regarding the environmental quality of river corridors.
The braiding index is defined as the average number of active channels per cross-section 26. A braided river exhibits a rare and distinctive fluvial style, supporting specific aquatic and terrestrial life, and conferring uniqueness and attractiveness to the landscapes it traverses. Morphological parameters, particularly channel width and planform geometry (sinuosity), are highly sensitive to changes in hydrological and sedimentary conditions 27. They therefore represent reliable indicators of alterations within the fluvial system.
Erosion and accretion
The eroded or deposited land areas are calculated by subtracting the extents of the active channels previously extracted from satellite images acquired at two different dates. For instance, consider the active channels delineated from the 1990 and 2005 images, denoted as Mriverbed1990 and Mriverbed2005, respectively. If the subtraction (ΔS) yields a positive value, accretion occurred between the two dates (1990–2005). Conversely, a negative value indicates erosion. The affected area corresponds to the absolute value |ΔS|.
 | (2) |
Width/Depth Ratio (W/D)
The width/depth ratio (W/D) is defined as the ratio between the bankfull surface width and the mean bankfull channel depth. The W/D ratio is fundamental for understanding the distribution of available energy within a channel and the ability of various discharges occurring in the channel to transport sediments. Among the Level II criteria, the W/D ratio is the most sensitive and responsive indicator of channel instability trends 28. Determining this ratio provides a rapid visual assessment of channel stability. As the W/D value increases (i.e. the channel becomes wider and shallower), hydraulic stress against the banks also increases, thereby accelerating bank erosion. This accelerated erosion process generally results from high velocity gradients and strong boundary stresses, since mean velocity, stream power, and shear stress tend to decrease as W/D values increase. The W/D ratio also provides insights into bank cohesion: the more cohesive the banks, the narrower and deeper the channels. Conversely, when banks are weakly cohesive, channels tend to be wider and shallower.
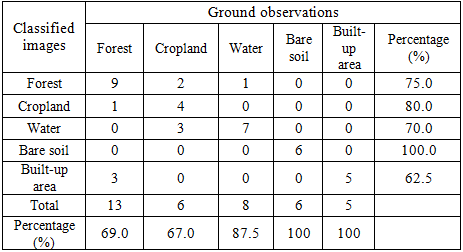
Only the results of the reliability analysis for the 1990 land cover map are presented in Table 2. The overall accuracy for 1990 is 75.6%, with a Kappa coefficient of 0.69 (Table 2). A good classification of the different land cover units is observed for 1990. Similar results were obtained for the 2015 and 2025 classifications, with overall accuracies of 78% and 70.73% and corresponding Kappa coefficients of 0.71 and 0.73, respectively. Classification accuracy was relatively lower for 2005 compared with the other years. The confusion matrix indicates an overall accuracy of 73.17% and a Kappa coefficient of 0.67.
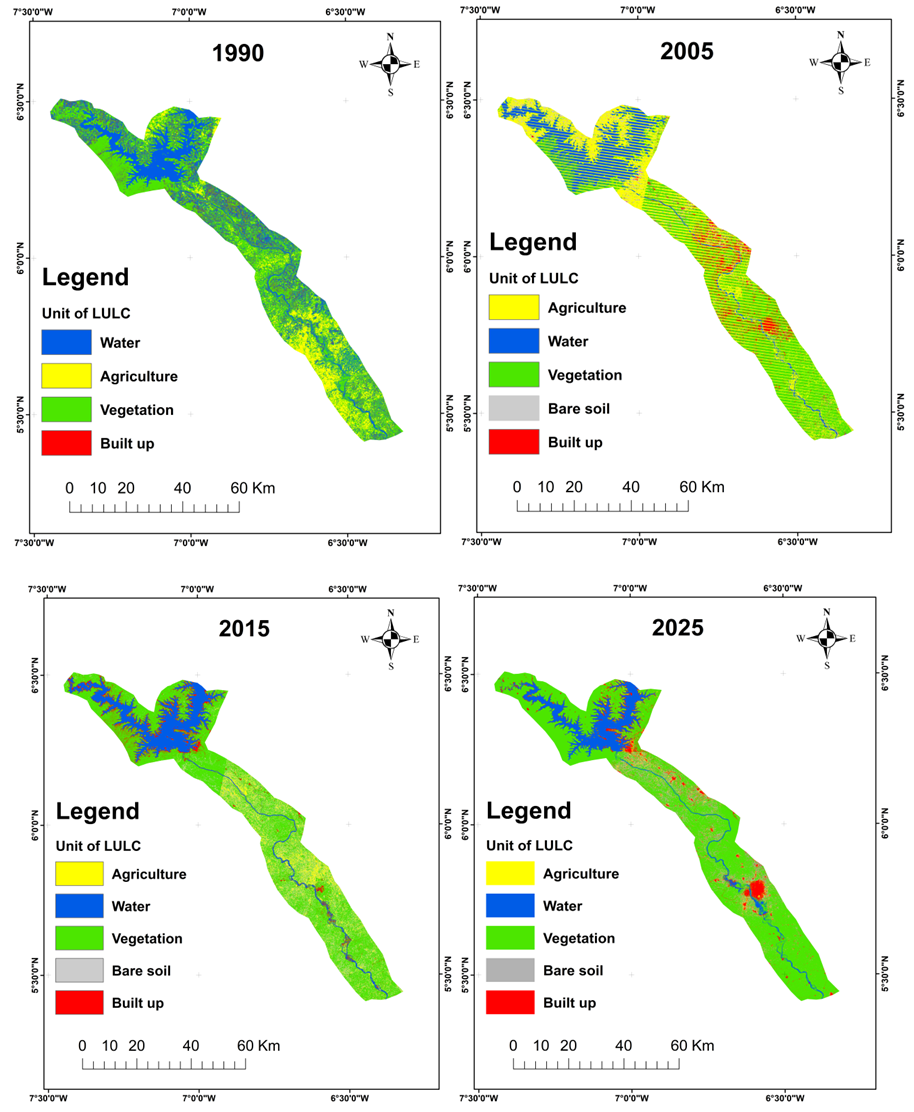
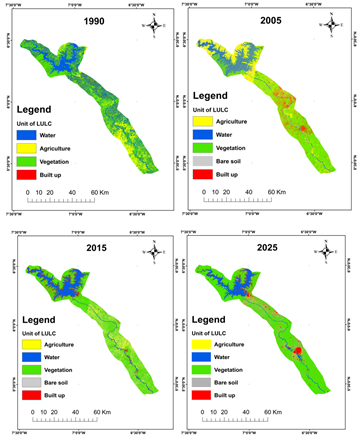
The land cover dynamics of the selected buffer zone (Figure 6) reveal an expansion of cropland along the riverbanks between 1990 and 2015 (Figure 6), followed by a decline between 2015 and 2025 (Figure 6c and Figure 6d). This reduction is characterised by the regeneration of vegetation along the banks. It should be noted that the 2005 map shows a proliferation of built-up areas between the two dams. This trend diminished in 2015, with a recovery of riparian vegetation. However, on the 2025 map, built-up areas are once again expanding at the expense of vegetation.
In terms of area, riparian vegetation on Bank 1 (eastern side) declined from 72% in 1990 to 60% in 2025, in favour of bare soil, built-up areas, and cropland. A slight recovery of vegetation was observed after 2005. In contrast, Bank 2 (western side) shows a general increasing trend in riparian forest cover, rising from 64% to 79% at the expense of built-up areas, bare soil, and cropland, which together account for a cumulative 21%. However, the year 2005 remains exceptional, with a decline in vegetation observed on both banks.
Overall, the eastern bank has been more strongly affected by anthropogenic pressures—particularly the river reach located between the two dykes—resulting in a regression of riparian vegetation. Conversely, the western bank has experienced an expansion of vegetation cover, as this section of land bordering the river has been relatively spared from human activities.
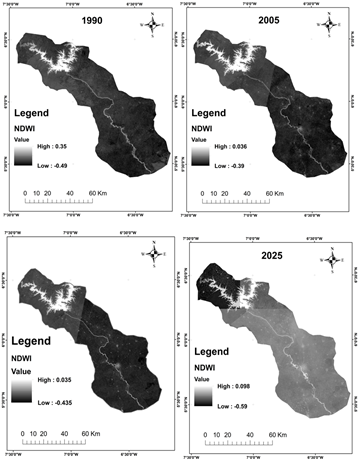
3.2. Morphological Dynamics of the Sassandra RiverThe delineation of the wetland area, represented by pixels with NDWI values between 0 and 0.3, constitutes the first step in the morphological analysis of the Sassandra River (Figure 7). The Sassandra River is thus identifiable by its narrow, curvilinear course (minor channel) appearing in white, with index values above 0.3, in accordance with the literature (Figure 7). These maps also highlight the large water body formed in the Buyo Dam reservoir due to the dam. The intermediate and major channels, extending along both banks and less conspicuous, are also emphasised through pixels with shades ranging from white to grey (NDVI between 0 and 0.3), scattered among darker grey to black pixels that generally correspond to non-aquatic land cover units.
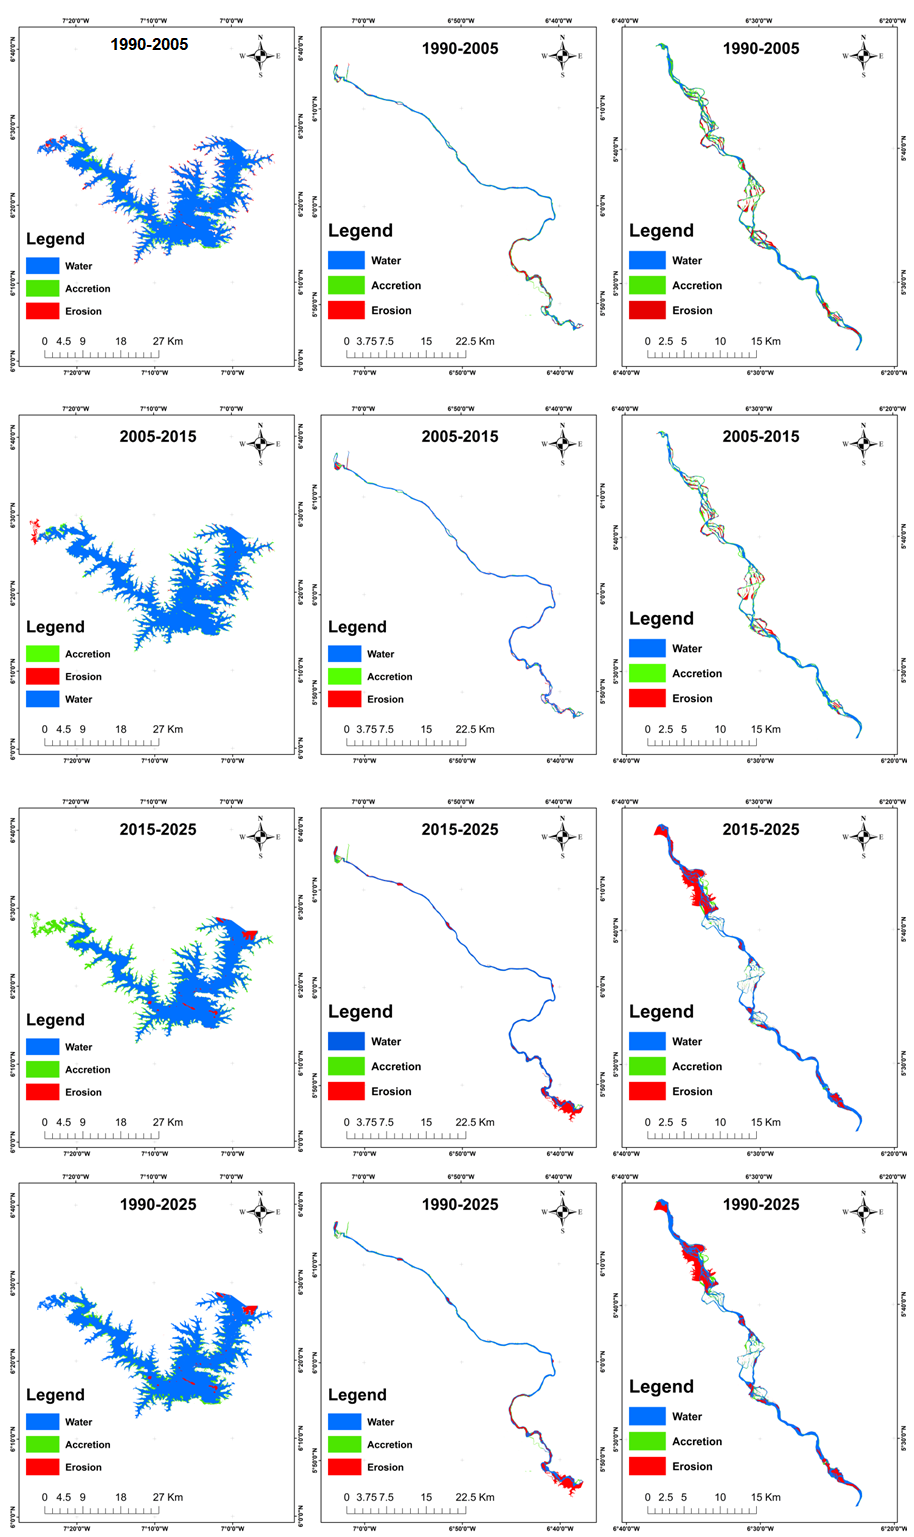
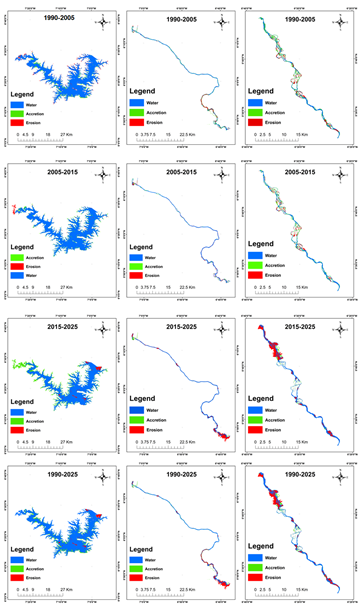
Bank dynamics reflect the lateral movement of the riverbanks. Figure 8 illustrates the erosion and accretion dynamics of the different sections from 1990 to 2025. Section 1, upstream of the Buyo Dam, exhibits significant accretion (shown in green) during the periods 1990–2005, 2005–2015, and 2015–2025.
In Section 2, the 1990–2005 period is characterised by strong accretion. From 2005 to 2025, the area of erosion, indicated in red, expanded. Overall, for the 1990–2025 period, the erosion rate is high.
In Section 3, high accretion rates were observed during 1990–2005 and 2005–2015. However, from 2015 to 2025, erosion increased while accretion decreased. Depositional zones (accretion) are predominantly located in the concave portions of the Sassandra River channel meanders, whereas erosion mainly occurs along the convex portions.
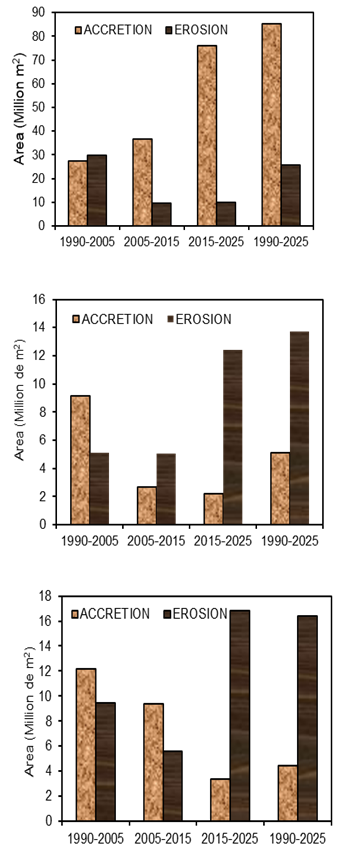
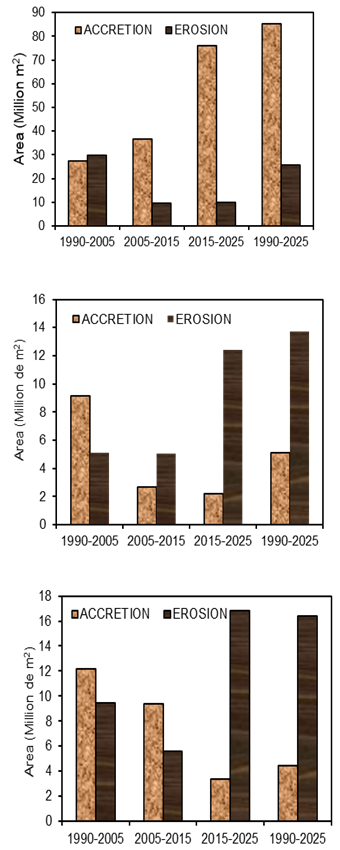
Figure 9 illustrates the evolution of accretion and erosion areas of the Sassandra River from 1990 to 2025. Section 1 of the study (upstream of the Buyo Dam) is dominated by sediment deposition throughout the study period. Only the 1990–2005 period is conducive to erosion. The sedimented area is approximately 80 million m², compared with around 20 million m² of eroded area.
The section between the two dams is dominated by erosion, with eroded areas increasing from 5 million m² between 1990 and 2005 to about 13 million m² between 2015 and 2025. Section 3 (downstream of the Soubré Dam) is also characterised by erosion, with an eroded area of approximately 17 million m² over the study period. The year 2005 appears as a turning point for Sections 1 and 2, marking the onset of accretion in Section 1 and the onset of erosion in Section 2. From 2015 onwards, the balance shifts in favour of erosion in Section 3.
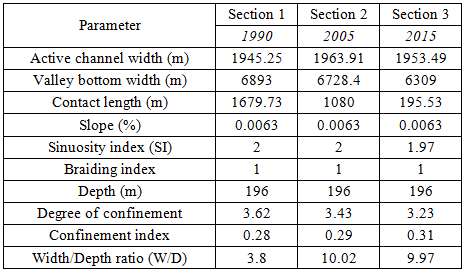
Section 1 of the river exhibits a mean sinuosity index (SI) above 2 throughout the study period, indicating a meandering channel. Section 2 has a mean SI of 1.4, reflecting a highly sinuous channel, while Section 3 has a mean SI of 1.15, indicating a moderately sinuous channel (Table 3). As a reminder, the higher the sinuosity index, the more sinuous the river. An SI of 1 indicates a perfectly straight channel, whereas values above 1 indicate increasing sinuosity.
For Section 3, the SI was 1.17 in 1990 and 2005, decreased to 1.14 in 2015 during the construction of the Soubré Dam, and increased again to 1.17 in 2025, reflecting geomorphological changes influenced by both the dam and natural processes. Section 2 recorded an SI of 1.38 in 1990, increasing slightly to 1.40 in 2005 and 2015, before returning to 1.38 in 2025.
The width/depth ratio (W/D) for all sections remains below 12. Values above this threshold are associated with accelerated erosion and low bank cohesion. The Sassandra River is therefore significantly deeper relative to its width, resulting in lower hydraulic stress on the banks and reduced accelerated bank erosion.
Overall, across the studied sections, the river widened between 1990 and 2025 (Table 3). In Section 1, upstream of the Buyo Dam, the river width increased from 1,945 m in 1990 to 2,000 m in 2025, representing an expansion of 55 m. Downstream of the Buyo Dam, prior to the construction of the Soubré Dam, the channel narrowed by 29 m between 1990 and 2005. From 2005 to 2025, continuous channel widening occurred, from 228 m to 337 m, likely linked to the construction of the Soubré Dam.
In Section 3, downstream of the Soubré Dam, the river width decreased from 405 m in 1990 to 317 m in 2005, representing a narrowing rate of 21.95%. This was followed by a continuous increase from 2015 to 2025.
Channel slope increases from upstream to downstream, ranging from 0.0063% to 0.1%. The reach upstream of the Buyo Dam is characterised by a gentle bed slope, whereas the bed is more irregular in Section 3 compared with the first two sections. It should be noted that slopes in the different sections changed very little over the study period (Table 3).
The degree of valley confinement is a key factor controlling geomorphological processes along the river. The river exhibits a degree of confinement greater than 1.5 and a confinement index between 20% and 80%, indicating that the river is partially confined (Table 3).
The results of the land cover map analysis indicate an overall increase in riparian vegetation and soils along the Sassandra River from 1990 to 2025. This growth is accompanied by a decline in built-up areas and cropland. The year 2005 is notable, representing a turning point, with a decrease before and a recovery of vegetation afterwards. This pattern is likely linked to population relocation processes associated with the commissioning of the Soubré Dam. Villages situated near the river, within the project area, were relocated, and following reservoir filling, some populations returned to their original locations, impacting the landscape. This alternation between vegetation and settlement can be explained by the link between land cover dynamics and driving forces in the landscape 29. The expansion of riparian vegetation along the river coincides with lateral expansion of the riparian zone. Aguiar et al. 30 suggest that increases in parcel size and area along the banks result from the abandonment of agricultural lands and settlements.
Rivers are dynamic systems that adjust both horizontally and vertically to changes in sediment load and discharge 31. Dragićević et al. 32 note that monitoring channel migration, erosion, and deposition is economically more advantageous than repairing damage and loss of resources. In Section 1, upstream of the Buyo Dam, accretion rates are high. Between 2005 and 2025, accreted area increased substantially from 36.5 million m² to 76.5 million m², likely due to the dam reservoir acting as an artificial barrier to sediment transport. Flow deceleration upstream of the dam promotes sediment accumulation. However, erosion of approximately 29,697,846 m² occurred between 1990 and 2005.
Downstream of the Buyo Dam, in Section 2, accretion exceeded erosion between 1990 and 2005, with 9,161,648 m² of accreted area. From 2005 to 2025, eroded area increased from 5,069,728 m² to 12,414,589 m², indicating that erosion intensified after the construction of the Soubré Dam. In Section 3, from 1990 to 2015, accretion was greater than erosion, though it decreased from 12,179,867 m² to 9,360,675 m² during this period. After the construction of the Soubré Dam, the area increased to 16,378,699 m². According to Lane’s balance (1955), rivers seek equilibrium between imposed sediment load (Qs) and water discharge (Ql), with slope providing the energy to transport sediments. In simplified terms, fluvial dynamics can be seen as a balance oscillation, with one pan representing coarse sediments (Qs) and the other water (Q), with constant fluctuations leading to continuous morphological adjustment through erosion-accretion processes. Human interference directly affects river morphology. Islam et al. 33 show that bridge construction accelerates erosion and deposition by altering flow direction and causing bank erosion. Increases in water discharge can shift the system toward bed and bank erosion.
River width is a critical factor for riparian communities. In Section 1, river width increased by 2.82% from 1990 to 2010, indicating minimal dam influence. In Section 2, width decreased by 11.22% from 1990 to 2005, increased by 9.9% from 2005 to 2015, and expanded sharply by 34.12% from 2015 to 2025, after the Soubré Dam construction. In Section 3, a similar trend occurred, with initial narrowing followed by widening, reflecting river morphological evolution. These results confirm that dam construction impacts river width, consistent with findings by 33 for the Padma River in northwest, 34 for the braided Brahmaputra.
Sinuosity downstream of the dams shows decreasing and increasing trends, from 1.4 to 1.38 downstream of Buyo, and from 1.14 to 1.17 downstream of Soubré, indicating a sinuous channel influenced by erosion and accretion processes, in line with 35 on bank erosion vulnerability. Channel slope increases downstream, enhancing erosion by increasing water velocity. Increasing channel width raises the width/depth ratio 36. The river is partially confined, demonstrating dam effects on channel morphology. Overall, these findings highlight the influence of dams on river width and morphology, underscoring the need for careful planning and management, as riparian communities dependent on the river may face hazards due to channel widening.
Hydropower dams play a significant role in renewable energy production. However, they also influence flow regulation and can negatively impact the physical integrity of river systems. This study analysed the probable impacts of the Buyo and Soubré dams on the geomorphology of the Sassandra River. Satellite imagery, after processing, allowed the monitoring of land cover changes along the riverbanks. Bank 1 (right bank, primarily urbanised) saw vegetation decrease from 72% in 1990 to 60% in 2025, with a slight recovery after 2005. Degradation associated with urbanisation and agriculture was most pronounced between 1990 and 2005. Bank 2 (left bank) experienced a notable increase in riparian vegetation, from 64% to 79%, at the expense of bare soil, built-up areas, and cropland. The year 2005 appears as a turning point, with a temporary vegetation decline, likely linked to the dam’s construction and human activity in the area. From a morphodynamic perspective, the erosion–accretion balance varies across sections. Upstream (Section 1) exhibits strong sediment accumulation, particularly upstream of the Buyo Dam. Section 2 shows increased erosion from 2005 onwards, reflecting an oscillating dynamic influenced by human activities and dam construction. The river in Section 1 is meandering with high sinuosity, promoting deposition in concave bends and erosion along convex banks. The width-to-depth ratio (<12) suggests the channel is moderately resistant to accelerated erosion, while the partially confined valley moderates lateral deformation processes. Depositional zones are concentrated in concave meander sections, primarily in Section 1, which experienced significant accretion throughout the study period. Section 2 experienced increasing erosion between 2005 and 2025, reducing accumulation. In Section 3, initially characterised by strong accretion (1990–2015), erosion increased after 2015, reducing sedimentation. Sinuosity varies among sections, with SI = 2 upstream (meandering), 1.4 in the highly sinuous middle section, and 1.15 downstream, indicating geomorphological changes sensitive to dam construction and natural processes. Notably, during Soubré Dam construction (2015), sinuosity decreased but partially recovered to 1.17 by 2025, reflecting river morphological adaptation. Based on these results, it is recommended to implement long-term geomorphological monitoring, to limit urban and agricultural pressure on the banks and raise awareness among local stakeholders and managers regarding the importance of preserving the river system and its ecological and socio-economic functions.
My thanks go to Moïse for his support with the various remote sensing treatments. I would like to thank my colleagues François and Moussa for reading and revising the manuscript.
The author declares no conflicts of interest regarding the publication of this paper.
| [1] | I. Yuksel, “Barrages et hydroélectricité pour un développement durable,” Sources d’énergie Politique 4 du Plan économique, vol. 4, p. : 100-110. | ||
| In article | |||
| [2] | E. F. Moran, M. C. Lopez, N. Moore, N. Müller, and D. W. Hyndman, “Sustainable hydropower in the 21st century,” Proc. Natl. Acad. Sci. U.S.A., vol. 115, no. 47, pp. 11891–11898, Nov. 2018. | ||
| In article | View Article PubMed | ||
| [3] | H. Merritt and A. Barragán-Ocaña, “The impact of market factors on the development of eco-friendly energy technologies: the case of bioethanol,” Clean Techn Environ Policy, vol. 25, no. 2, pp. 313–321, 2021. | ||
| In article | View Article PubMed | ||
| [4] | B. Li, Z. Liang, Z. Bao, J. Wang, and Y. Hu, “Changes in streamflow and sediment for a planned large reservoir in the middle Yellow River,” Land Degrad Dev, vol. 30, no. 7, pp. 878–893, Apr. 2019. | ||
| In article | View Article | ||
| [5] | S. A. Brandt, “Classification of geomorphological effects downstream of dams,” CATENA, vol. 40, no. 4, pp. 375–401, Aug. 2000. | ||
| In article | View Article | ||
| [6] | S. Arroyo, “Channel improvement of the Rio Grande below El Paso,” Mexican Federal Civil Engineer, 1925. | ||
| In article | |||
| [7] | J. W. Stanley, “Retrogression on the Lower Colorado River After 1935,” T. Am. Soc. Civ. Eng., vol. 116, no. 1, pp. 943–954, Jan. 1951. | ||
| In article | View Article | ||
| [8] | S. L. Malhotra, “Effets des barrages et des déversoirs sur le régime des rivières,” in Proc. Int. Assoc. Hydraul. Res., 4ème réunion, | ||
| In article | |||
| [9] | H. H. Chang, Fluvial processes in river engineering, Reprint ed. Malabar, Fla: Krieger Publ, 1992. | ||
| In article | |||
| [10] | N. L. Poff, J. D. Olden, D. M. Merritt, and D. M. Pepin, “Homogenization of regional river dynamics by dams and global biodiversity implications,” Proc. Natl. Acad. Sci. U.S.A., vol. 104, no. 14, pp. 5732–5737, Apr. 2007. | ||
| In article | View Article PubMed | ||
| [11] | B. Alldredge and G. Moore, “Assessment of riparian vegetation sensitivity to river hydrology downstream of a major texas dam: assessment of riparian vegetation sensitivity to river hydrology,” River Res. Applic., vol. 30, no. 2, pp. 230–244, Feb. 2014. | ||
| In article | View Article | ||
| [12] | Gouvci, “Le barrage de Soubré : un projet structurant à impact direct.” Accessed: Sept. 23, 2025. [Online]. Available: https://www.gouv.ci/_actualite-article.php?recordID=13427 | ||
| In article | |||
| [13] | Cienergie, “Mise en eau du barrage de Gribo-Popoli.” [Online]. Available: https://www.cinergies.ci/2024/03/02/mise-en-eau-du-barrage-de-gribo-popoli/ | ||
| In article | |||
| [14] | OFB (Office français de la biodiversité), “L’altération de l’hydromorphologie d’un cours d’eau à l’origine de dysfonctionnements,” Office français de la biodiversité, France, RecueilHydro, 2010. | ||
| In article | |||
| [15] | G. Girard, J. Sircoulon, and P. Touchebeuf de Lussigny, Aperçu sur les régimes hydrologiques de Côte d’Ivoire 1970. in ORSTOM (Office de la Recherche Scientifique et Technique d’Outre-Mer). 1970. | ||
| In article | |||
| [16] | B. Konan, “Modélisation et gestion intégrée des ressources en eau dans le bassin versant du Sassandra (Côte d’Ivoire),” Thèse de doctorat 3ème cycle, Université d’Abobo Adjamé, Abidjan, Côte d’Ivoire), 2001. | ||
| In article | |||
| [17] | L. Congedo, “Semi-Automatic Classification Plugin: A Python tool for the download and processing of remote sensing images in QGIS,” JOSS, vol. 6, no. 64, p. 3172, Aug. 2021. | ||
| In article | View Article | ||
| [18] | D. H. N’Da, E. K. N’Guessan, M. E. Wajda, and A. Kouadio, “Apport de la télédétection au suivi de la déforestation dans le Parc National de la Marahoué (Côte d’ivoire),” Bulletin - Société Française de Photogrammétrie et de Télédétection, p. 1734, 2008. | ||
| In article | |||
| [19] | R. Caloz, T. J. Blaser, and G. Willemin, “Création d’une ortho-image à l’aide d’un modèle numérique d’altitude : influence des modes de ré-échantillonnage radiométrique,” Télédétection et cartographie., pp. 17–30, 1993. | ||
| In article | |||
| [20] | A. S. Sahu, “Identification et cartographie des zones inondées dans la partie Purba Medinipur du bassin du fleuve Keleghai, en Inde : méthodes RS et SIG,” Revue internationale des géosciences avancées, vol. 2, no. 2, pp. 59–65. | ||
| In article | |||
| [21] | S. K. McFEETERS, “The use of the Normalized Difference Water Index (NDWI) in the delineation of open water features,” International Journal of Remote Sensing, vol. 17, no. 7, pp. 1425–1432, May 1996. | ||
| In article | View Article | ||
| [22] | A. Garnier, S. Dufour, L. Lespez, S. Caillaut, and D. Delahaye, “Analyse spatiotemporelle de la dynamique fluviale d’un cours d’eau sahélo-soudanien entre 1967 et 2007. Le cas du Yamé au pays Dogon (Mali, Afrique de l’Ouest),” Revue internationale de géomatique, vol. 24, no. 3, pp. 279–306, Sept. 2014. | ||
| In article | View Article | ||
| [23] | E. Wiederkehr, S. Dufour, and H. Piégay, “Localisation et caractérisation semi-automatique des géomorphosites fluviaux potentiels. Exemples d’applications à partir d’outils géomatiques dans le bassin de la Drôme (France),” geomorphologie, vol. 16, no. 2, pp. 175–188, July 2010. | ||
| In article | View Article | ||
| [24] | G. J. Brierley and K. A. Fryirs, Eds., Geomorphology and River Management: Applications of the River Styles Framework, 1st ed. Wiley, 2004. | ||
| In article | View Article | ||
| [25] | L. B. Leopold and M. G. Wolman, River channel patterns, braided, meandering and straight. in Geology Survey Paper,. 1957. | ||
| In article | View Article | ||
| [26] | P. E. Ashmore, “How do gravel-bed rivers braid ?,” Can. J. Earth Sci., vol. 28, no. 3, pp. 326–341, Mar. 1991. | ||
| In article | View Article | ||
| [27] | D. Knighton, Fluvial Forms and Processes, 0 ed. Routledge, 2014.. | ||
| In article | View Article | ||
| [28] | G. Petts, “Appliedriver morphology, edited by D. Rosgen. Woldland Hydology, Pagosa Springs, CO, 1996. ISBN 0-9653289. Stream Reconnaissance Handbook, edited by C.R. Thorne. John Wiley & Sons, Chichester, 1998. ISBN 0-471-96856-0.,” Regul. Rivers: Res. Mgmt., vol. 15, no. 4, pp. 373–374, July 1999. | ||
| In article | View Article | ||
| [29] | A. Regos, M. Ninyerola, G. Moré, and X. Pons, “Linking land cover dynamics with driving forces in mountain landscape of the Northwestern Iberian Peninsula,” International Journal of Applied Earth Observation and Geoinformation, vol. 38, pp. 1–14, June 2015. | ||
| In article | View Article | ||
| [30] | F. C. Aguiar, M. J. Martins, P. C. Silva, and M. R. Fernandes, “Riverscapes downstream of hydropower dams: Effects of altered flows and historical land-use change,” Landscape and Urban Planning, vol. 153, pp. 83–98, Sept. 2016. | ||
| In article | View Article | ||
| [31] | R. Mukherjee, R. Bilas, S. S. Biswas, and R. Pal, “Bank erosion and accretion dynamics explored by GIS techniques in lower Ramganga river, Western Uttar Pradesh, India,” Spat. Inf. Res., vol. 25, no. 1, pp. 23–38, Feb. 2017. | ||
| In article | View Article | ||
| [32] | S. Dragićević et al., “Spatial and Temporal Variability of Bank Erosion during the Period 1930–2016: Case Study—Kolubara River Basin (Serbia),” Water, vol. 9, no. 10, p. 748, Sept. 2017. | ||
| In article | View Article | ||
| [33] | R. Islam, Md. N. Islam, and M. N. Islam, “Impacts of Bangabandhu Jamuna Multi-purpose Bridge on the dynamics of bar morphology at the Jamuna River in Bangladesh,” Model. Earth Syst. Environ., vol. 3, no. 3, pp. 903–925, Sept. 2017. | ||
| In article | View Article | ||
| [34] | T. Takagi, T. Oguchi, J. Matsumoto, M. J. Grossman, M. H. Sarker, and M. A. Matin, “Channel braiding and stability of the Brahmaputra River, Bangladesh, since 1967: GIS and remote sensing analyses,” Geomorphology, vol. 85, no. 3–4, pp. 294–305, Mar. 2007. | ||
| In article | View Article | ||
| [35] | S. Bandyopadhyay, K. Ghosh, and S. K. De, “A proposed method of bank erosion vulnerability zonation and its application on the River Haora, Tripura, India,” Geomorphology, vol. 224, pp. 111–121, Nov. 2014. | ||
| In article | View Article | ||
| [36] | S. S. Biswas and P. Pani, “Changes in the hydrological regime and channel morphology as the effects of dams and bridges in the Barakar River, India,” Environ Earth Sci, vol. 80, no. 5, p. 209, Mar. 2021. | ||
| In article | View Article | ||
Published with license by Science and Education Publishing, Copyright © 2025 Ismaïla Ouattara, Kouadio Assemien François Yao, Moussa Ouédraogo, Léréyaha Coulibaly, Kouadio Moïse Koffi, Amidou Dao and Bamory Kamagaté
 This work is licensed under a Creative Commons Attribution 4.0 International License. To view a copy of this license, visit
http://creativecommons.org/licenses/by/4.0/
This work is licensed under a Creative Commons Attribution 4.0 International License. To view a copy of this license, visit
http://creativecommons.org/licenses/by/4.0/
| [1] | I. Yuksel, “Barrages et hydroélectricité pour un développement durable,” Sources d’énergie Politique 4 du Plan économique, vol. 4, p. : 100-110. | ||
| In article | |||
| [2] | E. F. Moran, M. C. Lopez, N. Moore, N. Müller, and D. W. Hyndman, “Sustainable hydropower in the 21st century,” Proc. Natl. Acad. Sci. U.S.A., vol. 115, no. 47, pp. 11891–11898, Nov. 2018. | ||
| In article | View Article PubMed | ||
| [3] | H. Merritt and A. Barragán-Ocaña, “The impact of market factors on the development of eco-friendly energy technologies: the case of bioethanol,” Clean Techn Environ Policy, vol. 25, no. 2, pp. 313–321, 2021. | ||
| In article | View Article PubMed | ||
| [4] | B. Li, Z. Liang, Z. Bao, J. Wang, and Y. Hu, “Changes in streamflow and sediment for a planned large reservoir in the middle Yellow River,” Land Degrad Dev, vol. 30, no. 7, pp. 878–893, Apr. 2019. | ||
| In article | View Article | ||
| [5] | S. A. Brandt, “Classification of geomorphological effects downstream of dams,” CATENA, vol. 40, no. 4, pp. 375–401, Aug. 2000. | ||
| In article | View Article | ||
| [6] | S. Arroyo, “Channel improvement of the Rio Grande below El Paso,” Mexican Federal Civil Engineer, 1925. | ||
| In article | |||
| [7] | J. W. Stanley, “Retrogression on the Lower Colorado River After 1935,” T. Am. Soc. Civ. Eng., vol. 116, no. 1, pp. 943–954, Jan. 1951. | ||
| In article | View Article | ||
| [8] | S. L. Malhotra, “Effets des barrages et des déversoirs sur le régime des rivières,” in Proc. Int. Assoc. Hydraul. Res., 4ème réunion, | ||
| In article | |||
| [9] | H. H. Chang, Fluvial processes in river engineering, Reprint ed. Malabar, Fla: Krieger Publ, 1992. | ||
| In article | |||
| [10] | N. L. Poff, J. D. Olden, D. M. Merritt, and D. M. Pepin, “Homogenization of regional river dynamics by dams and global biodiversity implications,” Proc. Natl. Acad. Sci. U.S.A., vol. 104, no. 14, pp. 5732–5737, Apr. 2007. | ||
| In article | View Article PubMed | ||
| [11] | B. Alldredge and G. Moore, “Assessment of riparian vegetation sensitivity to river hydrology downstream of a major texas dam: assessment of riparian vegetation sensitivity to river hydrology,” River Res. Applic., vol. 30, no. 2, pp. 230–244, Feb. 2014. | ||
| In article | View Article | ||
| [12] | Gouvci, “Le barrage de Soubré : un projet structurant à impact direct.” Accessed: Sept. 23, 2025. [Online]. Available: https://www.gouv.ci/_actualite-article.php?recordID=13427 | ||
| In article | |||
| [13] | Cienergie, “Mise en eau du barrage de Gribo-Popoli.” [Online]. Available: https://www.cinergies.ci/2024/03/02/mise-en-eau-du-barrage-de-gribo-popoli/ | ||
| In article | |||
| [14] | OFB (Office français de la biodiversité), “L’altération de l’hydromorphologie d’un cours d’eau à l’origine de dysfonctionnements,” Office français de la biodiversité, France, RecueilHydro, 2010. | ||
| In article | |||
| [15] | G. Girard, J. Sircoulon, and P. Touchebeuf de Lussigny, Aperçu sur les régimes hydrologiques de Côte d’Ivoire 1970. in ORSTOM (Office de la Recherche Scientifique et Technique d’Outre-Mer). 1970. | ||
| In article | |||
| [16] | B. Konan, “Modélisation et gestion intégrée des ressources en eau dans le bassin versant du Sassandra (Côte d’Ivoire),” Thèse de doctorat 3ème cycle, Université d’Abobo Adjamé, Abidjan, Côte d’Ivoire), 2001. | ||
| In article | |||
| [17] | L. Congedo, “Semi-Automatic Classification Plugin: A Python tool for the download and processing of remote sensing images in QGIS,” JOSS, vol. 6, no. 64, p. 3172, Aug. 2021. | ||
| In article | View Article | ||
| [18] | D. H. N’Da, E. K. N’Guessan, M. E. Wajda, and A. Kouadio, “Apport de la télédétection au suivi de la déforestation dans le Parc National de la Marahoué (Côte d’ivoire),” Bulletin - Société Française de Photogrammétrie et de Télédétection, p. 1734, 2008. | ||
| In article | |||
| [19] | R. Caloz, T. J. Blaser, and G. Willemin, “Création d’une ortho-image à l’aide d’un modèle numérique d’altitude : influence des modes de ré-échantillonnage radiométrique,” Télédétection et cartographie., pp. 17–30, 1993. | ||
| In article | |||
| [20] | A. S. Sahu, “Identification et cartographie des zones inondées dans la partie Purba Medinipur du bassin du fleuve Keleghai, en Inde : méthodes RS et SIG,” Revue internationale des géosciences avancées, vol. 2, no. 2, pp. 59–65. | ||
| In article | |||
| [21] | S. K. McFEETERS, “The use of the Normalized Difference Water Index (NDWI) in the delineation of open water features,” International Journal of Remote Sensing, vol. 17, no. 7, pp. 1425–1432, May 1996. | ||
| In article | View Article | ||
| [22] | A. Garnier, S. Dufour, L. Lespez, S. Caillaut, and D. Delahaye, “Analyse spatiotemporelle de la dynamique fluviale d’un cours d’eau sahélo-soudanien entre 1967 et 2007. Le cas du Yamé au pays Dogon (Mali, Afrique de l’Ouest),” Revue internationale de géomatique, vol. 24, no. 3, pp. 279–306, Sept. 2014. | ||
| In article | View Article | ||
| [23] | E. Wiederkehr, S. Dufour, and H. Piégay, “Localisation et caractérisation semi-automatique des géomorphosites fluviaux potentiels. Exemples d’applications à partir d’outils géomatiques dans le bassin de la Drôme (France),” geomorphologie, vol. 16, no. 2, pp. 175–188, July 2010. | ||
| In article | View Article | ||
| [24] | G. J. Brierley and K. A. Fryirs, Eds., Geomorphology and River Management: Applications of the River Styles Framework, 1st ed. Wiley, 2004. | ||
| In article | View Article | ||
| [25] | L. B. Leopold and M. G. Wolman, River channel patterns, braided, meandering and straight. in Geology Survey Paper,. 1957. | ||
| In article | View Article | ||
| [26] | P. E. Ashmore, “How do gravel-bed rivers braid ?,” Can. J. Earth Sci., vol. 28, no. 3, pp. 326–341, Mar. 1991. | ||
| In article | View Article | ||
| [27] | D. Knighton, Fluvial Forms and Processes, 0 ed. Routledge, 2014.. | ||
| In article | View Article | ||
| [28] | G. Petts, “Appliedriver morphology, edited by D. Rosgen. Woldland Hydology, Pagosa Springs, CO, 1996. ISBN 0-9653289. Stream Reconnaissance Handbook, edited by C.R. Thorne. John Wiley & Sons, Chichester, 1998. ISBN 0-471-96856-0.,” Regul. Rivers: Res. Mgmt., vol. 15, no. 4, pp. 373–374, July 1999. | ||
| In article | View Article | ||
| [29] | A. Regos, M. Ninyerola, G. Moré, and X. Pons, “Linking land cover dynamics with driving forces in mountain landscape of the Northwestern Iberian Peninsula,” International Journal of Applied Earth Observation and Geoinformation, vol. 38, pp. 1–14, June 2015. | ||
| In article | View Article | ||
| [30] | F. C. Aguiar, M. J. Martins, P. C. Silva, and M. R. Fernandes, “Riverscapes downstream of hydropower dams: Effects of altered flows and historical land-use change,” Landscape and Urban Planning, vol. 153, pp. 83–98, Sept. 2016. | ||
| In article | View Article | ||
| [31] | R. Mukherjee, R. Bilas, S. S. Biswas, and R. Pal, “Bank erosion and accretion dynamics explored by GIS techniques in lower Ramganga river, Western Uttar Pradesh, India,” Spat. Inf. Res., vol. 25, no. 1, pp. 23–38, Feb. 2017. | ||
| In article | View Article | ||
| [32] | S. Dragićević et al., “Spatial and Temporal Variability of Bank Erosion during the Period 1930–2016: Case Study—Kolubara River Basin (Serbia),” Water, vol. 9, no. 10, p. 748, Sept. 2017. | ||
| In article | View Article | ||
| [33] | R. Islam, Md. N. Islam, and M. N. Islam, “Impacts of Bangabandhu Jamuna Multi-purpose Bridge on the dynamics of bar morphology at the Jamuna River in Bangladesh,” Model. Earth Syst. Environ., vol. 3, no. 3, pp. 903–925, Sept. 2017. | ||
| In article | View Article | ||
| [34] | T. Takagi, T. Oguchi, J. Matsumoto, M. J. Grossman, M. H. Sarker, and M. A. Matin, “Channel braiding and stability of the Brahmaputra River, Bangladesh, since 1967: GIS and remote sensing analyses,” Geomorphology, vol. 85, no. 3–4, pp. 294–305, Mar. 2007. | ||
| In article | View Article | ||
| [35] | S. Bandyopadhyay, K. Ghosh, and S. K. De, “A proposed method of bank erosion vulnerability zonation and its application on the River Haora, Tripura, India,” Geomorphology, vol. 224, pp. 111–121, Nov. 2014. | ||
| In article | View Article | ||
| [36] | S. S. Biswas and P. Pani, “Changes in the hydrological regime and channel morphology as the effects of dams and bridges in the Barakar River, India,” Environ Earth Sci, vol. 80, no. 5, p. 209, Mar. 2021. | ||
| In article | View Article | ||