This work is a pilot study in Aurangabad, Maharashtra, to determine the seasonal concentration of fine particulate matter PM2.5 with an aerodynamic diameter of less than 10µm between 2016 to 2018. The Seasonal concentration of PM2.5 and PM10 was recorded at fifteen representative sites throughout the city. The investigation revealed that the annual average concentration of the particulate matter at the CIDCO bus stop is high, with PM2.5 ranging from 74.64 µg/m3 to 88.75 µg/m3, while PM10 was ranging from 153.36 µg/m3 to 535.52 µg/m3, according to the central pollution control board standards respectively.
The present study aims to find out the concentrations of PM10 & PM2.5 in the ambient air of Aurangabad city & objective of this study is to provide authentic data regarding the concentration of PM10 and PM2.5 in ambient air Aurangabad. This study shall be useful to future students, researchers, and Policymakers.
Due to the rapid increase in population, environmental quality is gradually deteriorating, and human beings are suffering from many health-associated problems. Many studies in India have focused primarily on PM10, and comparatively, very few have looked at PM2.5. It has become a major environmental problem faced by the people globally in both developing and developed countries in recent times 1, 2, 3, 4 & India is one of them. Polluted air has a high potential to have detrimental effects on human health, acute and chronic 5. In the contemporary period, serious attempts have been made to study the suspended particulates of diameter less than 10µm considering their potency to influence property and life 6, 7.
Particulate matter has been extensively investigated in recent years because of its possible health impact and the necessity to formulate control measures. Particulate matter can come from various natural and artificial sources, including acid, biological, loam, and dust particles 8, 9. PM2.5 concentrations should not surpass an annual mean of 40 µg/cm3 and a 24-hour mean of 60 µg/m3 according to CPCB's NAAQS ambient air guidelines 10. According to the CPCB, PM10 levels should not go above 60 µg/m3 yearly and 100 µg/m3 on a 24-hour basis 11, as shown in Table 1.
Monitoring was carried out according to regulations set through the Central Pollution Control Board, India 13. At each sampling site, the samplers were placed at the height of four feet. In three distinct seasons, namely Summer (March - June), Monsoon (July - October), and Winter (November - February), a continuous sample of respirable particles was undertaken on a 24 hours basis. For the PM10 sample, a Respirable Dust Sampler (RDS, Envirotech, APM 460) with a flow rate of 1.1 m3/min was utilized. For coarse particles PM2.5 Envirotech, APM 550 sampler was used, with a steady flow rate of 16.6 liters per minute. It has a moveable Wins-Anderson impactor used to sample PM 2.5 many times. Glass fiber paper (8×10") and Teflon filter paper with a 47-millimeter diameter were used in the sample of PM10 and PM2.5. Before and after collecting the sample, the filters
They were stabilized in a desiccator containing silica gel for 24 hours, and the weight of collected dust was measured on a pre-calibrated electronic balance before and after sampling. The ambient air mass concentration was estimated by dividing the weight of collected dust by the amount of air sampled.
2.1. The Study AreaAurangabad is a city in the state of Maharashtra in India. Aurangabad district lies between 19018' and 20040' North latitude and 74040' and 76040' East longitude with an area of 16,200.0 square kilometers had a city population of 1,175,116 (Aurangabad City Population Census 2011-2019 | Maharashtra n.d.) 12. Aurangabad is known as “The city of Gates.” It had 52 gates, and the solid presence of these can be felt as any person drives through the city.
2.2. Description of sampling SitesThe present investigation deals with the study of seasonal variations of PM2.5 and PM10 from 2016 to 2018 from fifteen sites of Aurangabad city, Maharashtra (India). The detailed sampling sites description is shown in Table 2.
All the 15 sites mentioned above were selected considering the activities at the site and the volume of the population visiting the sites daily. Also, the sites were selected so that all the geographical expanse of the city would be covered to a significant extent.
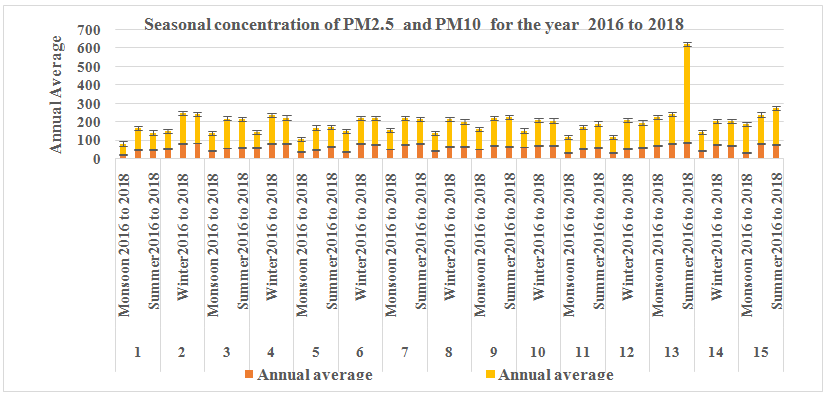
Graph 1 shows an annual mean seasonal concentration of PM2.5 and PM10 from fifteen different sites of Aurangabad city over two years. During the study period, particulate concentration was low because of wet deposition in the monsoon. The above condition is due to the scavenging of particles or dissolved gaseous contaminants from the air, which causes aerosols to fall to the ground (Tian et al., 2021). Site 1 had the lowest concentrations of both particulate compared to the other sites. PM2.5 levels vary from 23.88 µg/m3 to 52.53 µg/m3, while PM10 levels range from 59.63 µg/m3 to 116.87 µg/m3. Perhaps because of the abundant flora on campus, the restricted quantity of heavy vehicles in the vicinity, and also it is covered mountainous terrain.
For site 13, there was an average seasonal variation, with a higher concentration occurring during the summer season. PM2.5 range from 74.64 µg/m3 to 88.75 µg/m3, while PM10 range from 153.36 µg/m3 to 535.52 µg/m3 respectively. Due to the frequent heavy traffic, buses are the city's main bus station.
Meteorological observations, i.e., temperature, relative humidity(RH), wind speed (WS), and wind direction (WD), were all recorded during the assessment period. The average minimum temperature was 22°C and maximum 32°C, respectively. The relative humidity (RH) ranged between 30 and 55 percent, with a westerly wind direction, wind speed of 5 to 12 kilometers per hour. We identified a substantial association between the annual average of particle matter and meteorological observations for the study region.
Season-wise correlation for the study region, as shown in Table 3, is a positive correlation between PM2.5 and PM10 in temperature (r =0.41). Wind speed and temperature have a very strong positive correlation (r = 0.99) throughout the winter season. There is a negative correlation between all the factors with particulate matter in the monsoon season, as shown in Table 4. There is a positive correlation between temperature (r= 0.55) in summer, as shown in Table 5.
The PM10 and PM2.5 values had a high annual average compared to the central pollution control board standards. The meteorological parameters affect particulate matter in different seasons 14. Strong seasonal modulation occurred, and the lower monsoon average decreased the annual average. Traffic was the main source of particulate matter 15. Due to rising particulate matter concentrations and road dust resuspension, increased vehicular numbers, the development of unstructured infrastructure, poor road conditions, less greenery, and population growth. High concentrations of respirable suspended particulate matter (PM2.5) due to the utilization of diesel vehicles, even residue produced through utilizing continued brakes, gears, and so on builds the particulate matter.
The following recommendations are given based on the study's findings:
i. According to the study, particulate dispersion in airborne dust can be decreased by limiting the likelihood of raw sand emission during transportation, setting speed limits on loaded trucks, and so on.
ii. Unpaved roads primarily inhibit particulate resuspension, reducing ambient particulate concentrations.
iii. Encourage compressed natural gas (CNG) automobiles instead of diesel and gasoline vehicles.
The author would like to thank guide Dr. N. N. Bandela (Professor, Department of Environmental Science, Dr. Babasaheb Ambedkar Marathwada University) for helpful suggestions and thankful to my colleague Mr.Amol kale, Dr. Sushma Darade & Mr.Suraj Gaikwad.
| [1] | S. C. Barman et al., “Assessment of urban air pollution and its probable health impact,” J. Environ. Biol., vol. 31, no. 6, pp. 913-920, 2010. | ||
| In article | |||
| [2] | D. A. Nagdeve, “Environmental pollution and control: A case study of Delhi megacity,” Popul. Environ., 2004. | ||
| In article | |||
| [3] | P. D. Charan and H. Sahel, “Study of Respirable Dust in Ambient Air of Bikaner City and Its Impact on Human Health,” vol. 3, no. 1, pp. 11-14, 2014. | ||
| In article | |||
| [4] | S. Maji, S. Ahmed, and W. A. Siddiqui, “Air quality assessment and its relation to potential health impacts in Delhi, India,” Curr. Sci., 2015. | ||
| In article | |||
| [5] | P. Ravikumar, K. L. Prakash, and R.. Somashekar, “Air Quality Indices To Understand The Ambient Air Quality In Vicinity Of DAM Sites Of Different Irrigation Projects Karnataka State, India,” Int. J. Sci. Nat., vol. 5, no. 3, pp. 531-541, 2014. | ||
| In article | |||
| [6] | J. Schwartz and L. M. Neas, “Fine Particles Are More Strongly Associated than Coarse Particles with Acute Respiratory Health Effects in Schoolchildren,” Epidemiology, vol. 11, no. 1, 2000. | ||
| In article | View Article PubMed | ||
| [7] | B. Segalin, P. Kumar, K. Micadei, A. Fornaro, and F. L. T. Gonçalves, “Size–segregated particulate matter inside residences of elderly in the Metropolitan Area of São Paulo, Brazil,” Atmos. Environ., 2017. | ||
| In article | View Article | ||
| [8] | R. Kumar and A. E. Joseph, “Air pollution concentrations of PM2.5, PM10, and NO2 at ambient and Kerbsite and their correlation in Metro City - Mumbai,” Environ. Monit. Assess., 2006. | ||
| In article | View Article PubMed | ||
| [9] | M. Shekar Reddy and C. Venkataraman, “Atmospheric optical and radiative effects of anthropogenic aerosol constituents from India,” Atmos. Environ., vol. 34, no. 26, pp. 4511-4523, 2000. | ||
| In article | View Article | ||
| [10] | K. Valsaraj, “U.S. National Ambient Air Quality Standards,” in Elements of Environmental Engineering, 2009. | ||
| In article | |||
| [11] | R. K. Mishra, A. Sharma, M. Parida, and S. Rangnekar, “EIA based noise impact analysis for MRTS corridor,” in 39th International Congress on Noise Control Engineering 2010, INTER-NOISE 2010, 2010. | ||
| In article | |||
| [12] | “Aurangabad City Population Census 2011-2019 | Maharashtra.” | ||
| In article | |||
| [13] | CPCB, “Guidelines for Manual Sampling,” Natl. Ambient Air Qual. Ser. Vol - I, 2013. | ||
| In article | |||
| [14] | H. Yang, Q. Peng, J. Zhou, G. Song, and X. Gong, “The unidirectional causality influence of factors on PM2.5 in Shenyang city of China,” Sci. Rep., vol. 10, no. 1, pp. 1-12, 2020. | ||
| In article | View Article PubMed | ||
| [15] | D. Jandacka, D. Durcanska, and M. Bujdos, “The contribution of road traffic to particulate matter and metals in air pollution in the vicinity of an urban road,” Transp. Res. Part D Transp. Environ., vol. 50, pp. 397-408, 2017. | ||
| In article | View Article | ||
Published with license by Science and Education Publishing, Copyright © 2022 Anita Sheshrao Ingle and Narsingrao Narayanswami Bandela
 This work is licensed under a Creative Commons Attribution 4.0 International License. To view a copy of this license, visit
http://creativecommons.org/licenses/by/4.0/
This work is licensed under a Creative Commons Attribution 4.0 International License. To view a copy of this license, visit
http://creativecommons.org/licenses/by/4.0/
| [1] | S. C. Barman et al., “Assessment of urban air pollution and its probable health impact,” J. Environ. Biol., vol. 31, no. 6, pp. 913-920, 2010. | ||
| In article | |||
| [2] | D. A. Nagdeve, “Environmental pollution and control: A case study of Delhi megacity,” Popul. Environ., 2004. | ||
| In article | |||
| [3] | P. D. Charan and H. Sahel, “Study of Respirable Dust in Ambient Air of Bikaner City and Its Impact on Human Health,” vol. 3, no. 1, pp. 11-14, 2014. | ||
| In article | |||
| [4] | S. Maji, S. Ahmed, and W. A. Siddiqui, “Air quality assessment and its relation to potential health impacts in Delhi, India,” Curr. Sci., 2015. | ||
| In article | |||
| [5] | P. Ravikumar, K. L. Prakash, and R.. Somashekar, “Air Quality Indices To Understand The Ambient Air Quality In Vicinity Of DAM Sites Of Different Irrigation Projects Karnataka State, India,” Int. J. Sci. Nat., vol. 5, no. 3, pp. 531-541, 2014. | ||
| In article | |||
| [6] | J. Schwartz and L. M. Neas, “Fine Particles Are More Strongly Associated than Coarse Particles with Acute Respiratory Health Effects in Schoolchildren,” Epidemiology, vol. 11, no. 1, 2000. | ||
| In article | View Article PubMed | ||
| [7] | B. Segalin, P. Kumar, K. Micadei, A. Fornaro, and F. L. T. Gonçalves, “Size–segregated particulate matter inside residences of elderly in the Metropolitan Area of São Paulo, Brazil,” Atmos. Environ., 2017. | ||
| In article | View Article | ||
| [8] | R. Kumar and A. E. Joseph, “Air pollution concentrations of PM2.5, PM10, and NO2 at ambient and Kerbsite and their correlation in Metro City - Mumbai,” Environ. Monit. Assess., 2006. | ||
| In article | View Article PubMed | ||
| [9] | M. Shekar Reddy and C. Venkataraman, “Atmospheric optical and radiative effects of anthropogenic aerosol constituents from India,” Atmos. Environ., vol. 34, no. 26, pp. 4511-4523, 2000. | ||
| In article | View Article | ||
| [10] | K. Valsaraj, “U.S. National Ambient Air Quality Standards,” in Elements of Environmental Engineering, 2009. | ||
| In article | |||
| [11] | R. K. Mishra, A. Sharma, M. Parida, and S. Rangnekar, “EIA based noise impact analysis for MRTS corridor,” in 39th International Congress on Noise Control Engineering 2010, INTER-NOISE 2010, 2010. | ||
| In article | |||
| [12] | “Aurangabad City Population Census 2011-2019 | Maharashtra.” | ||
| In article | |||
| [13] | CPCB, “Guidelines for Manual Sampling,” Natl. Ambient Air Qual. Ser. Vol - I, 2013. | ||
| In article | |||
| [14] | H. Yang, Q. Peng, J. Zhou, G. Song, and X. Gong, “The unidirectional causality influence of factors on PM2.5 in Shenyang city of China,” Sci. Rep., vol. 10, no. 1, pp. 1-12, 2020. | ||
| In article | View Article PubMed | ||
| [15] | D. Jandacka, D. Durcanska, and M. Bujdos, “The contribution of road traffic to particulate matter and metals in air pollution in the vicinity of an urban road,” Transp. Res. Part D Transp. Environ., vol. 50, pp. 397-408, 2017. | ||
| In article | View Article | ||