The simple distillation of ethanol-water mixture is a well-known experimental subject in either general chemistry laboratory or organic chemistry laboratory. The objective is to provide a reliable guidance for college students who are major in chemistry or chemical engineering to obtain repeatable results during the simple distillation of ethanol-water mixture. The liquid-vapor phase diagram of ethanol-water mixtures was introduced before experiment. As similar to a tradition distillation assembly, Liebig condenser, specific gravity hydrometer set, and heating mantle were mainly employed to perform the experiment of a simple distillation with minor but critical changes. The examination of diverse results in distillate amounts and distillate ethanol concentrations were analyzed by Rayleigh equation. The simple distillation was evaluated at the assigned temperature that was selected from liquid-vapor phase diagram. Even though the first evaporation started at a temperature below the theoretical bubble point shown in liquid-vapor phase diagram in most cases, the set temperature was gradually adjusted and maintained until no more vapor generated. In fact, this work motivates students to design their simple distillation plans through changing initial ethanol concentration and set temperature. The experimental data from 23 groups suggest that the accuracy and the precision were dependent upon how to control heating rates and to sustain set temperature in this work.
The practice of a simple distillation of ethanol-water mixture is often included in freshmen laboratory courses in chemistry or chemical engineering major 1, 2. The similar experiment called a simulated distillation was performed in petrochemical laboratory for mainly refinery purpose 3, 4. In brief comparison, while a simulated distillation uses a temperature program that keeps increasing temperatures and collects fractions based on their boiling points, a simple distillation focuses on a specific collection at a certain temperature, such as distillate collection at a bubble point. If a simple distillation proceeds without heating control, the system temperature will keep increasing and the characteristic analysis of distillates would be similar to the analysis in simulated distillation. In practice, the simple distillation of ethanol-water mixtures often uses the assigned temperatures that were selected between 80~89°C, slightly higher temperature than ethanol boiling point. In a traditional practice, specific gravity measurement is used to determine the ethanol concentration of distillates using a hydrometer 5, a device working on the principle of buoyancy. If it exceeds the measurement limit of the hydrometer, recommended is to use a hydrometer in different range of measurement. For example, one hydrometer has specified measurement ranges, such as 0.940 to 1.000. The hydrometer measurement has advantages when strong acid or strong alkali solutions are determined. Listed below are considerations that students often brought during a simple distillation experiment of binary ethanol-water mixtures.
• Can we determine when a simple distillation ends?
• Is the experiment always predictable?
• How to operate the distillation experiment when we change ethanol concentrations?
In order to response the considerations above, we focused on accuracy and precision of experiment in this paper. And the phase diagram of ethanol-water mixtures was essentially needed to explain the overall phenomena of simple distillation 6, 7, 8. The objectives are to motivate students to design the simple distillation of ethanol-water mixtures by changing ethanol concentration and temperature set by their own plan and to examine the results by comparison with their prediction. As background skills, students are encouraged to have several capabilities to measure the mass, density, and specific gravity of a liquid, to convert and calculate the weight and molar ratios of liquids, to assemble distillation parts, and to interpret liquid-vapor phase diagram.
In a laboratory practice, the simple distillation of ethanol-water mixtures is often performed in one of first stage of task subjects. A faculty and lab assistant (if available) should examine whether hydrometers work properly. The simple distillation of ethanol-water mixtures is performed in a traditional glassware assembly. Figure 1 shows the typical assembly of a simple distillation. The schematic diagram was drawn by ChemSketch software 9. In many cases, thermometer can be installed in two different locations. One is placed in near the entrance to a Liebig condenser and the other case is installed inside the liquid in still pot. If one thermometer is placed in the entrance of Liebig condenser, no significant temperature increases are observed until vapor starts to generate. It will be advantageous only if the distillation adapts the simulated distillation that requires the continuous heating for fraction cuts 3, 4. Therefore, it seems to be reasonable when the thermometer placed inside the liquid, which is easy to monitor the temperature of liquid mixture in heating process.

In this work, we installed two thermometers in both places mentioned above. That is, one thermometer is installed in front of inlet of Liebig condenser and the other is placed inside the mixture liquid. The current employed assembly is presented in Figure 2. Here, the temperatures of liquid mixture and vapor can be comparatively monitored. The monitoring of two temperatures has been reported elsewhere 10. Temperature monitoring from two locations is suggested for quality control as well 11. However, a sensor monitoring needs more sophisticated equipment system. It should be noted that this work focused on the utilization of traditional assembly system with minor modification.

The overall procedure of simple distillation is enlisted below, when a heating mantle is used.
1) Turn on the power switch of the heating mantle, then turn the analog switch to a position and adjust levels during heating.
2) After operating the cooling water in Liebig condenser to flow, examine whether an ethanol-water mixture in 2-neck round flask placed on the heating mantle starts to boil.
3) As evaporation begins, the condensed sample is collected through the cooling tube within Liebig condenser.
4) While reading the scale of the thermometer, if necessary, turn the analog switch left and right to adjust the temperature of heating mantle.
5) Keep the liquid mixture in 2-neck round flask at 85°C as best as we operate (in case of ethanol 30% w/w). Here, a set temperature can vary depending upon the ethanol concentrations.
6) Continue to collect the condensed sample, and when there is no more effluent, stop the experiment and turn off the heating mantle.
7) After waiting for the heating mantle to cool, dismantle the device
8) Measure the specific gravity of the distillate and the residues using hydrometers after moved proper amount to a 100mL mass cylinder.
Apart from monitoring two thermometers shown in Figure 2, the performance of heating mantle is also critically important. When fast heating was applied, early evaporation is easy to occur. It may occur because the two-neck round flask can be heated up to higher temperatures than we originally planned for a distillation schedule. Nevertheless, evaporation also affects to slow increase of temperature in overheated liquid mixtures during distillation operation. For instance, if the target temperature was 85°C in case of 30% w/w (0.144 mole fraction), we can easily detect the evaporation start as low as 80°C. As vapor generates, we can also easily detect temperature increases of thermometer 1. Interestingly, the temperature increase of mixture was not accelerated when vapor generates because evaporation is endothermic. However, evaporation proceeds for approximately 20 minutes, which helps us to control the slow heating up to 85°C from 80°C by manual adjustment. Manual adjustment can be successful when turning off heating before reaching 1 degree below, here, at 84°C. Evaporation and slow heating harmonizes to reach the target temperature for minutes. If the temperature did not reach to a target temperature, the control of heating can be applicable through heating application in a short period of time. The temperature differences between thermometer 1 and 2 were recorded by 5 degrees in most cases. As vapor generation becomes slow, the decrease of temperature in thermometer 1 is noticeable. The sudden decrease of temperature in thermometer 1 suggest us the termination of distillation at a certain temperature. After evaporation stops, the weight measurement of distillate is followed by the determination of specific gravity. The temperature of distillate is also measured at the same time.
The phenomenon of distillation is simple, and it can be said that a boiling liquid comes out when the temperature rises. However, a distillation has the ultimate purpose of separating one component from liquid mixture. If one component in binary mixture is separated completely from their initial state, a distillation will be a very useful method. However, one component is not completely separated from one another in ethanol-water binary mixtures. It is general concept that vapor composition is quite different from liquid mixtures in binary system. Regarding simple distillation of ethanol-water mixtures, the boiling point and liquid-vapor compositions were published long ago and has been widely used 6, 7, 8. In addition, azeotropic concept in ethanol-water system is well-known 12. It refers that the composition in liquid phase and vapor phase are same, which explains the difficulty of distillation method to obtain high purity of ethanol. And, it is also popular concept to use multiple distillations in order to produce high purity ethanol instead of simple distillation 13, 14. These azeotropic and multiple distillations are beyond the scope of this paper and are not discussed in detail here.
For our simple distillation, 400 grams of 30% (w/w) ethanol-water mixture (126 g of 95% ethanol and 274 g of distilled water) were placed in a 1000 mL 2-neck round flask. The end part of Liebig condenser connected a 200mL Erlenmeyer flask using a connecting tube. For better sealing, each joint is secured with joint clips made of polymer material. The boiling point of ethanol-water mixtures varies depending on ethanol contents. In general, liquid-vapor phase diagram at certain pressure condition is useful to understand the distillation process. Liquid-vapor phase diagram of ethanol-water mixtures were presented in Figure 3. The diagram was plotted by the data provided in references 7, 8. The curve in liquid composition represents the bubble points of ethanol-water mixtures. And the curve in vapor composition provides the composition of distillate after condensed during simple distillation. In Figure 3, the capital letters F, D, and R represent the feed, the distillate and the residue, respectively. Initial concentration of ethanol was 30% w/w (0.144 mole fraction). For the convenience for students, weight percentage was used for mixture preparation. However, liquid-vapor phase diagram was presented with respect to mole fraction of ethanol in Figure 3.

If a distillation starts, we expect the distillation temperature would be near 85°C and ethanol concentration of distillate would be 70% w/w (0.475 mole fraction). However, the evaporation easily started at the temperature below 85°C, such as 80°C. This may be the effect of fast heating rates that affect to the temperature increase in glassware flask in advance. When glassware was carefully heated, the evaporation may begin as close as 85°C. In practice, the temperature of liquid mixture is slow increase during evaporation process. It can be interpreted that endothermic evaporation regulates the fast heating of liquid mixture. The mixture temperature was slowly reached to 85°C during evaporation process. The evaporation proceeded for 20 to 30 minutes and then no more vapor generated. The amount and specific gravity of distillate were determined and recorded 15.
Return to Figure 3, the short length of error bars in F (feed) represents the initially well-prepared ethanol concentration. Other longer error bars in D (distillate) and R(residue) present the deviation of experimental data form students. The boiling point of ethanol-water mixture (0.144 mole fraction) is near 85°C. If this temperature is maintained steadily, the evaporation process will proceed and vapor concentration would be the concentration at D point (0.475 mole fraction). The longer error bars in D is not statistically represented but conceptually presented that the results were occurred in certain deviation. After distillation is over, the specific gravity of the collected distillate was determined by the hydrometer (0.82-0.88). The specific gravity data of distillates were converted to the ethanol concentration. If thermometer 2 works properly, the question will be raised why we still need thermometer 1. Someone will claim that we may need one thermometer instead of two thermometers installation. In our experience, thermometer 1, located near the inlet of Liebig condenser, is still important to install because it provides the right time about when evaporation starts and when no more evaporation comes. In brief, the temperature of thermometer 1 rises when vapor starts to come out and stays at a certain temperature (slightly lower temperature than bubble point) until no more vapor generate. Then, the rapid decrease of temperature is observed when no vapor generates from liquid mixture. Meanwhile, temperature of thermometer 2 kept increasing until vapor starts to come out. Once vapor comes out, the temperature of liquid stays for minutes and slowly climbs up to target temperature, here, the temperature at F point in Figure 3. In our case with 30% w/w ethanol-water mixture (0.144 mole fraction), vapor starts to generate at 80°C, and stays for minutes and increases slowly up to 85°C. It should be reminded that the bubble point of 30% w/w of ethanol-water mixture is near 85°C. Here, we need to operate carefully not to overheat as mentioned above. It sounds little arbitrary but it could be persuasive as long as accuracy and precision are concerned. Without thermometer 1, accuracy and precision of simple distillation could be hardly achieved. In order to examine the validity of our current simple distillation, Rayleigh equation was used to examine the distillation process. In equation (1) and (2), Rayleigh equations were presented. Here, x and y are the ethanol mole fractions in liquid phase and vapor phase in equilibrium state. In our experiment, since we measured the feed amount (F) and distillate amount (D), the left-hand side of Rayleigh equation became constant.
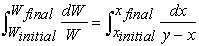 | (1) |
 | (2) |
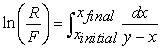
The right-hand side of Rayleigh equation is often calculated by integration of experimental data. In general, a simple distillation in temperature ranges of equilibrium state use the average value of (y-x) that is also counted by the values shown in Figure 3. The value, 0.331 was used in this work. The hypothesis is that current distillation proceeds in narrow temperature gradients, which assumes dx is as small as 0.1 or less. The experimental data and calculated data from 23 groups were presented in Table 1. The subscripts 1, 2 represent ethanol and water, respectively. Equations were represented by mole fraction, xi. The values of dx were at the ranges between 0.037 and 0.086. The value of dx is dependent upon the temperature control at near the bubble point. This suggest that the lower value of dx can be obtained by well-controlled heating at setting temperature. As reminded, the set temperature was 85°C. The overheating may be possible in a heating mantle and overheating may generate more fraction of ethanol-water vapor with less concentration of ethanol. The bigger in dx value leads the larger amount of distillate with less concentration of ethanol in general.
In Figure 4, total moles of distillate were presented by mole fraction as well as weight fraction. The data of 23 results showed more or less inverse relations between distillate amount and mole fraction as expected. As the distillate amount is becoming less, ethanol concentration will be higher. The advantages in this work are to help students to choose ethanol concentrations for their future experiments, such as 20wt.%, 40wt.%, and so on. If students design their distillation schedules, they can predict the bubble point and distillate concentration. This work suggests that well-control heating can be achieved by two thermometers monitoring and also improved in the prediction of ethanol concentration in distillates even in the variances of ethanol concentrations and set temperatures. The accuracy and precision will be also expected.
The simple distillation of ethanol-water mixture is a well-known experimental subject in colleges. The objective is to provide a reliable guidance for college students who are major in chemistry or chemical engineering to obtain repeatable and reproducible results during the simple distillation of ethanol-water mixture. Understanding of liquid-vapor phase diagram was very important for simple distillation experiment. In this work, 30% w/w ethanol-water binary mixture (0.144 mole fraction) was selected and examined if new assembly system works properly. In order to examine the result, the Rayleigh equation was employed to calculate and compare the results from 23 groups of students. Since the overheating in laboratory practice look indispensable, the approach adapting temperature gradient in Rayleigh equation can be appropriate. It suggested that the distillate amount was dependent upon the temperature gradient. The objective of this study is to verify whether we can predict the ethanol concentration in distillate though monitoring temperatures with two thermometers combined with well-controlled heating and also to reproduce the data. This can be achievable when the distillation temperature was set to a certain temperature near equilibrium temperature in liquid-vapor phase diagram. We claim that the understanding of liquid-vapor phase diagram and simple distillation using two thermometers would provide the repeatable data if careful heating rate and heat temperature were maintained. Heating control needs both thermometers’ reading. The great improvement of accuracy and precision was achieved with new distillation assembly.
The authors don’t have any conflict of interest.
| [1] | Noyes, W.A., Warfel, R.R., “The Boiling-Point Curve for Mixtures of Ethyl Alcohol and Water,” J. Am. Chem. Soc., 23(7), 463-468, 1901. | ||
| In article | View Article | ||
| [2] | Fenster, A.N., “A Simple Distillation Apparatus,” J. Chem. Edu., 44(11), 660, 1967. | ||
| In article | View Article | ||
| [3] | Worman, J.C., Green, L.E., “Simulated distillation of high boiling petroleum fractions,” Anal. Chem., 37(12), 1620-1621, 1965. | ||
| In article | View Article | ||
| [4] | Raia, J.C., Villananti, D.C., Subramanian, M., and Williams, B., “Application of high-temperature simulated distillation to the residuum oil supercritical extraction process in petroleum refining,” J. Chromatogr. Sci., 38(1), 1-5, 2000. | ||
| In article | View Article PubMed | ||
| [5] | Murphy, M.D., “A Low-Cost, Precision Hydrometer for Classroom Use,” J. Chem. Edu., 60(10), 871, 1983. | ||
| In article | View Article | ||
| [6] | https://www.wattco.com/casestudy/phase-equilibrium/ [accessed Oct. 5, 2022]. | ||
| In article | |||
| [7] | Seader, J.D., Kurtyka, Z.M., Distillation, Ch.13, Perry’s Chemical Engineers’ Handbook, 50th Ed. McGrow-Hill International Edition, 1984. | ||
| In article | |||
| [8] | http://www.ddbst.com/en/EED/VLE/VLE%20Ethanol%3BWater.php [accessed Oct. 5, 2022]. | ||
| In article | |||
| [9] | https://www.acdlabs.com/resources/free-chemistry-software-apps/chemsketch-freeware/ [accessed Oct. 5, 2022]. | ||
| In article | |||
| [10] | Binous, H., Al-Harthi, M.A., “Simple Batch Distillation of a Binary Mixture, Comput. Appl. Eng. Educ. 2021. [online] available at wileyonlinelibrary.com/journal/cae. | ||
| In article | |||
| [11] | Clawhammer Supply, “Distillation Temperature,” March 26, 2014. https://www.clawhammersupply.com/blogs/moonshine-still-blog/12243869-making-moonshine-still-temperature [accessed Oct. 5, 2022] | ||
| In article | |||
| [12] | Tavan, Y., Hosseini, S. H., “A novel integrated process to break the ethanol/water azeotrope using reactive distillation–Part I: Parametric study,” Sep. Purifi. Technol., 118, 455-462, 2013. | ||
| In article | View Article | ||
| [13] | Madson, P.W., Ethanol distillation: the fundamentals, Ch. 22, (The Alcohol Testbook, 4th Ed.), 2003, 319-336. | ||
| In article | |||
| [14] | Ravagnani, M. A. S. S., Reis, M. H. M., Maciel Filho, R., and Wolf-Maciel, M. R., “Anhydrous ethanol production by extractive distillation: A solvent case study,” Process Saf. Environ. Prot., 88(1), 67-73, 2010. | ||
| In article | View Article | ||
| [15] | Engineering ToolBox, (2019). Ethanol Water Mixtures - Densities vs. Temperature. [online] Available at: https://www.engineeringtoolbox.com/ethanol-water-mixture-density-d_2162.html [accessed Oct. 5, 2022]. | ||
| In article | |||
Published with license by Science and Education Publishing, Copyright © 2022 Kyeongseok Oh, Byoung-Un Kang and Joo-Il Park
![]() This work is licensed under a Creative Commons Attribution 4.0 International License. To view a copy of this license, visit
http://creativecommons.org/licenses/by/4.0/
This work is licensed under a Creative Commons Attribution 4.0 International License. To view a copy of this license, visit
http://creativecommons.org/licenses/by/4.0/
| [1] | Noyes, W.A., Warfel, R.R., “The Boiling-Point Curve for Mixtures of Ethyl Alcohol and Water,” J. Am. Chem. Soc., 23(7), 463-468, 1901. | ||
| In article | View Article | ||
| [2] | Fenster, A.N., “A Simple Distillation Apparatus,” J. Chem. Edu., 44(11), 660, 1967. | ||
| In article | View Article | ||
| [3] | Worman, J.C., Green, L.E., “Simulated distillation of high boiling petroleum fractions,” Anal. Chem., 37(12), 1620-1621, 1965. | ||
| In article | View Article | ||
| [4] | Raia, J.C., Villananti, D.C., Subramanian, M., and Williams, B., “Application of high-temperature simulated distillation to the residuum oil supercritical extraction process in petroleum refining,” J. Chromatogr. Sci., 38(1), 1-5, 2000. | ||
| In article | View Article PubMed | ||
| [5] | Murphy, M.D., “A Low-Cost, Precision Hydrometer for Classroom Use,” J. Chem. Edu., 60(10), 871, 1983. | ||
| In article | View Article | ||
| [6] | https://www.wattco.com/casestudy/phase-equilibrium/ [accessed Oct. 5, 2022]. | ||
| In article | |||
| [7] | Seader, J.D., Kurtyka, Z.M., Distillation, Ch.13, Perry’s Chemical Engineers’ Handbook, 50th Ed. McGrow-Hill International Edition, 1984. | ||
| In article | |||
| [8] | http://www.ddbst.com/en/EED/VLE/VLE%20Ethanol%3BWater.php [accessed Oct. 5, 2022]. | ||
| In article | |||
| [9] | https://www.acdlabs.com/resources/free-chemistry-software-apps/chemsketch-freeware/ [accessed Oct. 5, 2022]. | ||
| In article | |||
| [10] | Binous, H., Al-Harthi, M.A., “Simple Batch Distillation of a Binary Mixture, Comput. Appl. Eng. Educ. 2021. [online] available at wileyonlinelibrary.com/journal/cae. | ||
| In article | |||
| [11] | Clawhammer Supply, “Distillation Temperature,” March 26, 2014. https://www.clawhammersupply.com/blogs/moonshine-still-blog/12243869-making-moonshine-still-temperature [accessed Oct. 5, 2022] | ||
| In article | |||
| [12] | Tavan, Y., Hosseini, S. H., “A novel integrated process to break the ethanol/water azeotrope using reactive distillation–Part I: Parametric study,” Sep. Purifi. Technol., 118, 455-462, 2013. | ||
| In article | View Article | ||
| [13] | Madson, P.W., Ethanol distillation: the fundamentals, Ch. 22, (The Alcohol Testbook, 4th Ed.), 2003, 319-336. | ||
| In article | |||
| [14] | Ravagnani, M. A. S. S., Reis, M. H. M., Maciel Filho, R., and Wolf-Maciel, M. R., “Anhydrous ethanol production by extractive distillation: A solvent case study,” Process Saf. Environ. Prot., 88(1), 67-73, 2010. | ||
| In article | View Article | ||
| [15] | Engineering ToolBox, (2019). Ethanol Water Mixtures - Densities vs. Temperature. [online] Available at: https://www.engineeringtoolbox.com/ethanol-water-mixture-density-d_2162.html [accessed Oct. 5, 2022]. | ||
| In article | |||


