The economic growth that Zambia seeks to attain calls for alternative sources of energy besides hydroelectricity which has proved inadequate due in part to climate change. One such form of alternative energy is geothermal energy. Various research has been undertaken on the feasible way of harnessing geothermal energy using different methods such as thermal, electrical, magnetic and seismic methods. But exploring for potential sites was still a challenge. One way round this challenge was to devise a method that first identifies potential geothermal sites instead of relying on trial and error scenarios. This study used gravity data obtained by the European Space Agency (ESA) through Global Monitoring for Environment and Security (GMES) project. This data was used to calculate gravity disturbances of the earth’s crust in order to understanding density variations in the subsurface geology. This study therefore, used the density variations in the subsurface geology to map potential geothermal sites at a scale which makes it feasible and economical for geophysicists and geologists to have a starting point in exploring for geothermal energy. In so doing, this study devised an economical method of mapping potential geothermal sites using the freely available gravity data by assessing the accuracy of the gravity data using mean sea level elevations, mapping gravity disturbances and relating them to thermal imagery, geological and land use maps to produce potential geothermal site maps at feasible and economical scale. This study found that the use of hot springs as an indication of potential geothermal sites was not accurate and definitely not a right basis for investigating geothermal resources. Potential geothermal sites were found to lie within the rift valley where temperature are high and where the earth’s crust density is low in addition to faulting.
According to 1, climate change is a global phenomenon which threatens humanity in a variety of ways and most developing countries, have not been spared from the effects of climate change 2, especially in the energy sector. A 2010 World Bank assessment of hydropower in Southern Africa, including Zambia, simulated a reduction in annual average energy production of 21 per cent.
Reservoir levels behind the hydroelectric generation dams are expected to decrease on an annual basis as a result of frequent and prolonged drought conditions. This combined with increased surface water evaporation, especially from upstream reservoirs and floodplains could result in reduced energy generation capacity throughout the region 4 thereby reducing hydroelectricity production and supply creating an energy deficit 5. This has led Zambia and the region experiencing massive electricity load shedding because of heavy dependence on hydroelectricity. Yet the demand for electric energy is increasing 6. This has caused people to resort to other sources of energy such as firewood and charcoal which pose many environmental challenges such as deforestation which further worsens the devastating effects of climate change.
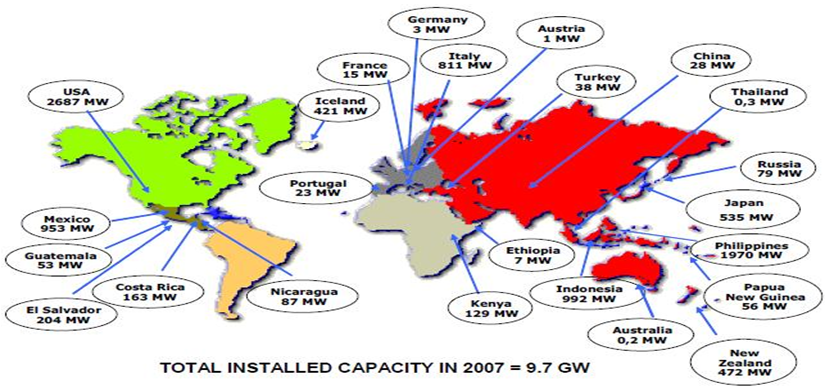
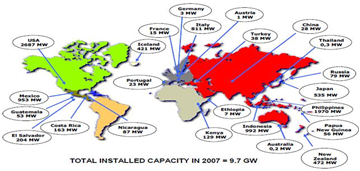
One alternative source of energy which has received very little attention is geothermal energy. Figure 1 shows the total installed geothermal energy in the world in 2007 7 and we can clearly see from the figure that only Ethiopia and Kenya have harnessed geothermal energy in Arica although the first plant was done in 1953 in the Democratic Republic of Congo. Globally installed electricity generation capacity from geothermal energy has grown at a rate of 3.5% per annum to about 15,96GWe in 2021 8.
Geothermal energy is heat deposited in the rock and fluid filling the pores as well as fissures of the Earth's crust. Geothermal energy is currently believed to be one of the most advantageous sources of clean and renewable energy. The current methods being employed to search for Potential Geothermal Sites (PGS) require investigation of underlying geology to greater depths through drilling 9. Drilling during initial stages of exploration makes geothermal energy an expensive resource to tap into, with price tags ranging from around $2-$7 million for a 1 megawatt plant 10, 11. The total cost of geo-scientific exploration is only a part of the cost which is required up-front prior to exploration drilling. Therefore exploration methods must be professionally selected to minimize the cost of exploration.
According to 12 geophysical measurements for geothermal mining involve measuring high temperature, high porosity, high permeability and chemical composition of the geothermal fluid in order to locate explorable reserves and site drill-holes through which hot fluids can be detected. 13, 14, also report the various geophysical methods used in geothermal exploration as thermal, electrical, gravity, magnetic and seismic methods.
This study therefore used the indirect scientific investigation of the deeper earth mass (ranging from 900m to 1300m below the earth's surface) without the need for drilling first 15. This automatically reduced the cost of developing geothermal energy whose cost is hugely in the exploration stage. This indirect method is based on the well-known scientific fact that the earth's gravity field is directly proportional to the density of sub surface geology (Heiskanen and Moritz, 1987).
1.1. Problem StatementThe problem that this research dealt with was the lack of geothermal potential sites that were accurately mapped at a scale which was both feasible and economical for geophysicists, geologists and other allied professionals to carry out resource identification, quantification and development of the geothermal energy. The biggest challenge in enhancing geothermal energy lies in the methods of first accurately identifying where the resource lies – narrowing down the search grid to a manageable level 8.
1.2. Study ObjectivesThe main objective of the study was to assess Potential Geothermal Sites (PGS) in Zambia using gravimetric methods based on the data that was obtained through remote sensing techniques by the Global Monitoring of Environmental and Security (GMES) project. The study area is Zambia in Africa.
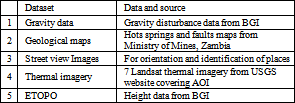
1.3. Data CollectionVarious datasets were collected from different sources as tabulated in Table 1. Gravity and ETOPO1 data were obtained from the International Gravimetric Bureau (BGI). This data was used to plot a gravity disturbance map. Geological maps of springs and faults were obtained from the Ministry of Mines in Zambia. This data was used to determine whether springs and faults directly coincide with the identified potential geothermal sites. Thermal imagery was obtained from the USGS website. It is from Landsat 7 platform. Streetview images were used for orientation and identification of places.
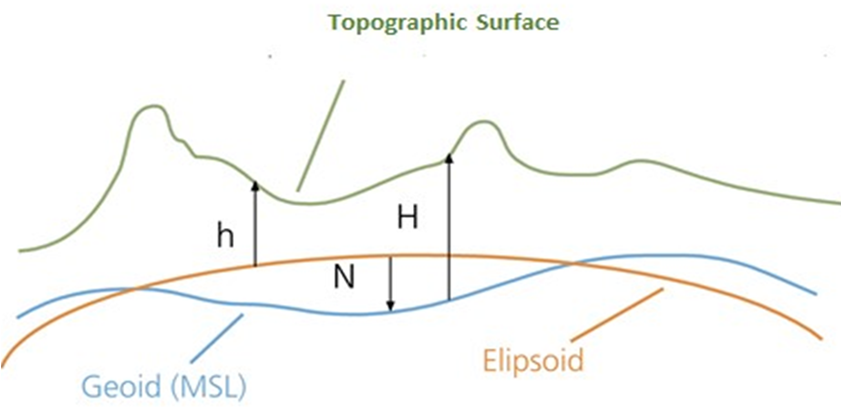
Geodesy makes it possibility to define the three geodetic references namely topographic, ellipsoid and Geoid as in (Figure 2) 16. This definition of the three geodetic reference surfaces enabled the obtaining of the gravity field only attributable to the subsurface, which is about 900m to 1300m below the earth's surface.

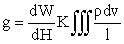
This method is fundamentally based on the relationship that exists between the gravity potential and the density of the underlying geology. The relationship between gravity and underlying geology is that, the lower the gravity the thinner the crust is and the higher the potential of the heat underneath the surface of the earth to want to escape at that point, hence bringing the magma near to the surface of the earth. This in turn becomes a potential geothermal site.
This relationship is expressed in equation 1 (Heiskanen and Moritz, 1987):
 | (1) |
The potential of gravity, W= gravitational potential + centrifugal potential
Triple Integral means total volume of attracting mass
𝝆 = density
𝒈 = gravity
𝒍 = distance between attracting mass and attracted mass
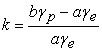
Where
 | (2) |
 = 𝑔𝑟𝑎𝑣𝑖𝑡𝑦 𝑎𝑡 𝑡ℎ𝑒 𝑝𝑜𝑙𝑒
 = 𝑔𝑟𝑎𝑣𝑖𝑡𝑦 𝑎𝑡 𝑡ℎ𝑒 𝑒𝑞𝑢𝑎𝑡𝑜𝑟
𝒂 = 𝑒𝑎𝑟𝑡ℎ 𝑒𝑞𝑢𝑎𝑡𝑜𝑟𝑖𝑎𝑙 𝑟𝑎𝑑𝑖𝑢𝑠, 𝑠𝑒𝑚𝑖−𝑚𝑎𝑗𝑜𝑟 𝑎𝑥𝑖𝑠 𝑜𝑓 𝑡ℎ𝑒 𝑒𝑙𝑙𝑖𝑝𝑠𝑜𝑖𝑑
𝒃 = 𝑝𝑜𝑙𝑎𝑟 𝑟𝑎𝑑𝑖𝑢𝑠, 𝑠𝑒𝑚𝑖−𝑚𝑖𝑛𝑜𝑟 𝑎𝑥𝑖𝑠 𝑜𝑓 𝑡ℎ𝑒 𝑒𝑙𝑙𝑖𝑝𝑠𝑜𝑖𝑑
𝒆 = 𝑓𝑖𝑟𝑠𝑡 𝑒𝑐𝑐𝑒𝑛𝑡𝑟𝑖𝑐𝑖𝑡𝑦
The variations are indicative of the variations in the underlying geology. These variations are called Gravity Disturbances,  (source)
 | (3) |
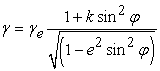
 is computed using Somigliana formula (Equation 4) which defines the ellipsoid surface. (Heiskanen and Moritz, 1987)
 | (4) |
Where, 𝝋 = 𝑔𝑒𝑜𝑑𝑒𝑡𝑖𝑐 (𝑒𝑙𝑙𝑖𝑝𝑠𝑜𝑖𝑑𝑎𝑙) 𝑙𝑎𝑡𝑖𝑡𝑢𝑑𝑒.
The variations in gravity come about because of the lateral changes of the density of subsurface rocks in the vicinity of the measuring points. This method is used to detect geological formations that have different densities.
The gravity data that was used in this research was validated based on the gravity control points within the study area as shown in (Table 3). These gravity control points are available on the BGI website and were used to validate the BGI gravity data through comparison of the points’ elevations and those of the ETOPO1 data set. The comparison was then extended to points with unknown gravity values and the average height difference was found to be hovering around -2m. Assessing the accuracy of the gravity data, using the Global Navigation Satellite System (GNSS) leveling on known gravity points, was absolutely necessary to boost the confidence in this data 18, 19.
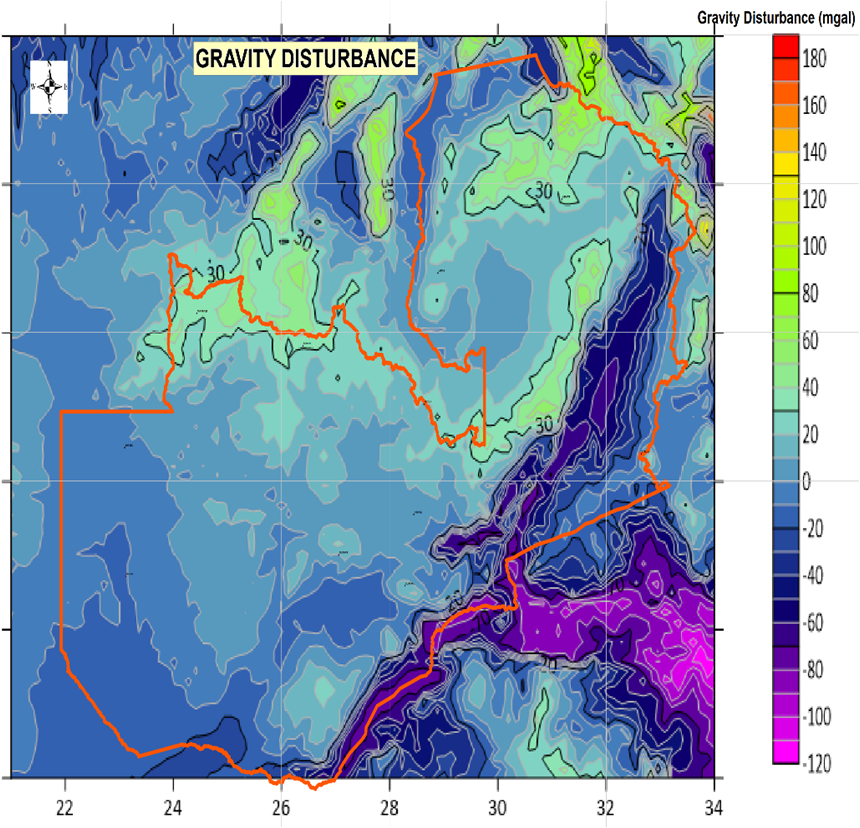
The validated data was then used to derive a gravity disturbance map and the lowest of the gravity disturbance values run along the Great Rift Valley in the southern, central and eastern parts of Zambia.
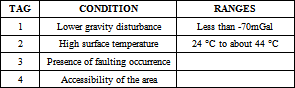
The Landsat 7 thermal images were used to ultimately estimate the land surface temperatures using GIS from which hot surfaces ranging from about 24° Celsius to 44° Celsius were digitised. Thereafter, springs, faults map and land surface temperature map were superimposed on the gravity disturbance map from which areas that met the criteria in (Table 2) were delineated as potential geothermal sites.
Comparison of known and measured data for the used gravity points gave an average of -1.954667m on the three known points giving an average gravity difference of 4.3333nGal (0.000004mGal) despite not taking into account the undulation. This was within the NOAA estimates of the ETOPO1 vertical accuracy of 10m. (Table 3) shows the known and measured parameters of the comparison points. The 3 gravity points depicted in (Table 3) are all within Lusaka and have known gravity and ETOPO1 data and can be found on the BGI website as well.
The validated gravimetric disturbance data was used to create a gravity disturbance map (Figure 3) using kriging interpolation method because of its use of spatial correlation between sample points to interpolate intermediate values using spatial arrangement of empirical observations. (Figure 3) shows that the gravity disturbance is ranging from -120mGal – 180mGal. According to (Table 2) criteria, potential geothermal sites are likely to occur in areas that have gravity disturbance of below -70mGal.

Figure 3 was then used to extract areas which had low gravity disturbance (below -70mGal) which is one of the parameters (Table 2) for determining potential geothermal sites. Such areas were found to be mostly along the rift valleys of Luangwa and Zambezi. The Gravity Disturbance Map can also be used for mineral exploration by relating it earth’s internal material density variations 20.
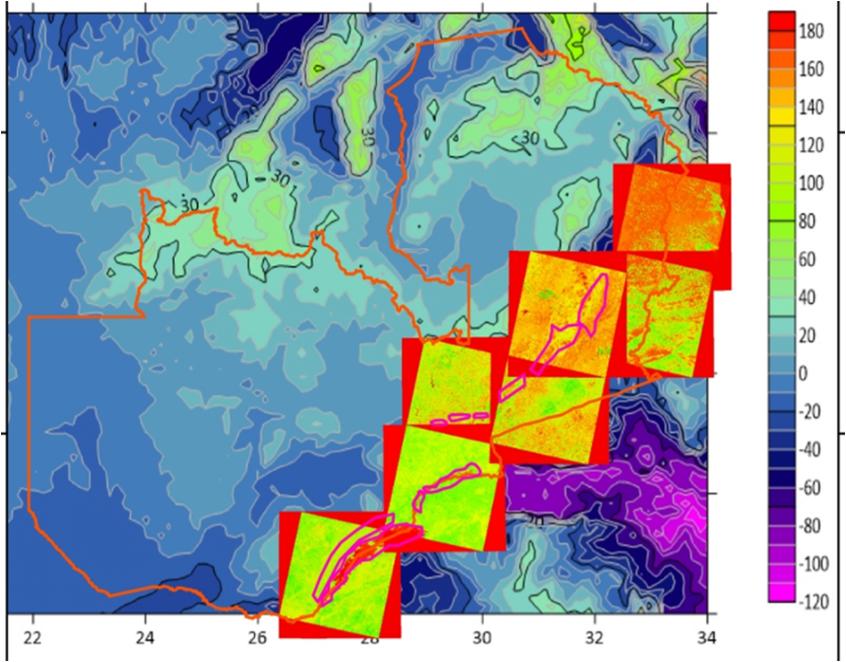
Landsat 7 thermal band images were processed and classified in order to create emissivity rasters that were used to estimate land surface temperatures for the target areas that according to (Table 2) must have temperatures above 24° Celsius. Emissivity rasters as in (Figure 4) were arrived at using equation 5 (Heiskanen and Moritz, 1987).
 | (5) |
Where,
s = Boltzmann constant = 1.38∗10−23J
λ = wavelength of emitted radiance
c2=h∗c/s=1.4388∗10−2 m K = 14388 µm K
The emissivity raters were then superimposed on the gravity disturbance map as shown in Figure 4.

Conditions for a potential geothermal site, as set out in (Table 2) 22, 23, were then applied to (Figure 4) in conjunction with the faults map to derive sites with high potential for geothermal reserves exploration.
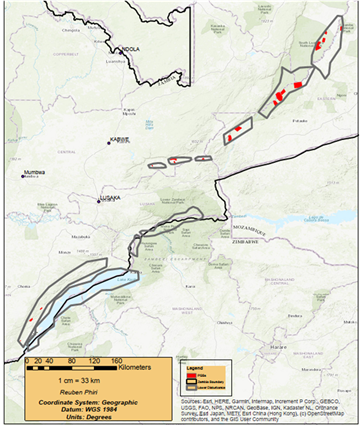
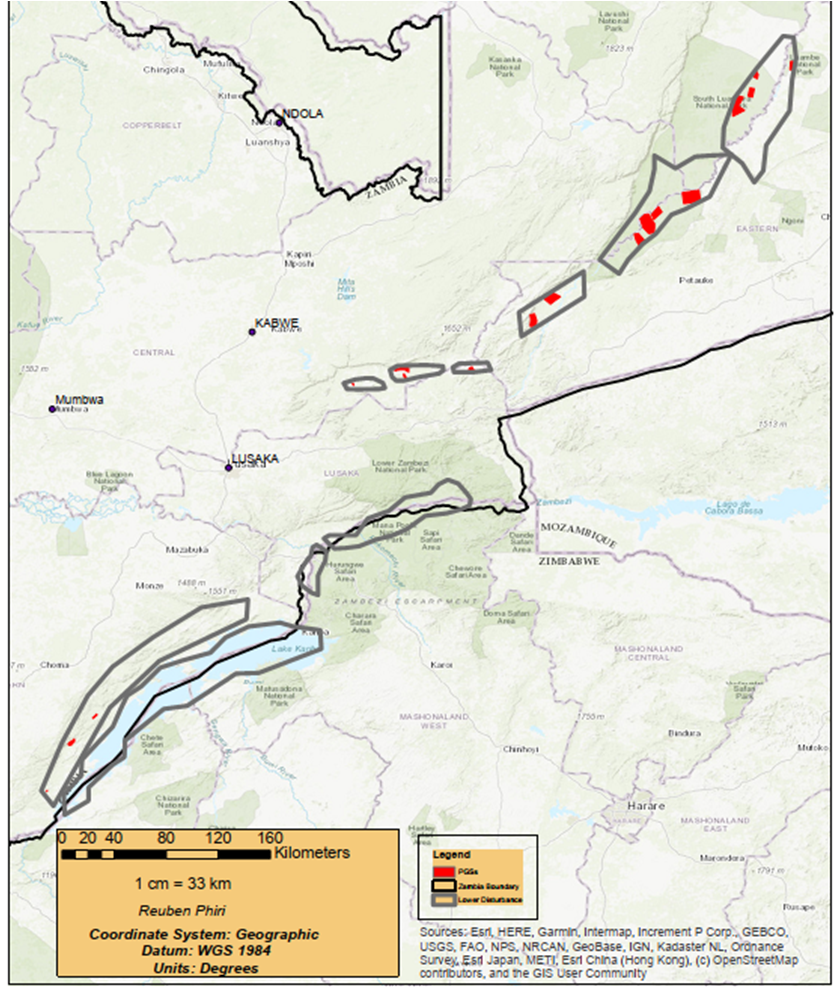
Figure 5 shows that potential geothermal sites fall within the rift valley areas of Luangwa and Zambezi valleys which are regions of lower gravity disturbance and high temperatures. This agrees with findings of 23 since rift valleys were formed by subterranean forces that tore apart the earth’s crust between fault lines which force up molten rock in volcanic eruptions. Moreover, the identified sites coincide well with physical phenomena such as the presence of coal in the Zambezi Valley where some of the potential sites fall. This physical occurrence of coal (which is associated with high temperature) attests to the accuracy of using the Gravity Method to establish potential geothermal sites.
It is concluded that Potential Geothermal Sites (PGS) as shown in Figure 5 can be identified using gravimetric methods based on the gravity data. The study found that regions of lower gravity disturbance and high temperature occur along the southern and eastern parts of Zambia along the Great Rift Valley.
It was also found that hot springs are not a good indicator of the geothermal resource except when used in conjunction with the geological faulting.
The gravity method is an accurate method of preliminary exploration for geothermal resources as it narrows down the search areas thereby saving huge amounts of resources which in turn makes it possible for geothermal resources to be harnessed at lower than present cost.
| [1] | Blewitt, J (2008), Understanding Sustainable Development. London: Earthscan | ||
| In article | |||
| [2] | United Nations Development Programme (UNDP, 2019) Progress Report on Sustainable Development Goals. Lusaka: UNDP. | ||
| In article | |||
| [3] | World Bank, (2010), Development and Climate Change. Washington: World Bank Group | ||
| In article | |||
| [4] | Gannon, JP Christa Kelleher, C and Zimmer, M (2014). Controls on Watershed Flashiness Across the Continental US, Journal of Hydrology, Volume 609, 127713, ISSN (https://www.sciencedirect.com/science/article/pii/S0022169422002888). | ||
| In article | View Article | ||
| [5] | Zambia Development Agency (ZDA, 2020). Annual Report. Lusaka: ZDA. | ||
| In article | |||
| [6] | ZESCO (2020). Report on Power Generation and Distribution. Lusaka: ZESCO. | ||
| In article | |||
| [7] | ISOR Iceland Georsurvey (2009), Geological Maps. https://en.isor.is/. | ||
| In article | |||
| [8] | IRENA, 2023, Global Geothermal Market and Technology Assessment, https://www.irena.org/2023/Feb/ accessed 03.04.2023 | ||
| In article | |||
| [9] | ESI-Africa (2019) Geothermal, Hydropower and MiniGrids in East Africa. ESI- Africa Issue No. 3 esi- africa 2019 geodesy - Google Search. | ||
| In article | |||
| [10] | GreenMatch (2014) Geothermal Energy Exploration. A Survey. Journal of Geological Studies Vol. 3 pp. 23-45. | ||
| In article | |||
| [11] | Olafur, T. D (2009). Cost Effective Geothermal Exploration. London: Earthscan. | ||
| In article | |||
| [12] | Mariita, N.O (2010) Strengths and Weaknesses of Gravity and Magnetics as Exploration Tools for Geothermal Energy. Presented at short Course V on exploration for geothermal resources. Naivasha, Kenya: UNU-GTP, KenGen, GDC; 2010. | ||
| In article | |||
| [13] | Aretouyap et al (2016). Aquifers Productivity in the Pan African Context. J. Earth Syst. Sci. (2016). | ||
| In article | |||
| [14] | Domra Kana, J; Djongyang; Danwe, R; Njandjock Nouck P; Abdouramani D (2015). A Review of Geophysical Methods for Geothermal Exploration. Renewable and Sustainable Energy Review. | ||
| In article | View Article | ||
| [15] | Macharia, W.M; Gachari, M.K; Guria, D.N and Marita, N.O (2017). Low Cost Geothermal Energy Indicators and Explorations Methods in Kenya. Nyeri: Dedan Kimathi University of Technology. | ||
| In article | |||
| [16] | Knippers, R.A (2009) Principles of Map Projections, Lecture Notes, International Institute of Aerospace Survey and Earth Sciences, Enschede, ITC. | ||
| In article | |||
| [17] | United States Geological Survey (2010). Remote Sensing and Its Use. New York: USGS. | ||
| In article | |||
| [18] | Saka, S., 2019, Determination of an Improved Geoid over Zambia, MEng Thesis, Department of Geomatic Engineering, University of Zambia, Lusaka, Zambia. | ||
| In article | |||
| [19] | Mwanza, A. R., Nyirenda, E. and Nchito, S., 2019, Determining the Surface Water Exchange between the Kafue River and Lukanga Swamps in the Central Province of Zambia, Journal of Geosciences and Geomatics, Vol. 7, No. 3, 145-156. | ||
| In article | |||
| [20] | Chipanta N. M., Mwanza, A, R., Lubilo, F., M’sendo, R., Nyimbili, P. H. and Erden, T., 2023, Zambia (ICT) Journal, Volume 7 (Issue 1). | ||
| In article | View Article | ||
| [21] | Godwin, M.M (2007). Geothermal Mapping Using Temperature Measurements. Kenya: KenGen. | ||
| In article | |||
| [22] | Radinal, J (2015). Application of Gravity Methods for Predicting Geothermal Prospects. Kuningan. | ||
| In article | |||
| [23] | Chris, T. F (2015). An Investigative Approach to Understanding the Rift Valley Geodesy. New York: Cengage Learning. | ||
| In article | |||
Published with license by Science and Education Publishing, Copyright © 2023 Reuben Phiri, Wallace Mukupa, Foster Lubilo and Alick R. Mwanza
 This work is licensed under a Creative Commons Attribution 4.0 International License. To view a copy of this license, visit
http://creativecommons.org/licenses/by/4.0/
This work is licensed under a Creative Commons Attribution 4.0 International License. To view a copy of this license, visit
http://creativecommons.org/licenses/by/4.0/
| [1] | Blewitt, J (2008), Understanding Sustainable Development. London: Earthscan | ||
| In article | |||
| [2] | United Nations Development Programme (UNDP, 2019) Progress Report on Sustainable Development Goals. Lusaka: UNDP. | ||
| In article | |||
| [3] | World Bank, (2010), Development and Climate Change. Washington: World Bank Group | ||
| In article | |||
| [4] | Gannon, JP Christa Kelleher, C and Zimmer, M (2014). Controls on Watershed Flashiness Across the Continental US, Journal of Hydrology, Volume 609, 127713, ISSN (https://www.sciencedirect.com/science/article/pii/S0022169422002888). | ||
| In article | View Article | ||
| [5] | Zambia Development Agency (ZDA, 2020). Annual Report. Lusaka: ZDA. | ||
| In article | |||
| [6] | ZESCO (2020). Report on Power Generation and Distribution. Lusaka: ZESCO. | ||
| In article | |||
| [7] | ISOR Iceland Georsurvey (2009), Geological Maps. https://en.isor.is/. | ||
| In article | |||
| [8] | IRENA, 2023, Global Geothermal Market and Technology Assessment, https://www.irena.org/2023/Feb/ accessed 03.04.2023 | ||
| In article | |||
| [9] | ESI-Africa (2019) Geothermal, Hydropower and MiniGrids in East Africa. ESI- Africa Issue No. 3 esi- africa 2019 geodesy - Google Search. | ||
| In article | |||
| [10] | GreenMatch (2014) Geothermal Energy Exploration. A Survey. Journal of Geological Studies Vol. 3 pp. 23-45. | ||
| In article | |||
| [11] | Olafur, T. D (2009). Cost Effective Geothermal Exploration. London: Earthscan. | ||
| In article | |||
| [12] | Mariita, N.O (2010) Strengths and Weaknesses of Gravity and Magnetics as Exploration Tools for Geothermal Energy. Presented at short Course V on exploration for geothermal resources. Naivasha, Kenya: UNU-GTP, KenGen, GDC; 2010. | ||
| In article | |||
| [13] | Aretouyap et al (2016). Aquifers Productivity in the Pan African Context. J. Earth Syst. Sci. (2016). | ||
| In article | |||
| [14] | Domra Kana, J; Djongyang; Danwe, R; Njandjock Nouck P; Abdouramani D (2015). A Review of Geophysical Methods for Geothermal Exploration. Renewable and Sustainable Energy Review. | ||
| In article | View Article | ||
| [15] | Macharia, W.M; Gachari, M.K; Guria, D.N and Marita, N.O (2017). Low Cost Geothermal Energy Indicators and Explorations Methods in Kenya. Nyeri: Dedan Kimathi University of Technology. | ||
| In article | |||
| [16] | Knippers, R.A (2009) Principles of Map Projections, Lecture Notes, International Institute of Aerospace Survey and Earth Sciences, Enschede, ITC. | ||
| In article | |||
| [17] | United States Geological Survey (2010). Remote Sensing and Its Use. New York: USGS. | ||
| In article | |||
| [18] | Saka, S., 2019, Determination of an Improved Geoid over Zambia, MEng Thesis, Department of Geomatic Engineering, University of Zambia, Lusaka, Zambia. | ||
| In article | |||
| [19] | Mwanza, A. R., Nyirenda, E. and Nchito, S., 2019, Determining the Surface Water Exchange between the Kafue River and Lukanga Swamps in the Central Province of Zambia, Journal of Geosciences and Geomatics, Vol. 7, No. 3, 145-156. | ||
| In article | |||
| [20] | Chipanta N. M., Mwanza, A, R., Lubilo, F., M’sendo, R., Nyimbili, P. H. and Erden, T., 2023, Zambia (ICT) Journal, Volume 7 (Issue 1). | ||
| In article | View Article | ||
| [21] | Godwin, M.M (2007). Geothermal Mapping Using Temperature Measurements. Kenya: KenGen. | ||
| In article | |||
| [22] | Radinal, J (2015). Application of Gravity Methods for Predicting Geothermal Prospects. Kuningan. | ||
| In article | |||
| [23] | Chris, T. F (2015). An Investigative Approach to Understanding the Rift Valley Geodesy. New York: Cengage Learning. | ||
| In article | |||