The USDA’s definition of food deserts, which is based on the distance to store and a neighborhood’s income, seems to be inadequate to explain the food security status of a neighborhood. Thus, an exploratory factor analysis (EFA) was conducted to explore the underlying structures behind the 11 measures of a neighborhood's characteristics, which, in turn, describes a neighborhood's food insecurity. The studied neighborhoods were the census tracts in the lower 48 states of the U.S. The EFA systematically grouped the 11 characteristics into two factors (i.e., socioeconomic and demographic) determining neighborhood vulnerability. Both factors suggest that the neighborhoods in the South have a high vulnerability that could influence the number and type of food stores or prospects of new food stores in those neighborhoods. Based on the factor structure revealed by the EFA, the Neighborhood Food Insecurity Index (NFII) was created. The NFII measures the relative food vulnerability of every U.S. census tract affecting its residents' ability to access a healthy food provider. The index indicates that about 43 million (13.14%) people in the U.S. live in neighborhoods with high food vulnerability. The index also shows that regionally, the South had the greatest percentage of populations living in high food-vulnerable neighborhoods followed by the West, Midwest, and Northeast regions.
According to the United States Department of Agriculture (USDA), low-income neighborhoods with limited access to healthy food providers are food deserts 1, 2 where access to food is mainly estimated by distance to a supermarket. The USDA defines a low supermarket access neighborhood as a census tract where "at least 500 people and/or at least 33 percent of the population reside more than one mile from a supermarket or large grocery store (for rural census tracts, the distance is more than 10 miles)." Further, households that are unable to afford nutritionally adequate and safe foods for all their members at times during the year are termed food insecure households 3. In 2019, over 13.7 million U.S. households were food insecure at some point 3.
The food desert concept, which was developed based on income and access to supermarkets, seems to be limited and incomplete. Research has shown that the focus on a neighborhood’s income overestimates the food access problem in low-income neighborhoods 4, 5. Moreover, Wilde et al., 6 and Jiao et al., 7 discovered that low-income neighborhoods were, on average, closer to supermarkets. Assuming that everyone in a neighborhood has the same access to healthy food underestimates some individuals’ barriers in accessing healthy food 8. Further, Dutko et al., 2 found that food deserts, in addition to having higher poverty rates and lower income, also have smaller populations, higher unemployment rates, higher rates of abandoned or vacant homes, higher concentrations of minority populations, a higher proportion of population relying on public assistance, and lower educational attainment relative to other tracts. Similarly, previous studies 9, 10, 11, 12, 13 have reaffirmed that neighborhoods with lower socioeconomic status lack access to healthy food providers.
The most detrimental consequence of limited access to nutritionally adequate food is the poor physical and mental development of neighborhood residents. That, in turn, increases the risk of obesity, depression, and cardiovascular diseases that handicap the minds and bodies of children and adults 14, 15, 16. Also, limited access to nutritionally adequate food significantly influences the available pool of human capital needed to develop a nation. Thus, several studies have monitored various aspects (such as food retailer densities, built-in environment, households, and neighborhood characteristics) that affect food accessibility and food insecurity 1, 3, 17, 18, 10, 19, 20, 21. The present study, likewise, seeks to describe a relationship among demographic and socioeconomic characteristics of U.S. neighborhoods influencing food security using exploratory factor analysis (EFA).
Exploratory factor analysis describes the relationships among neighborhood characteristics in terms of a few underlying latent constructs or structures that were not previously assumed. The identified underlying latent constructs might provide new perspectives that, in turn, facilitate a precise definition of neighborhood food insecurity. In particular, the main objectives of this study are (a) to identify various dimensions of a neighborhood’s characteristics, (b) to analyze how each dimension describes important social phenomena or constructs that can be linked to a food insecure neighborhood, and (c) to develop a Neighborhood Food Insecurity Index (NFII) using those dimensions that quantify the neighborhood’s vulnerability concerning food insecurity. To this end, the present paper draws on empirical data along with research on the neighborhood characteristics that have produced disparities in access to healthy food providers.
There is substantial literature on neighborhood characteristics, such as population density, income, poverty, race, and education, considered as determinants of food retailer density in a neighborhood. Bower et al., 22 and Dutko et al., 2 discovered that neighborhoods having higher poverty rates had fewer supermarkets, regardless of the neighborhood’s racial or ethnic composition, and were more likely to be food deserts than low-income census tracts in very densely populated urban areas. Black neighborhoods having comparable poverty rates with those neighborhoods dominated by other races were more likely to have fewer supermarkets 22, 23. Further, Dutko et al., 2 discovered that census tracts that experienced a substantial decrease in minority populations between 1990 and 2000 were less likely to be identified as food deserts in 2000. Also, studies by Colón-Ramos et al., 24, Walker et al., 12, Moore et al., 25, Franco et al., 26, and Morland et al., 27 concluded that predominantly minority and lower-income neighborhoods had less access to healthy food providers than white and higher-income neighborhoods. Moreover, Filomena et al., 28 claimed that the brick-and-mortar stores in low-income and minority neighborhoods were more likely to go out of business within five years of their establishment as compared to those in high-income and predominantly white neighborhoods. Similarly, researchers like Wilcox et al., 29, Rodriguez & Grahame, 30, and Dutko et al., 2 who examined the association of neighborhood socioeconomic characteristics with diet quality, found lower-quality diet intake among residents with lower education.
Studies have also shown that single-parent families are economically disadvantaged compared to two-parent households 31, 32. Families living in poverty and single-parent households have often participated in some form of nutrition assistance program 31, 32. Further, research conducted by Racine et al., 33 in North Carolina found that many households in the neighborhoods with a high concentration of Supplemental Nutrition Assistance Program (SNAP) participation belonged to a minority community and did not own a vehicle. They also discovered that neighborhoods where higher proportions of SNAP participants live had zero full-variety stores, four limited stores in urban areas, three full-variety stores and 17 limited-variety stores in rural areas. Similarly, Baltimore SNAP users, particularly mothers living in poverty, had trouble applying for and maintaining SNAP benefits due to poor services and even reported the continued experiences of food insecurity 34. Although low-income individuals or households are eligible for food stamps, a survey of 1,000 low-income residents conducted by Cohen, 35 identified that limited English proficiency was one of the hurdles for SNAP participation by eligible foreign-born residents living in the Brooklyn neighborhoods of Sunset Park and Windsor Terrace.
The USDA has considered the proximity to food retailers in terms of distance as a rationale to classify low-income neighborhoods as food deserts. Many researchers like Rodriguez & Grahame, 30, Jiao et al., 7, Walker et al., 12, and Laska et al., 36 have confirmed the interrelationship between food availability and intake at home, in terms of quality and quantity, and physical access to supermarkets. These studies also found that in neighborhoods where there were no supermarkets, people relied on local convenience stores where the food prices were higher, and the availability of healthy foods was limited. Additionally, the neighborhoods that lack supermarkets or access to healthy foods generally have an enormous number of fast-food restaurants, which are cheap sources of less healthy and energy-dense food 37, 38, 39.
However, Joassart-Marcelli et al., 4 and Taylor & Ard, 5 argued that the adaptation of the traditional approach of lack of access or just considerations of only supermarkets have portrayed entire low-income minority neighborhoods (like African-American communities in Detroit and minority communities in San Diego) as food deserts, ignoring the role of ethnic markets and various strategies adopted by the people, such as community gardening and fruit and vegetable stands, to cope with food insecurity. Besides, many studies have highlighted the fact that an individual’s access to a vehicle is more important than proximity to stores. The SNAP recipients of Philadelphia and residents of the Twin cities often traveled outside their neighborhood for food shopping where more variety and healthier options were available 19. Similarly, negative food shopping experiences (e.g., poor customer service, unappealing appearance of food, hostile behavior of shop owners or employees, and a store’s physical premises) have discouraged residents of low-income minority neighborhoods to shop in their neighborhoods 19, 40. Additionally, Cannuscio et al., 41 and Ghosh-Dastidar et al., 42 found that the introduction of a supermarket in a neighborhood did not reduce the distance traveled to regular places by individuals for food shopping. Wright et al., 43 unearthed that owning a vehicle is more important than access to a full-service restaurant in a neighborhood.
It’s not only that consumers avoid the shops with certain characteristics; retailers are also found to be less responsive to the needs of people of certain neighborhoods such as stigmatized or minority neighborhoods or neighborhoods with concentrated poverty 44. This discriminatory practice is known as supermarket redlining and was formally defined by D’Rozario & Williams, 45 as a spatially discriminatory practice in which retailers deliberately choose not to serve certain areas based on their ethnic-minority composition. The most prominent instances of supermarket redlining include the closing of more than 600 stores of the Safeway supermarket chain in the country from 1978 to 1984 46 and the shutdown of 11 out of 13 chain supermarkets in Hartford, Connecticut, in the same period 47, 48. However, Bonanno, 49 argued that the emergence of food deserts could be better understood if various factors that affect the retailer's decision to locate stores are acknowledged. Generally, any retailer's decision to establish a store in a location is dependent on profitability. Benefit or profit from the store is dependent on market size, population and income growth, the neighborhood's socioeconomic status, and its residents' preferences for shops or foods.
To summarize, the above studies suggest that neighborhood vulnerability with respect to the number of and access to healthy food providers depends on its demography and socioeconomic characteristics. Generally, demographics and socioeconomic characteristics of a neighborhood are highly correlated. Hence, it is possible to group these variables based on their correlation or covariance structure. Each group of variables thus categorized, using the exploratory factor analysis (EFA), represents a single underlying construct that is responsible for the observed correlation 50. Unlike the USDA’s two measures (accessibility and income), the identified underlying construct using the EFA are the accounts of multiple measures or characteristics of neighborhoods needed to understand the food access problem.
To fulfill this study’s objectives, the exploratory factor analysis was performed on 11 socioeconomic and demographic variables which represent the typical neighborhood characteristics determining grocer density in an area and its residents’ access to food stores. A neighborhood in this study is equivalent to a U.S. census tract. Eleven variables, as a measure of the census tracts characteristics, were extracted from the 5-year American Community Survey (ACS) estimates from 2014-2018. The dataset includes 72,347 census tracts in the lower 48 states of the U.S., including the District of Columbia. A list of these 11 variables is given below:
• Percent of the population aged 25 years and older who have not completed a high school diploma.
• Percent of single parent households with children under 18 years old.
• Percent of minorities except the white non-Hispanic population.
• Percent of civilians aged 16 and older who are unemployed.
• Percent of households receiving food stamps.
• Percent of population below poverty.
• Percent of vacant units.
• Percent of population aged 5 years and above who speak English less than well.
• Percent of housing units with no vehicle.
• Natural log of median income.
• Natural log of population density.
The 5-year ACS estimates is the only data source, after the decennial census, that provides the data of smaller geographies such as tracts and block groups. Further, the estimates are provided with a margin of error (MOE) at the 90% confidence interval and are claimed to be more reliable and precise as compared to the 1- and 3-year ACS estimates databases 51.
The exploratory factor analysis was conducted using SAS 9.4 software. The factor model proposes that  a random vector consisting of
  variables, is linearly dependent upon a few unobservable random variables
 and
and  additional sources of variations (
 ) called specific factors or errors 50. In this sense, the factor analysis model, in the matrix notation, is represented as:
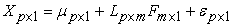 | (1) |
where the coefficient  is the matrix of coefficients often known as factor loading, and the observed random vector
  has mean
  and covariance matrix
This study used the unweighted least square method (ULS) to estimate factor loadings, communalities, and specific variances. The ULS method minimizes the sum of the squared differences between the observed and estimated correlation (or covariance) matrices 52. The original loadings were rotated using an oblique rotation method called Promax until a simpler structure was achieved.
To find whether any spatial pattern exists, we first computed by linearly combining the percentile ranking of each variable that highly load onto each factor. The formula to calculate the percentile ranking (R) is:
 | (2) |
where N is the total number of observations. We summarize each factor as a linear combination of the percentile ranking of variables that load highly onto it as follows:
 | (3) |
where  represents kth factor and
  are variables that highly load onto kth factor.
Next, we created a Neighborhood Food Insecurity Index (NFII). NFII measures the relative food vulnerability of every U.S. census tract affecting its residents' ability to access a healthy food provider. For calculating this index, this study adopted the approach taken by the Center for Disease Control (CDC) to compute the Social Vulnerability Index (SVI). The CDC's SVI measures the community's vulnerability based on 15 social characteristics that determine its capability to prevent and cope with hazardous events such as a chemical spill, a natural disaster, or a disease outbreak 53. To create scores for SVI, the CDC, 54 first ordered the 15 variables based on percentile ranking. Second, the rankings of 15 variables were summed, and finally, the summed values were again ordered based on the percentile ranking. Similarly, we computed the NFII's scores in the following ways:
(a) First, the percentile rankings of all variables used in this study were computed.
(b) Then, the percentile ranks of variables were linearly combined based on the structure revealed by EFA analysis.
(c) The linearly combined values were again ranked, and these ranks represented the scores for NFII. In other words, each census tract received a ranking for linearly combined neighborhood (i.e., census tract) variables.
The scores for NFII range from 0 to 1. The higher the values of the index the more vulnerable the neighborhoods.
This section is divided into the following subsections: (a) Preliminary Diagnostics, (b) Factor Extraction Criteria, (c) Bootstrap Resampling and Statistics from Factor Analysis, and (d) Neighborhood Food Insecurity Index.
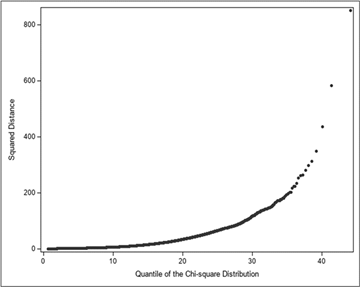
4.1. Preliminary DiagnosticsFirst, we assessed the assumption of normality for all distribution of 11 variables. To evaluate multivariate normality, we plotted the squared distance among the variables against the chi-square quantile as shown in Figure 1. The points on the chi-square plot do not conform to the expected straight-line pattern, suggesting non-normal data 50. Unlike the maximum likelihood model, the ULS factor extraction method is not sensitive to skewed or non-normal data 55 and yields consistent estimate 56. The three observations at the upper right end seem to be outliers and were thus removed from the dataset.
In EFA, matrix of associations (either a correlation or a covariance matrix) is the basic unit of analysis 57. In this study, the basic unit of analysis is the correlation matrix of 11 variables selected as a measure of neighborhood characteristics. The Pearson’s correlation coefficients for each pair of variables are given in Table 1.
Out of 55 pairs of variables, the correlation coefficients of 35 pairs of variables have absolute values greater than 0.3, indicating a favorable correlation matrix for factor analysis. The correlation matrix indicates a strong correlation among the variables of median income, population under poverty, and households receiving food stamps. Civilian unemployed is moderately positively correlated with the population with no high school diploma, single-parent household, minority population, households with no vehicle, and households receiving food stamps while negatively correlated with median income. There is a moderately positive correlation among population density, population with limited English, and minorities. Vacant units have a lower correlation with all variables except median income and population density. The coefficients are significant at a 5% level of significance.
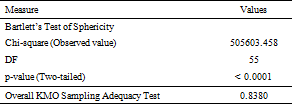
As some of the correlation coefficients are so small, Bartlett’s Sphericity Test was conducted to ensure that the variables could be summarized with a few numbers of factors. The result of Bartlett’s Sphericity Test for the final 11 variables is shown in Table 2. As the computed p-value is lower than the significance level alpha (0.05), the null hypothesis (H0) that the correlation matrix is an identity matrix is rejected. Bartlett’s Sphericity Test implies that we can summarize the variables with at least one common factor. This is further supported by the value of the Kaiser-Meyer-Olkin (KMO) measure of sampling adequacy, given in Table 2. The overall KMO value of 0.8380 indicates that the proportion of variance in these variables are the results of underlying constructs, thereby indicating the data is well suited for factor analysis 58.
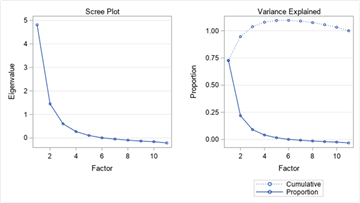
After the preliminary diagnostic suggested that data was well suited for factor analysis, the Kaiser criterion was used to decide the number of factors to retain. As per the Kaiser criterion, an eigenvalue greater than one is a good lower bound for expecting a factor to be meaningful or interpretable 57. The Scree plot in Figure 2 shows two factors have eigenvalues greater than one and the two factors cumulatively explain 94.62% of the total variance. Factor 1 has an eigenvalue of 4.812 and Factor 2 has an eigenvalue of 1.450. The proportion of variance explained by Factor 1 is 72.70% and by Factor 2 is 21.92%.
4.3. Bootstrap Resampling and Statistics from Factor AnalysisAfter deciding on the two factors to retain, we extracted factors using the ULS method. We computed the confidence interval of the point estimates of parameters (i.e., eigenvalues, factor loadings, and communalities) based on bootstrap resampling to evaluate the preciseness of the estimates and to know whether the estimates reported are likely to generalize to a new sample or population. We produced 1,000 resamples of the study dataset using unrestricted random sampling (also known as random sampling with replacement).
The idea behind bootstrap analysis is that 1,000 resamples from the original dataset can be considered as potential samples from the population 57. The average estimate calculated from 1,000 resamples is a rough approximation of the population estimate. For each parameter the values at the 2.5th and 97.5th percentile of the bootstrap distribution represent a 95% confidence interval within which true population parameters lie.
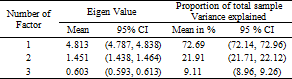
To get an idea about the likelihood that the two-factor structure would replicate in a similar sample, we examined the initial eigenvalues from the bootstrap resamples. The average estimates, the 95% confidence intervals of eigenvalues of the first three extracted factors, and the proportion of the total sample variance accounted by these factors are given in Table 3.
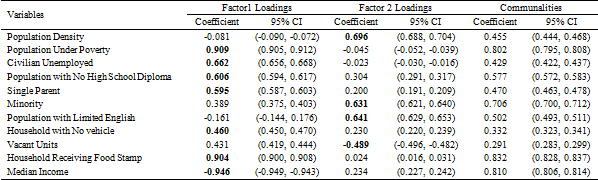
The average estimates of the first two eigenvalues, 4.813 and 1.451, from 1,000 bootstrap resamples are the only eigenvalues greater than one. Moreover, the average proportion estimate of the total variance explained of 1,000 resamples suggests that two common factors cumulatively account for a 94.60 proportion of the total population variance. Average estimates of the eigenvalues and of the proportion of the total variance explained by the two factors lie within their 95% confidence interval. The average estimates of factor loadings after Promax rotation, communalities, and their confidence interval based on 1,000 resamples for the two-factor solution are shown in Table 4. The first rotated factor has higher loadings on the variables, percent of the population under poverty (0.909), percent of civilian unemployed (0.662), percent of the population with no high school diploma (0.606), percent of single-parent households with children under 18 years old (0.595), percent of the population with no vehicle (0.460), percent of households receiving food stamps (0.904), and log median income (-0.946). The variables, namely, log population density (0.696), percent of vacant housing units (-0.489), percent of minorities (0.631), and percent of the population with limited English (0.641), load highly on the second factor. The communalities values are approximately greater than 0.3, implying that the two factors account for most of the sample variance of each variable. Further, we are 95% confident that the true factor loadings of each variable lie between their 2.5th and 97.5th percentiles.
Upon careful analysis, we notice that if the lower value of median income and higher value of remaining variables that loads onto Factor 1 are found in a tract, then such tract represents the neighborhoods with a lower socioeconomic status. Various studies had found that the neighborhoods with lower socioeconomic status have limited access to large-scale grocery stores and often rely on convenience or small grocers shelving fewer healthy items with higher prices 9, 10, 59, 22, 12. Thus, we can call Factor 1 the socioeconomically vulnerable neighborhoods.
Similarly, the tracts with the lower value of population density and higher value of remaining variables that load onto Factor 2 represent demographically disadvantaged neighborhoods. As per Dutko et al., 2 low-income census tracts in very dense urban areas were less likely to be food deserts while less dense census tracts with higher concentrations of minority populations were more likely to be food deserts. Additionally, living in a declining neighborhood where the percent of vacant housing is high could worsen the food access problem of poor families as these neighborhoods are less attractive for larger retail or supermarket stores 49. Thus, we identified Factor 2 as demographically vulnerable neighborhoods.
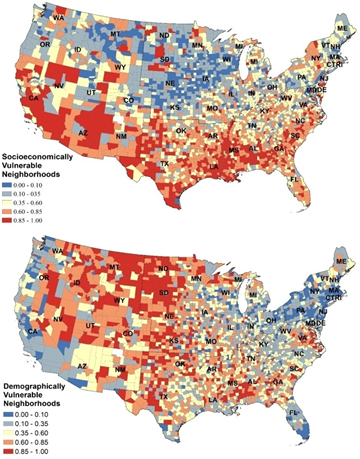
To calculate factor scores, first, we computed the percentile ranking of each variable. Next, we linearly combined the percentile ranking of each variable that highly load onto each factor. The values thus obtained for each factor were again ranked representing the factor scores. The higher the scores for Factor 1, the more socioeconomically vulnerable neighborhoods are. The lower the scores for Factor 2, the more demographically vulnerable neighborhoods are. For mapping purposes, the scores (percentile rankings) of Factor 2 were reversed. Thus, the higher scores of Factor 2 represent the more vulnerable neighborhoods. The scores for each factor were grouped into the following categories: 0.00–0.10 represents invulnerable neighborhoods while 0.10–0.35, 0.35–0.60, 0.60–0.85, and 0.85–1.00 represents very low, low, medium, and highly vulnerable neighborhoods.
Although the vulnerability scores were calculated at the census tract level, for mapping purposes, the values were aggregated at the county levels. Figure 3 shows that the counties with high socioeconomic vulnerability were mostly concentrated in the southern states of Alabama, Georgia, Mississippi, Texas, Louisiana, Arizona, New Mexico, California, Nevada, and South Dakota. Most counties in Missouri and New York had a medium socioeconomic vulnerability score. Low median income, higher poverty rate, and lower educational attainment were the main reasons for high and medium socioeconomic vulnerability. Many neighborhoods in the Midwest and the Northeast as well as states such as Oregon, Idaho, Montana, and Colorado had low and very low socioeconomic vulnerability scores.
Figure 3 also indicates that the majority of the neighborhoods in the Central Northwest parts of the country had high-to-medium demographic vulnerability scores, followed by that of some southern states such as Texas, Oklahoma, Mississippi, Alabama, Arkansas, and Georgia. Neighborhoods with very low and low demographic vulnerability scores were states in the Pacific, Central Northeast, Mid-Atlantic and New England regions. The main reason for high vulnerability scores in the South was the combination of lower population density and a higher proportion of minority population residing in the neighborhoods of the southern states. Low population density is the main reason for high demographic vulnerability scores in the Mountain States like Utah, Wyoming, Nevada, Montana, Colorado, Idaho, and in the Central Northwest states like North Dakota, South Dakota, Kansas, and Nebraska.
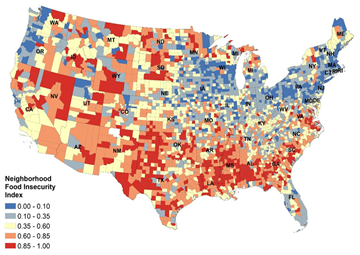
To identify the food vulnerable neighborhoods with limited food access, the NFII was created based on the procedure mentioned in the methodology section. The NFII scores were mapped to examine whether any spatial pattern exists. For mapping purpose (as shown in Figure 4), the NFII scores calculated at the census tract level were aggregated at the county levels. We classified the numerical values of the index (as we did for the factor scores) as follows: 0.00–0.10 equals invulnerable neighborhoods, 0.10–0.35 equals very low vulnerable neighborhoods, 0.35 – 0.60 equals low vulnerable neighborhoods, 0.60 – 0.85 equals medium vulnerable neighborhoods and 0.85 - 1.00 equals highly vulnerable neighborhoods. Figure 4 clearly shows that most counties located in the southern states, Mountain regions, South Dakota and North Dakota had high to medium vulnerablity. The larger number of counties with a very low and low vulnerability were located in the Pacific, Central Northeast, and northeastern parts of the country.
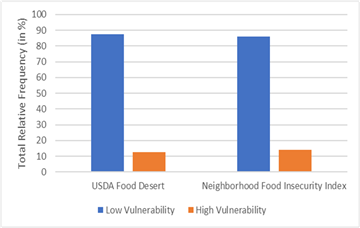
We compared (as shown in Figure 5) high food vulnerability tracts as indicated by the NFII with the USDA’s low income and low access (LILA) census tracts (or food deserts). According to NFII, 14.07% of the census tracts were highly vulnerable, which is 1.38% more than the number of food deserts identified by the USDA (USDA classifies 12.69% of all census tracts as food deserts). Further, 0.02, 0.42, and 1.71% of the food desert tracts fell under the NFII's categories of invulnerable, very low, and low vulnerable neighborhoods. However, 2.60 and 4.39% of food desert tracts were classified as medium and highly vulnerable neighborhoods.
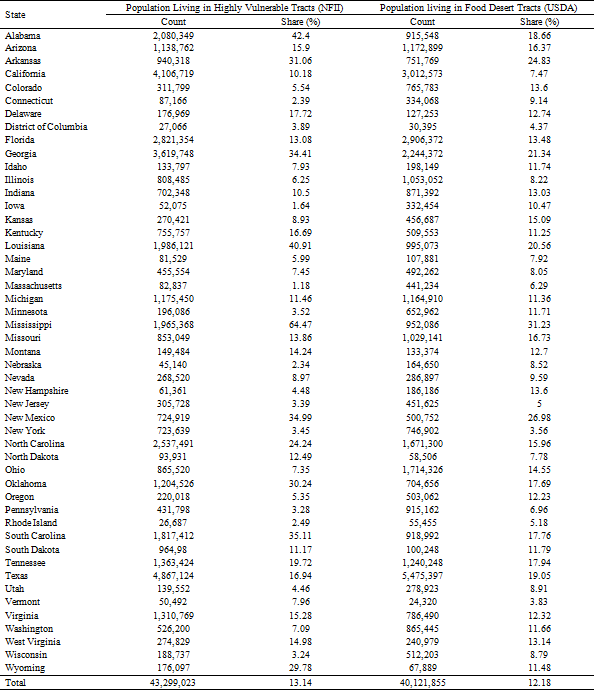
We then compared the count and share of the total population of the highly vulnerable neighborhoods in each state identified by the NFII with that of food deserts in the year 2018, as shown in Table 5.
We found out that over 43 million people, or 13.14% of the U.S. population, lived in the high vulnerability tracts identified by the index. About 40 million people, or 12.18% of the U.S. population, lived in the food desert tracts identified by the USDA. As per the NFII, Mississippi (64.47), Alabama (42.40), and Louisiana (40.91) had the largest shares of the population in the NFII’s highly vulnerable tracts. Nebraska (2.34), Iowa (1.64), and Massachusetts (1.18) had the lowest share of population in the NFII’s highly vulnerable tracts. Regionally, the South (8.55) had the greatest share of the population in the NFII’s highly vulnerable tracts, followed by the West (2.36), Midwest (1.62), and Northeast (0.56). Based on the USDA’s food desert estimation, Mississippi (31.23), New Mexico (26.98), and Arkansas (24.83) had the greatest share of the population living in food desert tracts while the District of Columbia (4.37), Vermont (3.83), and New York (3.56) had the smallest share of the population living in food deserts. Regionally, the South (6.63) had the greatest share of the population living in food deserts, followed by the Midwest (2.46), West (2.36), and Northeast (0.99).
The main difference between the USDA’s food desert and the NFII data presented in this study is that the USDA’s food deserts are a measure of just two variables, namely, income and the distance to stores. Also, the NFII is based on multiple measures (i.e., 11 neighborhood characteristics) that could determine the number and type of food stores or influence the prospects of new food stores in the neighborhoods. Low-income neighborhoods can be a disincentive for most retail stores. However, low-income neighborhoods with larger population density and with infrastructure that facilitates in accessing food assistance programs could appeal to some food stores 2, 49. Further, the USDA has not given much attention to the major determinants, in particular poverty and race that could justify a food desert's existence. Various studies have found that high-poverty and minority-dominated neighborhoods have limited access to grocery stores 37, 22, 38, 59, 12. Further, many researchers discovered that owning a vehicle or easy access to transport was more important than proximity to food stores 43, 42, 41. Unlike the USDA's two measures that overestimate a neighborhood's food access problem, the NFII takes account of every possible neighborhood characteristic (e.g., median income, poverty, unemployment, race, vehicle, and population density) that could accurately estimate food access problems.
The availability of food stores in a neighborhood depends on the geography, demography, and socio-economic characteristics of the neighborhood, not just the neighborhood's income. Thus, the USDA definition of a food desert, based on the distance to store and the neighborhood’s income, seems to be limited. Further, many scholars, such as Joassart-Marcelli et al., 4 as well as Taylor & Ard, 5 argued that the adaptation of the traditional approach of lack of access portrays an entire city or its neighborhoods, especially low-income minority neighborhoods, as food deserts. Due to the inconclusive and not generalizable results of food desert studies, an exploratory factor analysis was conducted that revealed certain underlying structures or relationships that were not previously suspected, which, in turn, facilitated in more precisely defining neighborhood food insecurity.
For the factor analysis, this study used 11 measures of a neighborhood's socioeconomic and demographic characteristics. These 11 characteristics are systematically grouped into two factors (i.e., socioeconomic and demographic) defining neighborhood vulnerability. Vulnerable neighborhoods, both socioeconomically and demographically, seem to be less attractive for the big retail or grocery stores 49 and sometimes subject to malpractice like supermarket redlining 44, 45, 46. Thus, people living in these neighborhoods could be at higher nutritional risk.
The Neighborhood Food Insecurity Index was created to measure the relative food vulnerability of every U.S. census tract affecting the ability of residents to access healthy food providers. The relative vulnerability was measured using the tract's 11 characteristics that could potentially influence the number, types, and prospects of food stores in a neighborhood. This is unlike the USDA's income measures, which overestimate food access problems in low-income neighborhoods 4, 5. The NFII, as 11 measures of neighborhood food insecurity, could justify the limited existence of healthy food providers in a neighborhood. The NFII distinguishes the population living in the census tracts of the southern United States as highly vulnerable, socioeconomically and demographically speaking, which thus could influence the number or types or prospects of food stores in the neighborhoods.
In short, this study concludes that to make individuals or households food secure, the U.S. government must focus on uplifting the socioeconomic status and redevelopment of poor neighborhoods. There is no doubt that the SNAP program has had a significant contribution in making U.S. households food secure. Various studies have found that low-income residents, especially, older adults and foreign-born individuals, are less likely to participate in SNAP despite their eligibility 35. Further, research conducted by Racine et al., 33 discovered that neighborhoods with higher proportions of SNAP participants had limited stores and are mainly comprised of minority households, households that do not own vehicles, and households that have children under 18 years old. Such a scenario raises a question about the effectiveness of the SNAP program in mitigating household food insecurity.
The NFII provides insights about the opening or closing of grocery stores and their density (high or low) in a neighborhood based on the neighborhood’s socioeconomic and demographic characteristics. However, this study is not able to pinpoint accurately whether the neighborhood has inadequate access because various community-based food access initiative programs, like mobile markets, farmers markets, and community and school gardens, may be introduced to fight food insecurity and hunger. Furthermore, to understand whether peoples' food baskets are healthy or not, one must investigate the effect of types of food available and their prices on consumption behaviors. Consideration of these aspects is crucial to determine the extent and severity of food insecurity.
1. White patches in Figure 3 represent the counties with zero population or no estimates in the database and were not considered during analysis.
2. White patches in Figure 4 represent the counties with zero population or no estimates in the database and were not considered during analysis.
3. In Figure 5, high vulnerability also represents food desert census tracts and low vulnerability represents non-food desert tracts.
4. Population estimates of the food desert tracts for the year 2018 were extracted from the 2013-2018 ACS 5-year estimates.
| [1] | Rhone, A., Ver Ploeg, M., Dicken, C., Williams, R., & Breneman, V., 2017. Low-income and low-supermarket-access census tracts, 2010-2015, USDA, Economic Research Service. | ||
| In article | |||
| [2] | Dutko, P., Ver Ploeg, M., & Farrigan, T., 2012. Characteristics and influential factors of food deserts. ERR-140, U.S. Department of Agriculture, Economic Research Service. | ||
| In article | |||
| [3] | USDA, 2020. Food Security Status of U.S. Households in 2019. https://www.ers.usda.gov/topics/food-nutrition-assistance/food-security-in-the-us/key-statistics-graphics/ | ||
| In article | |||
| [4] | Joassart-Marcelli, P., Rossiter, J. S., & Bosco, F. J., 2017. Ethnic markets and community food security in an urban “food desert.” Environment and Planning A 49(7), 1642-1663. | ||
| In article | View Article | ||
| [5] | Taylor, D. E., & Ard, K. J., 2015. Food availability and the food desert frame in Detroit: an overview of the city’s food system. Environmental Practice 17(2), 102-133. | ||
| In article | View Article | ||
| [6] | Wilde, P., Llobrera, J., & Ver Ploeg, M., 2014. Population density, poverty, and food retail access in the United States: an empirical approach. International Food and Agribusiness Management Review 17, 171-186. | ||
| In article | |||
| [7] | Jiao, J., Moudon, A. V, Ulmer, J., Hurvitz, P. M., & Drewnowski, A., 2012. How to Identify Food Deserts: Measuring Physical and Economic Access to Supermarkets in King County, Washington. American Journal of Public Health 102(10), e32-e39. | ||
| In article | View Article PubMed | ||
| [8] | Ver Ploeg, M., Dutko, P., & Breneman, V., 2015. Measuring food access and food deserts for policy purposes. Applied Economic Perspectives and Policy 37(2), 205-225. | ||
| In article | View Article | ||
| [9] | Hamidi, S., 2020. Urban sprawl and the emergence of food deserts in the USA. Urban Studies, 0042098019841540. | ||
| In article | |||
| [10] | Ma, X., Sharpe, P. A., Bell, B. A., Liu, J., White, K., & Liese, A. D., 2018. Food Acquisition and Shopping Patterns among Residents of Low-Income and Low-Access Communities in South Carolina. Journal of the Academy of Nutrition and Dietetics 118(10), 1844-1854. | ||
| In article | View Article PubMed | ||
| [11] | Lamb, K. E., Thornton, L. E., Cerin, E., & Ball, K., 2015. Statistical approaches used to assess the equity of access to food outlets: a systematic review. AIMS Public Health 2(3), 358. | ||
| In article | View Article PubMed | ||
| [12] | Walker, R. E., Keane, C. R., & Burke, J. G., 2010. Disparities and access to healthy food in the United States: A review of food deserts literature. Health & Place 16(5), 876-884. | ||
| In article | View Article PubMed | ||
| [13] | Hendrickson, D., Smith, C., & Eikenberry, N., 2006. Fruit and vegetable access in four low-income food deserts communities in Minnesota. Agriculture and Human Values 23(3), 371-383. | ||
| In article | View Article | ||
| [14] | Mendy, V. L., Vargas, R., Cannon-Smith, G., Payton, M., Enkhmaa, B., & Zhang, L., 2018. Food Insecurity and Cardiovascular Disease Risk Factors among Mississippi Adults. International Journal of Environmental Research and Public Health 15(9). | ||
| In article | View Article PubMed | ||
| [15] | Cook, J. T., & Jeng, K., 2009. Child food insecurity: The economic impact on our nation: A report on research on the impact of food insecurity and hunger on child health, growth and development. Feeding America. | ||
| In article | |||
| [16] | Gundersen, C., & Ziliak, J. P., 2015. Food insecurity and health outcomes. Health Affairs34(11), 1830-1839. | ||
| In article | View Article PubMed | ||
| [17] | Crowe, J., Lacy, C., & Columbus, Y., 2018. Barriers to food security and community stress in an urban food desert. Urban Science 2(2), 46. | ||
| In article | View Article | ||
| [18] | Chai, W., Fan, J. X., & Wen, M., 2018. Association of Individual and Neighborhood Factors with Home Food Availability: Evidence from the National Health and Nutrition Examination Survey. Journal of the Academy of Nutrition & Dietetics 118(5), 815-823. | ||
| In article | View Article PubMed | ||
| [19] | Shannon, J., 2016. Beyond the Supermarket Solution: Linking Food Deserts, Neighborhood Context, and Everyday Mobility. Annals of the American Association of Geographers 106(1), 186-202. | ||
| In article | View Article | ||
| [20] | Kennedy, S., Fitch, C. A., Warren, J. R., & Rivera Drew, J. A., 2013. Food Insecurity during Childhood: Understanding Persistence and Change Using Linked Current Population Survey Data. University of Kentucky Center for Poverty Research Discussion Paper Series, DP2013-03. University of Kentucky Center for Poverty Research. | ||
| In article | |||
| [21] | Coleman-Jensen, A., McFall, W., & Mark, N., 2013. Food Insecurity in Households with Children: Prevalence, Severity, and Household Characteristics, 2010-11. https://www.ers.usda.gov/webdocs/publications/43763/37672_eib-113.pdf?v=4842.4. | ||
| In article | |||
| [22] | Bower, K. M., Thorpe Jr, R. J., Rohde, C., & Gaskin, D. J., 2014. The intersection of neighborhood racial segregation, poverty, and urbanicity and its impact on food store availability in the United States. Preventive Medicine 58, 33-39. | ||
| In article | View Article PubMed | ||
| [23] | Zenk, S. N., Schulz, A. J., Israel, B. A., James, S. A., Bao, S., & Wilson, M. L., 2005. Neighborhood racial composition, neighborhood poverty, and the spatial accessibility of supermarkets in metropolitan Detroit. American Journal of Public Health 95(4), 660-667. | ||
| In article | View Article PubMed | ||
| [24] | Colón-Ramos, U., Monge-Rojas, R., Stevenson, T. R., Burns, H., Thurman, S., Gittelsohn, J., & Gurman, T. A., 2018. How Do African-American Caregivers Navigate a Food Desert to Feed Their Children? A Photovoice Narrative. Journal of the Academy of Nutrition and Dietetics 118(11), 2045-2056. | ||
| In article | View Article PubMed | ||
| [25] | Moore, L. V, Diez Roux, A. V, Nettleton, J. A., & Jacobs Jr, D. R., 2008. Associations of the local food environment with diet quality—a comparison of assessments based on surveys and geographic information systems: the multi-ethnic study of atherosclerosis. American Journal of Epidemiology 167(8), 917-924. | ||
| In article | View Article PubMed | ||
| [26] | Franco, M., Roux, A. V. D., Glass, T. A., Caballero, B., & Brancati, F. L., 2008. Neighborhood characteristics and availability of healthy foods in Baltimore. American Journal of Preventive Medicine 35(6), 561-567. | ||
| In article | View Article PubMed | ||
| [27] | Morland, K., Wing, S., Roux, A. D., & Poole, C., 2002. Neighborhood characteristics associated with the location of food stores and food service places. American Journal of Preventive Medicine 22(1), 23-29. | ||
| In article | View Article | ||
| [28] | Filomena, S., Scanlin, K., & Morland, K. B., 2013. Brooklyn, New York foodscape 2007–2011: a five-year analysis of stability in food retail environments. International Journal of Behavioral Nutrition and Physical Activity 10(1), 46. | ||
| In article | View Article PubMed | ||
| [29] | Wilcox, S., Sharpe, P. A., Liese, A. D., Dunn, C. G., & Hutto, B., 2020. Socioeconomic factors associated with diet quality and meeting dietary guidelines in disadvantaged neighborhoods in the Southeast United States. Ethnicity & Health 25(8), 1115-1131. | ||
| In article | View Article PubMed | ||
| [30] | Rodriguez, R. M., & Maraj Grahame, K., 2016. Understanding food access in a rural community: an ecological perspective. Food, Culture & Society 19(1), 171-194. | ||
| In article | View Article | ||
| [31] | Lu, Y.-C., Walker, R., Richard, P., & Younis, M., 2020. Inequalities in Poverty and Income between Single Mothers and Fathers. In International Journal of Environmental Research and Public Health 17(1). | ||
| In article | View Article PubMed | ||
| [32] | Chung, Y., & Maguire-Jack, K., 2020. Understanding movement into poverty and poverty persistence over time. Journal of Poverty 24(3), 241-255. | ||
| In article | View Article | ||
| [33] | Racine, E. F., Delmelle, E., Major, E., & Solomon, C. A., 2018. Accessibility landscapes of supplemental nutrition assistance program− Authorized stores. Journal of the Academy of Nutrition and Dietetics, 118(5), 836-848. | ||
| In article | View Article PubMed | ||
| [34] | Robbins, S., Ettinger, A. K., Keefe, C., Riley, A., & Surkan, P. J., 2017. Low-income urban mothers’ experiences with the Supplemental Nutrition Assistance Program. Journal of the Academy of Nutrition and Dietetics 117(10), 1538-1553. | ||
| In article | View Article PubMed | ||
| [35] | Cohen, N., 2019. SNAP at the Community Scale: How Neighborhood Characteristics Affect Participation and Food Access. American Journal of Public Health 109(12), 1646-1651. | ||
| In article | View Article PubMed | ||
| [36] | Laska, M. N., Borradaile, K. E., Tester, J., Foster, G. D., & Gittelsohn, J., 2010. Healthy food availability in small urban food stores: a comparison of four US cities. Public Health Nutrition 13(7), 1031-1035. | ||
| In article | View Article PubMed | ||
| [37] | Hager, E. R., Cockerham, A., O’Reilly, N., Harrington, D., Harding, J., Hurley, K. M., & Black, M. M., 2017. Food swamps and food deserts in Baltimore City, MD, USA: Associations with dietary behaviors among urban adolescent girls. Public Health Nutrition 20(14), 2598-2607. | ||
| In article | View Article PubMed | ||
| [38] | Chen, H.-J., & Wang, Y., 2014. The changing food outlet distributions and local contextual factors in the United States. BMC Public Health 14(1), 1-18. | ||
| In article | View Article PubMed | ||
| [39] | Kwate, N. O. A., Yau, C.Y., Loh, J.M., & Williams, D., 2009. Inequality in obesogenic environments: fast food density in New York City. Health & Place 15(1), 364-373. | ||
| In article | View Article PubMed | ||
| [40] | DiSantis, K. I., Hillier, A., Holaday, R., & Kumanyika, S., 2016. Why do you shop there? A mixed methods study mapping household food shopping patterns onto weekly routines of black women. International Journal of Behavioral Nutrition and Physical Activity 13(1), 1-9. | ||
| In article | View Article PubMed | ||
| [41] | Cannuscio, C. C., Tappe, K., Hillier, A., Buttenheim, A., Karpyn, A., & Glanz, K., 2013. Urban food environments and residents’ shopping behaviors. American Journal of Preventive Medicine 45(5), 606-614. | ||
| In article | View Article PubMed | ||
| [42] | Ghosh-Dastidar, B., Cohen, D., Hunter, G., Zenk, S. N., Huang, C., Beckman, R., & Dubowitz, T., 2014. Distance to store, food prices, and obesity in urban food deserts. American Journal of Preventive Medicine 47(5), 587-595. | ||
| In article | View Article PubMed | ||
| [43] | Wright, J. D., Donley, A. M., Gualtieri, M. C., & Strickhouser, S. M., 2016. Food deserts: What is the problem? What is the solution? Society 53(2), 171-181. | ||
| In article | View Article | ||
| [44] | Tiwari, S., & Ambinakudige, S., 2020. Streetscapes and stereotyping: streets named after Martin Luther King, Jr., and the geographies of racial identity. GeoJournal. | ||
| In article | View Article | ||
| [45] | D’Rozario, D., & Williams, J. D., 2005. Retail redlining: Definition, theory, typology, and measurement. Journal of Macromarketing 25(2), 175-186. | ||
| In article | View Article | ||
| [46] | Eisenhauer, E., 2001. In poor health: Supermarket redlining and urban nutrition. GeoJournal 53(2), 125. | ||
| In article | View Article | ||
| [47] | Kane, J., 1984. The Supermarket Shuffle. Mother Jones, 9-7. | ||
| In article | |||
| [48] | Zhang, M., & Ghosh, D., 2016. Spatial Supermarket Redlining and Neighborhood Vulnerability: A Case Study of H artford, C onnecticut. Transactions in GIS 20(1), 79-100. | ||
| In article | View Article PubMed | ||
| [49] | Bonanno, A., 2012. Food Deserts: Demand, Supply, and Economic Theory. Choices: The Magazine of Food, Farm & Resource Issues, 27(3), 1. | ||
| In article | |||
| [50] | Johnson, R. A., & Wichern, D. W., 2015. Applied multivariate statistical analysis. Statistics 6215(10), 10. | ||
| In article | |||
| [51] | Gardner, E., Kimpel, T., & Zhao, Y., 2010. American Community Survey User Guide ACS Publication No. Citeseer. | ||
| In article | |||
| [52] | Nunnally, J. C., & Bernstein, I. (n.d.). Psychometric Theory (3rd ed.). New York: MCGraw Hill. | ||
| In article | |||
| [53] | Flanagan, B. E., Hallisey, E. J., Adams, E., & Lavery, A., 2018. Measuring community vulnerability to natural and anthropogenic hazards: The Centers for Disease Control and Prevention’s Social Vulnerability Index. Journal of Environmental Health 80(10), 34. | ||
| In article | |||
| [54] | CDC, 2020. CDC Social Vulnerability Index. https://www.atsdr.cdc.gov/placeandhealth/svi/documentation/pdf/SVI2018Documentation-H.pdf. | ||
| In article | |||
| [55] | Zygmont, C., & Smith, M. R., 2014. Robust factor analysis in the presence of normality violations, missing data, and outliers: Empirical questions and possible solutions. The Quantitative Methods for Psychology 10(1), 40-55. | ||
| In article | View Article | ||
| [56] | Krijnen, W. P., 1996. Algorithms for unweighted least-squares factor analysis. Computational Statistics & Data Analysis 21(2), 133-147. | ||
| In article | View Article | ||
| [57] | Osborne, J. W., & Banjanovic, E. S., 2016. Exploratory factor analysis with SAS. Sas Institute. | ||
| In article | |||
| [58] | Kaiser, H. F., & Rice, J., 1974. Little jiffy, mark IV. Educational and Psychological Measurement 34(1), 111-117. | ||
| In article | View Article | ||
| [59] | Lamichhane, A. P., Warren, J., Puett, R., Porter, D. E., Bottai, M., Mayer-Davis, E. J., & Liese, A. D., 2013. Spatial patterning of supermarkets and fast-food outlets with respect to neighborhood characteristics. Health & Place, 23, 157-164. | ||
| In article | View Article PubMed | ||
Published with license by Science and Education Publishing, Copyright © 2021 Sweta Tiwari and Shrinidhi Ambinakudige
![]() This work is licensed under a Creative Commons Attribution 4.0 International License. To view a copy of this license, visit
http://creativecommons.org/licenses/by/4.0/
This work is licensed under a Creative Commons Attribution 4.0 International License. To view a copy of this license, visit
http://creativecommons.org/licenses/by/4.0/
| [1] | Rhone, A., Ver Ploeg, M., Dicken, C., Williams, R., & Breneman, V., 2017. Low-income and low-supermarket-access census tracts, 2010-2015, USDA, Economic Research Service. | ||
| In article | |||
| [2] | Dutko, P., Ver Ploeg, M., & Farrigan, T., 2012. Characteristics and influential factors of food deserts. ERR-140, U.S. Department of Agriculture, Economic Research Service. | ||
| In article | |||
| [3] | USDA, 2020. Food Security Status of U.S. Households in 2019. https://www.ers.usda.gov/topics/food-nutrition-assistance/food-security-in-the-us/key-statistics-graphics/ | ||
| In article | |||
| [4] | Joassart-Marcelli, P., Rossiter, J. S., & Bosco, F. J., 2017. Ethnic markets and community food security in an urban “food desert.” Environment and Planning A 49(7), 1642-1663. | ||
| In article | View Article | ||
| [5] | Taylor, D. E., & Ard, K. J., 2015. Food availability and the food desert frame in Detroit: an overview of the city’s food system. Environmental Practice 17(2), 102-133. | ||
| In article | View Article | ||
| [6] | Wilde, P., Llobrera, J., & Ver Ploeg, M., 2014. Population density, poverty, and food retail access in the United States: an empirical approach. International Food and Agribusiness Management Review 17, 171-186. | ||
| In article | |||
| [7] | Jiao, J., Moudon, A. V, Ulmer, J., Hurvitz, P. M., & Drewnowski, A., 2012. How to Identify Food Deserts: Measuring Physical and Economic Access to Supermarkets in King County, Washington. American Journal of Public Health 102(10), e32-e39. | ||
| In article | View Article PubMed | ||
| [8] | Ver Ploeg, M., Dutko, P., & Breneman, V., 2015. Measuring food access and food deserts for policy purposes. Applied Economic Perspectives and Policy 37(2), 205-225. | ||
| In article | View Article | ||
| [9] | Hamidi, S., 2020. Urban sprawl and the emergence of food deserts in the USA. Urban Studies, 0042098019841540. | ||
| In article | |||
| [10] | Ma, X., Sharpe, P. A., Bell, B. A., Liu, J., White, K., & Liese, A. D., 2018. Food Acquisition and Shopping Patterns among Residents of Low-Income and Low-Access Communities in South Carolina. Journal of the Academy of Nutrition and Dietetics 118(10), 1844-1854. | ||
| In article | View Article PubMed | ||
| [11] | Lamb, K. E., Thornton, L. E., Cerin, E., & Ball, K., 2015. Statistical approaches used to assess the equity of access to food outlets: a systematic review. AIMS Public Health 2(3), 358. | ||
| In article | View Article PubMed | ||
| [12] | Walker, R. E., Keane, C. R., & Burke, J. G., 2010. Disparities and access to healthy food in the United States: A review of food deserts literature. Health & Place 16(5), 876-884. | ||
| In article | View Article PubMed | ||
| [13] | Hendrickson, D., Smith, C., & Eikenberry, N., 2006. Fruit and vegetable access in four low-income food deserts communities in Minnesota. Agriculture and Human Values 23(3), 371-383. | ||
| In article | View Article | ||
| [14] | Mendy, V. L., Vargas, R., Cannon-Smith, G., Payton, M., Enkhmaa, B., & Zhang, L., 2018. Food Insecurity and Cardiovascular Disease Risk Factors among Mississippi Adults. International Journal of Environmental Research and Public Health 15(9). | ||
| In article | View Article PubMed | ||
| [15] | Cook, J. T., & Jeng, K., 2009. Child food insecurity: The economic impact on our nation: A report on research on the impact of food insecurity and hunger on child health, growth and development. Feeding America. | ||
| In article | |||
| [16] | Gundersen, C., & Ziliak, J. P., 2015. Food insecurity and health outcomes. Health Affairs34(11), 1830-1839. | ||
| In article | View Article PubMed | ||
| [17] | Crowe, J., Lacy, C., & Columbus, Y., 2018. Barriers to food security and community stress in an urban food desert. Urban Science 2(2), 46. | ||
| In article | View Article | ||
| [18] | Chai, W., Fan, J. X., & Wen, M., 2018. Association of Individual and Neighborhood Factors with Home Food Availability: Evidence from the National Health and Nutrition Examination Survey. Journal of the Academy of Nutrition & Dietetics 118(5), 815-823. | ||
| In article | View Article PubMed | ||
| [19] | Shannon, J., 2016. Beyond the Supermarket Solution: Linking Food Deserts, Neighborhood Context, and Everyday Mobility. Annals of the American Association of Geographers 106(1), 186-202. | ||
| In article | View Article | ||
| [20] | Kennedy, S., Fitch, C. A., Warren, J. R., & Rivera Drew, J. A., 2013. Food Insecurity during Childhood: Understanding Persistence and Change Using Linked Current Population Survey Data. University of Kentucky Center for Poverty Research Discussion Paper Series, DP2013-03. University of Kentucky Center for Poverty Research. | ||
| In article | |||
| [21] | Coleman-Jensen, A., McFall, W., & Mark, N., 2013. Food Insecurity in Households with Children: Prevalence, Severity, and Household Characteristics, 2010-11. https://www.ers.usda.gov/webdocs/publications/43763/37672_eib-113.pdf?v=4842.4. | ||
| In article | |||
| [22] | Bower, K. M., Thorpe Jr, R. J., Rohde, C., & Gaskin, D. J., 2014. The intersection of neighborhood racial segregation, poverty, and urbanicity and its impact on food store availability in the United States. Preventive Medicine 58, 33-39. | ||
| In article | View Article PubMed | ||
| [23] | Zenk, S. N., Schulz, A. J., Israel, B. A., James, S. A., Bao, S., & Wilson, M. L., 2005. Neighborhood racial composition, neighborhood poverty, and the spatial accessibility of supermarkets in metropolitan Detroit. American Journal of Public Health 95(4), 660-667. | ||
| In article | View Article PubMed | ||
| [24] | Colón-Ramos, U., Monge-Rojas, R., Stevenson, T. R., Burns, H., Thurman, S., Gittelsohn, J., & Gurman, T. A., 2018. How Do African-American Caregivers Navigate a Food Desert to Feed Their Children? A Photovoice Narrative. Journal of the Academy of Nutrition and Dietetics 118(11), 2045-2056. | ||
| In article | View Article PubMed | ||
| [25] | Moore, L. V, Diez Roux, A. V, Nettleton, J. A., & Jacobs Jr, D. R., 2008. Associations of the local food environment with diet quality—a comparison of assessments based on surveys and geographic information systems: the multi-ethnic study of atherosclerosis. American Journal of Epidemiology 167(8), 917-924. | ||
| In article | View Article PubMed | ||
| [26] | Franco, M., Roux, A. V. D., Glass, T. A., Caballero, B., & Brancati, F. L., 2008. Neighborhood characteristics and availability of healthy foods in Baltimore. American Journal of Preventive Medicine 35(6), 561-567. | ||
| In article | View Article PubMed | ||
| [27] | Morland, K., Wing, S., Roux, A. D., & Poole, C., 2002. Neighborhood characteristics associated with the location of food stores and food service places. American Journal of Preventive Medicine 22(1), 23-29. | ||
| In article | View Article | ||
| [28] | Filomena, S., Scanlin, K., & Morland, K. B., 2013. Brooklyn, New York foodscape 2007–2011: a five-year analysis of stability in food retail environments. International Journal of Behavioral Nutrition and Physical Activity 10(1), 46. | ||
| In article | View Article PubMed | ||
| [29] | Wilcox, S., Sharpe, P. A., Liese, A. D., Dunn, C. G., & Hutto, B., 2020. Socioeconomic factors associated with diet quality and meeting dietary guidelines in disadvantaged neighborhoods in the Southeast United States. Ethnicity & Health 25(8), 1115-1131. | ||
| In article | View Article PubMed | ||
| [30] | Rodriguez, R. M., & Maraj Grahame, K., 2016. Understanding food access in a rural community: an ecological perspective. Food, Culture & Society 19(1), 171-194. | ||
| In article | View Article | ||
| [31] | Lu, Y.-C., Walker, R., Richard, P., & Younis, M., 2020. Inequalities in Poverty and Income between Single Mothers and Fathers. In International Journal of Environmental Research and Public Health 17(1). | ||
| In article | View Article PubMed | ||
| [32] | Chung, Y., & Maguire-Jack, K., 2020. Understanding movement into poverty and poverty persistence over time. Journal of Poverty 24(3), 241-255. | ||
| In article | View Article | ||
| [33] | Racine, E. F., Delmelle, E., Major, E., & Solomon, C. A., 2018. Accessibility landscapes of supplemental nutrition assistance program− Authorized stores. Journal of the Academy of Nutrition and Dietetics, 118(5), 836-848. | ||
| In article | View Article PubMed | ||
| [34] | Robbins, S., Ettinger, A. K., Keefe, C., Riley, A., & Surkan, P. J., 2017. Low-income urban mothers’ experiences with the Supplemental Nutrition Assistance Program. Journal of the Academy of Nutrition and Dietetics 117(10), 1538-1553. | ||
| In article | View Article PubMed | ||
| [35] | Cohen, N., 2019. SNAP at the Community Scale: How Neighborhood Characteristics Affect Participation and Food Access. American Journal of Public Health 109(12), 1646-1651. | ||
| In article | View Article PubMed | ||
| [36] | Laska, M. N., Borradaile, K. E., Tester, J., Foster, G. D., & Gittelsohn, J., 2010. Healthy food availability in small urban food stores: a comparison of four US cities. Public Health Nutrition 13(7), 1031-1035. | ||
| In article | View Article PubMed | ||
| [37] | Hager, E. R., Cockerham, A., O’Reilly, N., Harrington, D., Harding, J., Hurley, K. M., & Black, M. M., 2017. Food swamps and food deserts in Baltimore City, MD, USA: Associations with dietary behaviors among urban adolescent girls. Public Health Nutrition 20(14), 2598-2607. | ||
| In article | View Article PubMed | ||
| [38] | Chen, H.-J., & Wang, Y., 2014. The changing food outlet distributions and local contextual factors in the United States. BMC Public Health 14(1), 1-18. | ||
| In article | View Article PubMed | ||
| [39] | Kwate, N. O. A., Yau, C.Y., Loh, J.M., & Williams, D., 2009. Inequality in obesogenic environments: fast food density in New York City. Health & Place 15(1), 364-373. | ||
| In article | View Article PubMed | ||
| [40] | DiSantis, K. I., Hillier, A., Holaday, R., & Kumanyika, S., 2016. Why do you shop there? A mixed methods study mapping household food shopping patterns onto weekly routines of black women. International Journal of Behavioral Nutrition and Physical Activity 13(1), 1-9. | ||
| In article | View Article PubMed | ||
| [41] | Cannuscio, C. C., Tappe, K., Hillier, A., Buttenheim, A., Karpyn, A., & Glanz, K., 2013. Urban food environments and residents’ shopping behaviors. American Journal of Preventive Medicine 45(5), 606-614. | ||
| In article | View Article PubMed | ||
| [42] | Ghosh-Dastidar, B., Cohen, D., Hunter, G., Zenk, S. N., Huang, C., Beckman, R., & Dubowitz, T., 2014. Distance to store, food prices, and obesity in urban food deserts. American Journal of Preventive Medicine 47(5), 587-595. | ||
| In article | View Article PubMed | ||
| [43] | Wright, J. D., Donley, A. M., Gualtieri, M. C., & Strickhouser, S. M., 2016. Food deserts: What is the problem? What is the solution? Society 53(2), 171-181. | ||
| In article | View Article | ||
| [44] | Tiwari, S., & Ambinakudige, S., 2020. Streetscapes and stereotyping: streets named after Martin Luther King, Jr., and the geographies of racial identity. GeoJournal. | ||
| In article | View Article | ||
| [45] | D’Rozario, D., & Williams, J. D., 2005. Retail redlining: Definition, theory, typology, and measurement. Journal of Macromarketing 25(2), 175-186. | ||
| In article | View Article | ||
| [46] | Eisenhauer, E., 2001. In poor health: Supermarket redlining and urban nutrition. GeoJournal 53(2), 125. | ||
| In article | View Article | ||
| [47] | Kane, J., 1984. The Supermarket Shuffle. Mother Jones, 9-7. | ||
| In article | |||
| [48] | Zhang, M., & Ghosh, D., 2016. Spatial Supermarket Redlining and Neighborhood Vulnerability: A Case Study of H artford, C onnecticut. Transactions in GIS 20(1), 79-100. | ||
| In article | View Article PubMed | ||
| [49] | Bonanno, A., 2012. Food Deserts: Demand, Supply, and Economic Theory. Choices: The Magazine of Food, Farm & Resource Issues, 27(3), 1. | ||
| In article | |||
| [50] | Johnson, R. A., & Wichern, D. W., 2015. Applied multivariate statistical analysis. Statistics 6215(10), 10. | ||
| In article | |||
| [51] | Gardner, E., Kimpel, T., & Zhao, Y., 2010. American Community Survey User Guide ACS Publication No. Citeseer. | ||
| In article | |||
| [52] | Nunnally, J. C., & Bernstein, I. (n.d.). Psychometric Theory (3rd ed.). New York: MCGraw Hill. | ||
| In article | |||
| [53] | Flanagan, B. E., Hallisey, E. J., Adams, E., & Lavery, A., 2018. Measuring community vulnerability to natural and anthropogenic hazards: The Centers for Disease Control and Prevention’s Social Vulnerability Index. Journal of Environmental Health 80(10), 34. | ||
| In article | |||
| [54] | CDC, 2020. CDC Social Vulnerability Index. https://www.atsdr.cdc.gov/placeandhealth/svi/documentation/pdf/SVI2018Documentation-H.pdf. | ||
| In article | |||
| [55] | Zygmont, C., & Smith, M. R., 2014. Robust factor analysis in the presence of normality violations, missing data, and outliers: Empirical questions and possible solutions. The Quantitative Methods for Psychology 10(1), 40-55. | ||
| In article | View Article | ||
| [56] | Krijnen, W. P., 1996. Algorithms for unweighted least-squares factor analysis. Computational Statistics & Data Analysis 21(2), 133-147. | ||
| In article | View Article | ||
| [57] | Osborne, J. W., & Banjanovic, E. S., 2016. Exploratory factor analysis with SAS. Sas Institute. | ||
| In article | |||
| [58] | Kaiser, H. F., & Rice, J., 1974. Little jiffy, mark IV. Educational and Psychological Measurement 34(1), 111-117. | ||
| In article | View Article | ||
| [59] | Lamichhane, A. P., Warren, J., Puett, R., Porter, D. E., Bottai, M., Mayer-Davis, E. J., & Liese, A. D., 2013. Spatial patterning of supermarkets and fast-food outlets with respect to neighborhood characteristics. Health & Place, 23, 157-164. | ||
| In article | View Article PubMed | ||


