Pitaya fruit (PF) has extremely a high nutritional value and is rich in betalain. However, betalain easily degrades and fades during high-temperature baking. In this study, PF pulp was dried into powder and then added to bread dough to make pitaya fruit bread (PFB). The Taguchi method was used to determine the optimal condition combination for making PFB, and various quality characteristic tests were performed. This study used different proportions of PF powder (4%, 8%, and 12%), dough weights (40, 60, and 80g), proofing times (40, 60, and 80 min), and baking times (8, 9, and 10 min) for nine combination groups. The quality was based on the a value for the internal color of the bread, the volume of the bread, and the overall sensory acceptability according to bread testers. The test results revealed that A2 (PF8%), B1 (60 g), C2 (60 min), and D2 (9 min) were the optimal combinations of control factors. The research and development of PF can help farmers to process and store excess output; the baking industry can have an additional alternative ingredient to increase product variety; and consumers can have wider product choices. PFB with a red internal color was successfully produced.
Developing new bakery products is a necessary response to intense market competition. New products can provide consumers with additional choices. To make conventional cereal processed products more natural and healthy, continuous innovation as well as research and development must be conducted. From a nutritional perspective, improving the dietary benefits of cereal products (e.g., increasing the dietary fiber content or the antioxidant capacity) can add value to such products. The current product development goal is to produce products that are beneficial to bodily functions without altering the operating technology or production process 1, 2, 3.
Pitaya fruit (PF), also known as dragon fruit, is a perennial climbing succulent plant in the cactus family. The annual PF output of Taiwan in 2018 was approximately 6700 Tons (Council of Agriculture). The flesh can be either red or white, and the estimated ratio of output is 2:8. The scientific names of white- and red-fleshed PF are Hylocereus undatus and Hylocereus polyrhizus, respectively. The total polyphenol content, reducing power, and DPPH free radicals and superoxide anion scavenging in the components of red-fleshed PF are higher than those in white-fleshed PF. This is because red-fleshed PF contains a large concentration of betalain, resulting in higher antioxidant activity 4, 5. Because betalain is a sensitive pigment, its stability can be further studied. The presence of stable betalain in food is beneficial to human health because it is an excellent source of antioxidants 6. Therefore, this study selected red-fleshed PF as an experimental material.
PF can be eaten whole. The pulp is a good source of antioxidants that is beneficial to human health, and the peel is a valuable byproduct that can be processed into nutritious raw food materials for use as a food additive 7. Modern people have doubts about the health and safety of food colorants; thus, natural pigments are being increasingly used 8. Adding acid to PF juice can adjust its pH value and increase the stability of the betalain content 9. Some researchers have added dried PF peel (in powder form) to biscuits, and the experimental results revealed that the addition of peel can increase the crude fiber content of biscuits and give the biscuits a red hue 10. Researchers have also grinded dried PF peel into powder and added it to steamed buns to increase their nutritional value and produce a red hue. However, the red color became lighter or faded after heating because the betalain degraded and seeped into the center of the dough. Adding more betalain affects dough proofing, and the ability of egg whites to scavenge free radicals increases 11. PF seeds provide high-yield oils and are a potential source of natural antioxidants, such as phenols, tocopherols, and sterols. Waste products such as PF seeds from the juice industry can be used as a source of edible oil. Researchers have been increasingly incorporating PF seed oil into cosmetics, medicines, and food 12.
At present, only few studies have applied dried PF pulp (powder) to baked goods. This study has three major findings: (1) Fruit farmers can reduce the problem of overproduction or unsatisfactory sales due to poor fruit quality, (2) the baking industry can use this powder as a new ingredient to diversify product ranges; and (3) consumers can consume more nutritious bread when this powder is added 13.
The experimental design involved adoption of the Taguchi method, which is used to improve product quality and production process. This method involves using a minimum number of experiments to evaluate the effects of multiple factors simultaneously 14, 15. After a review of the literature, this study identified three research questions: (1) Will adding PF affect dough proofing time? (2) Will the dough weight affect its color? (3) Will the natural red pigment be degraded after baking, causing it have a lighter appearance? This study used the taste and texture of PF bread (PFB) as the quality basis, applied the Taguchi method to determine the most suitable combination of parameters for baking PFB based on signal-to-noise (S/N) ratio, and tested the optimal combinations for making PFB.
High-gluten flour (Uni-President Enterprises Corporation, Tainan, Taiwan), sugar (Xinji Yuan Co., Ltd., Kaohsiung, Taiwan), salt (Taiyen Biotech Co., Ltd., Tainan, Taiwan), yeast (Tah Shen Trading, Taipei, Taiwan), butter (Fonterra Brands [New Young] Pte. Ltd. – Taiwan Branch, Taipei, Taiwan), maltodextrin M-100 (Yih Yuan Food Co., Ltd., Keelung, Taiwan), and PF (Hylocereus poltrhizus) provided by farmers (Mingjian, Nantou, Taiwan).
2.2. PF Powder PreparationAfter the PF was washed and peeled, a blender (MD-183 Madin, Tainan, Taiwan) was used to blend it into a puree. A mixer (SP-200A Spar, Taichung, Taiwan) was then used to add maltodextrin into the puree at a medium speed, and the mixture was stirred for 3 min. This study prepared the PF powder following the instructions given in 10. Specifically, the puree was poured into a drying tray and placed in a dryer (Shiido, Taichung, Taiwan) to dry at 55°C and stored overnight. Subsequently, a grinder was used to grind the dried puree into powder (with particles small enough to be passed through a 60-mesh sieve), and the PF was stored in a closed plastic container.
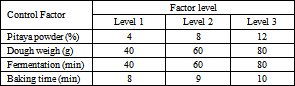
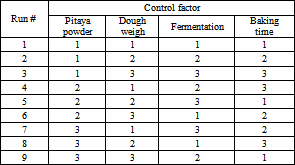
2.3. Experimental DesignThe Taguchi method was used to add PF to the dough and produce PFB under different conditions. The method of Tsai (2004) 16 was referenced and adjusted slightly. The preparation process involved four factors, namely different proportions of PF, dough weight, proofing time, and baking time. Three control levels were used (Table 1), and data were presented in an orthogonal array L9(34) (Table 2). The a value for the bread’s internal color, bread volume, and overall sensory acceptability were used as the basis for quality measurement. Finally, the PFB production process was determined based on the optimal combination of parameters, and comparisons were conducted to determine which factor combinations would affect PFB. In addition, the S/N ratio (decibel) was employed to calculate the desired value of the target characteristic, and the optimal quality level–based S/N ratio response graph was constructed and analyzed for each combination.
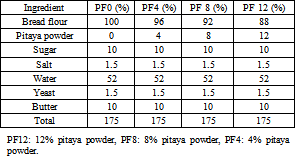
The dough mixing method was the same as that of Lin et al. 17, 18 with slight adjustments, and the PFB ingredient list is as shown in (Table 3). A mixer (SP-200A Spar, Taichung, and Taiwan) was used to mix the dough. First, the dry ingredients were mixed evenly at a low speed. Then, water was added before the ingredients were mixed at medium speed for 6 min, and finally, cream was added before the ingredients were mixed for 5 min. Subsequently, the dough was placed in a proofer (Huangta Industrial Co., Ltd., Taichung, and Taiwan) for proofing over 60 min at 28°C and 75% humidity. The dough was then cut to the weight specified in the experimental design. The PFB dough was rounded and again placed in the proofer for intermediate proofing for 15 min at 28°C and 75% humidity. Subsequently, the dough was again rounded and placed in the proofer for final proofing at 38°C and 85% humidity; the proofing time varied as designed. The baking temperature was 180°C for both the upper and lower heat in the oven (K-25-S2-IBA2, Chung Pu Baking Machinery Co., Ltd., Taichung, and Taiwan), and the baking time was set according to the experimental design. Various tests were performed after the PFB was cooled at room temperature for 2 h.
The dough proofing test was similar to that proposed by Shyu et al. 19. The dough formula is as shown in Table 3, and one control group without PF was added. After the dough was mixed, it was cut into pieces, each weighing 30 g. The dough was rounded and then placed into a 250-mL graduated cylinder. The graduated cylinder was placed into the proofer and remained there for 240 min (28°C and 75% humidity). The height and volume of the dough were observed and recorded every 15 min.
2.6. Physical Characteristics of PFBColor test: A colorimeter (CR-10 Konica Minolta Sensing Inc., Osaka, Japan) was used to determine the brightness (L), red hue (a), and yellow hue (b) of the PF powder, dough, bread crust, and bread’s internal color. The whiteness index (WI) calculation formula is as follows:
 |
Water activity: A 2-g sample was placed into a Lab Swift water activity meter (Novasina, Switzerland) for testing, and the value was recorded when it reached the equilibrium value.
Water content measurement: The sample (2 g) was tested with an infrared moisture analyzer (MF-50, A&D, Japan), and the value was recorded after the water had evaporated.
Baking loss: The method of Vasafi et al. 20 was referenced to calculate the baking loss (5) = [(before baking − after baking)/before baking] × 100; this value was recorded.
Bread volume: The method of Lin et al. 17 was applied, which is referred to as the measurement of bread volume by rapeseed displacement. After the bread was weighed and the specific volume of rapeseeds was determined (cm3/g), the volume of the bread was divided by the weight of the bread.
2.7. Bread Texture AnalysisAfter being baked, the bread was cooled for 2 h. This study adapted to the method proposed by Gostin 21 to conduct a texture profile analysis (TPA). A 38.1-mm acrylic cylinder was used as a CT3 texture analyzer (Brookfield Engineering Laboratories, Inc., Middleboro, MA, USA), and a slicer (Jendah Food Machinery Co., Ltd., Kaohsiung, Taiwan) was used to cut the bread into 12.5-mm-thick samples. During the test, two slices of bread were stacked on top of each other for the compression test. Each pressing procedure was repeated twice at a speed of 2 mm/s. The starting distance was 10 mm above the top of the sample surface; a 40% compression rate was obtained. The analysis parameters were hardness, cohesiveness, springiness, gumminess, and chewiness; three samples from each bread were analyzed.
2.8. Sensory EvaluationThis study adapted the method of 18 for sensory evaluation. The sensory evaluation was conducted 3-5 h after the bread was baked. The thickness of the sample was 12.5 mm. A total of 30 tasters aged 18-24 years, who were students majoring in hospitality management, were recruited. The test items were color, aroma, texture, flavor, and overall sensory acceptability, each rated on a 7-point scale. Among them, 1, 4, and 7 points respectively indicated extremely unfavorable, acceptable, and extremely favorable. The samples were coded with three digits, and the final test result data were the mean values of ratings by the 30 tasters.
2.9. Statistical AnalysisThe statistical analysis method followed that of Vasaf et al. 20; in summary, the approach was a post hoc analysis that compares least significant differences. This method was to determine the smallest significant difference (5% significance) between means.
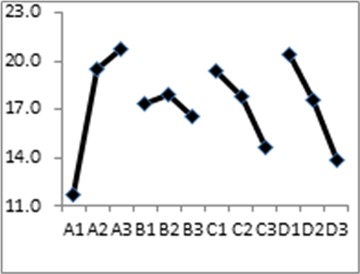
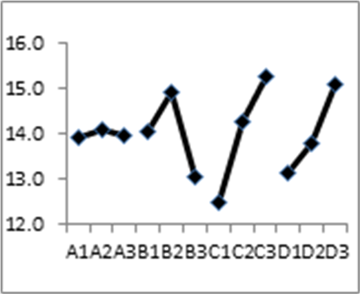
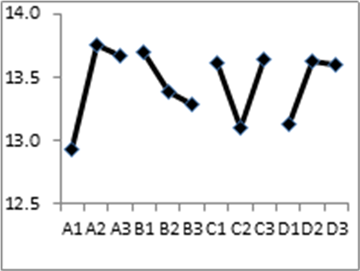
The optimal process conditions were discussed according to a value for the internal color of the bread, the bread volume, and the overall sensory acceptability; The result is shown in the Figure below. As shown in Figure 4, the S/N ratio response graph of the a value for internal color reveals that the difference between a PF concentration of 8% and of 12% was minor, and the dough weight had a little effect on its color. In addition, proofing times of 40 and 60 min did not result in color differences, but baking times resulted in substantial color differences. The a value for color obtained with a baking time of 8 min was the optimal one. Bread volume is also an essential indicator of quality. The S/N ratio response diagram shown in Figure 5 indicated that the optimal dough had a PF concentration of 8%, a dough weight of 60 g, a proofing time of 80 min, and a baking time of 10 min. Additionally, the sensory evaluation is the most useful reference for product development. According to the S/N ratio response graph shown in Figure 6, the optimal combination was a PF concentration of 8%, dough weight of 40 g, proofing time of either 40 or 80 min (no difference), and a baking time of 9 min. In summary, the aforementioned three sets of S/N ratio response graphs presented the optimal conditions for PFB making, which were a PF concentration of 8%, dough weight of 60 g, 60 min of proofing time, and 9 min of baking time.
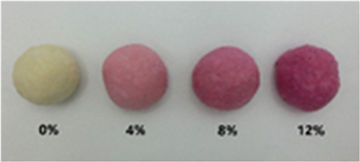
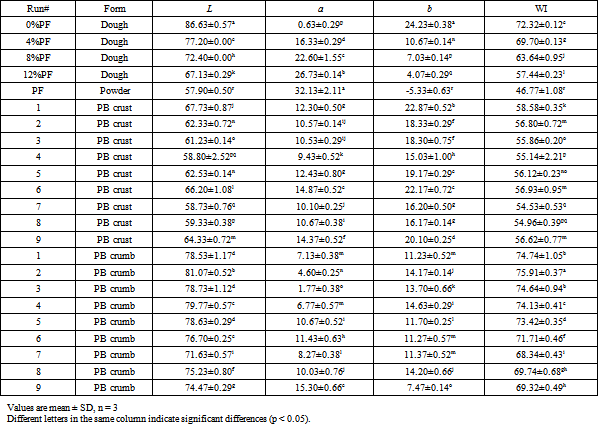
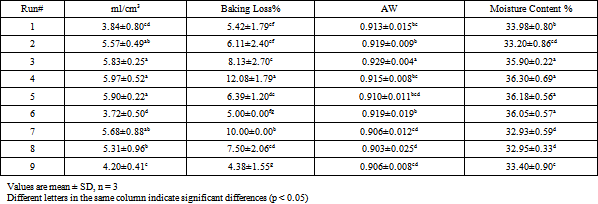
Food color is a crucial indicator of quality. Generally, breads should have a brown surface color and an internal color of milky white. PF accounted for 4–12% of the dough color changes from light pink to rose red (Figure 1). In addition, the surface color of PFB showed no obvious differences based on different PF concentrations (Figure 3). The bread surface was affected by the Maillard reaction and caramelization, which explained why the color was mostly brown 22 (Figure 2). The internal color of the bread had a group effect owing to the different PF concentrations used; the PF4% sample was light red to yellow, the PF8% sample was light pink, and the PF12% sample was pink. Table 4 shows that the highest a value of PF represents the lightest shade of red, whereas 1 and the lowest WI value represent the darkest shade of red, and the negative b value represents blue. The values for these four indicators were significantly different between each process condition and group (p < 0.05).
The results related to the PFB dough were as expected (Table 4). The control group had the highest WI value because no PF was added, and significant difference was obtained at p < 0.05. For other groups, the WI value was lower when the PF content was higher, indicating that such dough was darker. The a value was higher when the PF concentration in the dough was higher; this corresponded to a redder hue. For the control group, a higher b value indicated a yellow hue. For other groups with higher PF concentrations, the yellow hue was less pronounced because the b value denoted a blue hue. The surface color of the bread was affected by the Maillard reaction, and the addition of PF did not affect the surface’s WI value, instead that heating and baking time affect the surface color of PFB 23. A longer baking time leads to a darker surface color of the dough. In terms of sliced bread, the WI value showed an obvious group effect. Among the three groups, PF4% bread was reddish, PF8% bread was light pink, and PF12% bread was dark pink. This indicated that a higher PF concentration resulted in a darker color. The red-color a value varied due to interference from other factors and achieved significant difference between groups at p < 0.05. The group 9 bread had the reddest hue because it contained the highest PF concentration of 12%, and the baking time was the shortest at 8 min. By contrast, the group 3 bread had the lightest red color due to the lowest PF content of 4%, and the baking time was longest at 10 min. The color lightening may have been because the betalain underwent thermal decomposition or oxidative degradation due to high-temperature heating and baking. The degradation began from the center of the bread and caused the bread slices to have a lighter color 11. Therefore, heating temperature, baking time, and heating method are crucial factors affecting the color stability of baked products containing betalain.
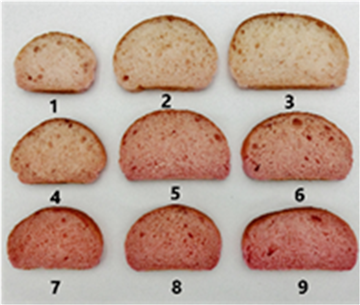
PFB dough color changed with different PF concentrations (Figure 1); this observation is consistent with the a value shown in Table 4. The red hue was darker when the PF concentration was higher. The highest WI value without the addition of PF indicated the whitest sample, and the WI value was lower when a higher PF concentration was added, indicating a darker hue. Figure 3 depicts the appearance of the PFB, and the colors changed with different baking conditions and were less affected by PF concentration. According to the figure, only Group 1 exhibited a lighter hue, which was consistent with the results in Table 4. The lighter hue should be related to the process conditions of a PF concentration of 4% and 8 min of baking time. Regarding bread volume, Group 5, with dough weight of 60 g and proofing time of 80 min, and Group 6, with dough weight of 80 g and proofing time of 40 min, had the same bread volume, which was probably due to the short proofing time in Group 6. Therefore, proofing time affects bread volume. The same problem was also observed in Groups 7 and 8, and the obtained results were consistent with the bread volumes in Table 5. Adding PF to the dough during the baking process degrades the betalain and causes the color to fade. Therefore, how to maintain the original red color of the bread was the focus of this experiment. Figure 2 presents a section plane of PFB. Among the nine groups of experimental samples, Group 3 had the lightest hue, which corresponded to the value shown in Table 4. For Groups 4 to 6 with a PF concentration of 8%, Group 4 had the lightest hue, which was probably related to baking time. For Groups 7 to 9 with PF concentrations of 12%, all samples had a red appearance. Group 4 had the lightest red hue (lowest betalain concentration) compared with other groups due to its longer baking time.
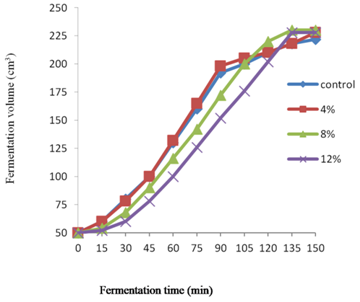
As shown in Figure 7, the increase in volume of PFB with a PF concentration of 4% was similar to that of the control group. In addition, the speed of volume increase in the PF8% bread was relatively low at the beginning of proofing but it reached the volume of the control group at 105 min; thereafter, the speed continued to increase. The PF12% bread had the slowest increase in volume among the four groups at the beginning of proofing. Nonetheless, it reached the volume of the control group and PF4% group at 130 min, and the volume continued to increase until 135 min. Figure 7 compares the proofing times of the four groups with those of the control group. The proofing times of PF4%, PF8%, and PF12% breads were 15–90 min, 15–120 min, and 30–135 min, respectively. Therefore, this study suggested that a higher PF concentration would affect the initial proofing rate of the yeast but that the volume would continue to grow and would eventually reach the standard one. The addition of PF did not affect the final volume of dough, but the continuous proofing time was longer if PF was added.
The volume of bread was affected by the bread recipe, dough mixing process, and dough proofing time. The expansion volume and mixing tolerance index are also key indicators that affect bread volume 24. The volume of PFB produced under different process conditions is shown in Table 5. Groups 2, 3, 4, 5 and 7 all had a proofing time between 60 and 80 min, the volume was 5.68–5.97 mL/g, and significant differences were noted with the other four groups (p < 0.05). Groups 1 and 6 had the smallest volumes of 3.72 and 3.84 mL/g, respectively, due to them having the shortest proofing time of 40 min. Therefore, adding PF did not affect the bread volume; rather, proofing time was more relevant to volume.
The dough was baked after proofing. The baking process changes a dough’s structure and properties and produces aromas before it becomes bread. During baking, the high temperature causes the water in the dough to evaporate, causing baking loss 25. Group 4 (40 g, 60 min of proofing time, 10 min of baking time) had the highest baking loss (significant at p < 0.05). An increase in baking time reduces the weight and water content of bread 20. For Groups 6 and 9, the baking loss was nonsignificant and was less than that in the other groups. This was probably due to their shorter baking times. Bread baking time affects starch retrogradation in the dough structure. A short baking time can reduce the water flow phenomenon in the structure, delaying the retrogradation of the bread 26. As detailed in Table 5, the water activity of each group is above 0.9, making them high water activity products. The water activity was the highest in Group 3, and a significant difference existed between each group (p > 0.05). The negative correlation between PF concentration and water activity was due to the sugar concentration in PF. Scholars have revealed that the water activity is lower when the sugar concentration is higher 27. As detailed in Table 5, the moisture content difference between Groups 3 to 6 were nonsignificant (p > 0.05), but the moisture content of these groups was significantly different from that of other groups. Therefore, the difference in process conditions and PF concentration did not affect the moisture content in this experiment. The results of this experiment were consistent with the moisture content results presented in 28.
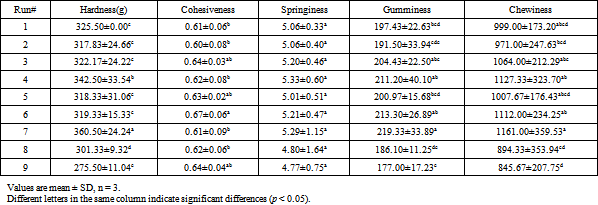
TPA results have substantial reference value for quality control, process optimization, and determining the requisite parameters for product development. The parameters measured by TPA are objective measurement results; thus, TPA results are reliable 29. Hardness is the force required for food to deform. It is usually used as an indicator of bread freshness. The longer a bread is stored, the higher is its hardness. Harness caused by water evaporation and starch retrogradation 18. Table 6 shows the results of the groups showing significant differences in hardness at p < 0.05, which are ranked in order as follows: Group 7 > Group 4 > Groups 1, 2, 3, 5, and 6 > Group 8 > Group 9. Hardness was not affected by different PF concentrations because both the maximum and minim hardness values fell in the PF12% condition. The factors related to hardness are generally dough weight, proofing time, and baking time.
Cohesiveness in bread is defined as the internal resistance of the bread’s structure 18. A higher cohesiveness value indicates greater energy required to chew a food item. Table 6 shows that the cohesiveness values in Groups 6, 2, 4, 7, and 8 were significant (p < 0.05), whereas other groups had nonsignificant cohesiveness values. Springiness is the proportional height of the recovery of food after deformation 30. No significant difference was identified between the nine groups in the experimental results (p > 0.05), which means that the PFB springiness was unaffected by different processing conditions. Gumminess is calculated by multiplying hardness and cohesiveness, and it is defined as the force required to chew a semisolid food to the extent that it can be swallowed. Groups 7 and 9 had the highest and lowest gumminess values, respectively, and a significant difference existed between the two groups (p < 0.05). The key influencing factor should be related to hardness. Chewiness is a product of hardness, cohesiveness, and springiness; it is defined as the force required to chew a solid food to the extent that it can be swallowed. Groups 1 and 5 had nonsignificant differences (p > 0.05). However, Groups 7 and 9 had the greatest significant differences, probably due to the differences in their processing conditions.
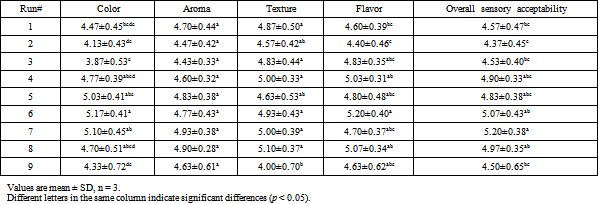
3.6. Sensory ExperimentFor PFB sensory evaluation of consumer acceptance, this study adopted the Taguchi method in its experimental design to evaluate the color, aroma, texture, flavor, and overall sensory acceptability of nine groups of samples (Table 7). In terms of color, differences between Groups 4 and 8 were nonsignificant (p < 0.05), indicating that tasters had higher acceptance for PF8% bread. In terms of aroma, no significant difference was observed between all the groups (p > 0.05), indicating that the tasters could accept the addition of PF to the bread. In addition, the texture was also acceptable, but Group 9 obtained a lower score because the tasters disliked the texture of this bread. The conditions of Group 9 were a PF concentration of 12%, dough weight of 80 g, proofing time of 60 min, and baking time of 8 min. This study revealed that 80 g of dough with only 8 min of baking time did not result in an acceptable bread texture. For flavor, no significant difference was found between Groups 3 to 9 (p >0.05), but Group 6 had a large difference with Group 2 (p < 0.05), and the overall sensory acceptability scores were acceptable. Groups 4 to 8 were nonsignificant (p >0.05). According to this table, the most crucial influence on overall sensory acceptability of PFB was color. Bread baking is a complex conversion process, during which time various physical phenomena occur. It was expected that this study would rely on a simple method to estimate the required baking time 22. This study identified two factors influencing the processing time for baking. The first was applying the shortest time to change from dough to bread and to ensure the acceptability of the product, and the second was the quality, which was reflected in the sensory evaluation, such as the desired surface color, and it is related to consumer preferences. The TPA test results showed that Group 7 obtained the highest scores in hardness (Table 6) and overall sensory acceptability (Table 7), indicating that the tasters could accept a bread with a firmer texture.
This study drew the following conclusions: A higher PF concentration produced a deeper red hue in the internal structure of the PFB. In addition, the dough weight did not affect the color of the PFB, but it did affect baking time. Moreover, the proofing time did not affect the color of the PFB, but it did affect the bread volume. Baking time was the key factor affecting PFB. According to the test results and the S/N ratio response graph after application of the Taguchi method, the optimal combination of process conditions was a PF concentration of 8%, 60 g of dough weight, 60 min of proofing time, and 9 min of baking time. This baking process information can be provided as a reference for those who want to make PFB in the future.
Not applicable.
The authors have no competing interests.
| [1] | Lin, J. and Zhou, W., “Role of quercetin in the physicochemical properties, antioxidant and antiglycation activities of bread,” Journal of Functional Foods, 40. 299-306. January.2018. | ||
| In article | View Article | ||
| [2] | Gobbetti, M., Angelis, M.D., Cagno, R.D., Calasso, M., Archetti, G. and Rizzello, G.G., “Novel insights on the functional/nutritional features of the sourdough fermentation,” International Journal of Food Microbiology, 302. 103-113. August.2019.. | ||
| In article | View Article PubMed | ||
| [3] | Graça, C., Fradinho, P., Sousa, I. and Raymundo, A., “Impact of Chlorella vulgaris on the rheology of wheat flour dough and bread texture,” LWT - Food Science and Technology, 89. 466-474. March.2018. | ||
| In article | View Article | ||
| [4] | Cheng, C.W., Hsieh, Z.J., Ho, Y.C., Cheng, Y.F., Wong, Y.R. and Liang, J.Y., “In vitro radical scavenging activity of methanol extracts of red and white flesh Pitaya,” MC-Transaction on Biotechnology, 6(1). 1-12. January.2014. | ||
| In article | |||
| [5] | Wu, L.C., Hsu, H.W., Chen, Y.C., Chiu, C.C., Lin, Y.I. and Ho, J.A., “Antioxidant and antiproliferative activities of red pitaya,” Food Chemistry, 95(2). 391-327. March.2006. | ||
| In article | View Article | ||
| [6] | Leong, H.Y., Ooi, C.W., Law, C.L., Julkifle, A.L., Ling, T.C. and Show, P.L., “Application of liquid biphasic flotation for betacyanins extraction from peel and flesh of Hylocereus polyrhizus and antioxidant activity evaluation,” Separation and Purification Technology, 201. 156-166. August .2018. | ||
| In article | View Article | ||
| [7] | Tenore, G.C., Novellino, E. and Basile, A., “Nutraceutical potential and antioxidant benefits of red pitaya (Hylocereus polyrhizus) extracts,” Journal of Functional Foods, 4(1). 129-136. January. 2012. | ||
| In article | View Article | ||
| [8] | Petra, A., Hana, K. and Jana, R.K., “Health safety issues of synthetic food colorants,” Regulatory Toxicology and Pharmacology, 73(3). 914-922. December.2015. | ||
| In article | View Article PubMed | ||
| [9] | Herbach, K.M., Rohe, M. and Stintzing, F.C. and Carle, R., “Structural and chromatic stability of purple pitaya (Hylocereus polyrhizus [Weber] Britton & Rose) betacyanins as affected by the juice matrix and selected additives,” Food Research International, 39(6). 667-677. July.2006. | ||
| In article | View Article | ||
| [10] | Ho, L.H. and Latif, N.W.B.A., “Nutritional composition, physical properties,and sensory evaluation of cookies prepared from wheat flour and pitaya (Hylocereus undatus) peel flour blends,” Cogent Food & Agriculture, 2(1). 1136369. January. 2016. | ||
| In article | View Article | ||
| [11] | Hsu, C.T., Chang, Y.H. and Shiau, S.Y., “Color, antioxidation, and texture of dough and Chinese steamed bread enriched with pitaya peel powder,” Cereal Chemistry, 96(1). 76-85. February.2019. | ||
| In article | View Article | ||
| [12] | Lim, H.K., Tan, C.P., Karim, R., Ariffin, A.A. and Bakar, J., “Chemical composition and DSC thermal properties of two species of Hylocereus cacti seed oil: Hylocereus undatus and Hylocereus polyrhizus,” Food Chemistry, 119(4). 1326-1331. April. 2010. | ||
| In article | View Article | ||
| [13] | Martins, Z.E., Pinho, O. and Ferreira, I.M.P.L.V.O., “Food industry by-products used as functional ingredients of bakery products,” Trends in Food Science & Technology, 67. 106-128. September. 2017. | ||
| In article | View Article | ||
| [14] | Besseris, G.J., “Taguchi-generalized regression neural network micro-screening for physical and sensory characteristics of bread,” Heliyon, 4(3). e00551. March.2018. | ||
| In article | View Article PubMed | ||
| [15] | Sihombing, H., Hafiz., Yuhazri, M.K. and Kannan, M.Y., “Taguchi’s quality improvement analysis of the sme bread manufacturing,” Global Engineers & Technologists Review, 2(9). 6-18. 2012. | ||
| In article | |||
| [16] | Tsai, P.J, Hong, L.H, Lin, T.C., Chen, I.S., Chen, H.H., Wang, C.Y. and Lin, C.T., “Processing and Storage of Dry-type Candied Mulberry,” Taiwanese Journal of Agricultural Chemistry and Food Science, 42(2). 140-146. April.2004. | ||
| In article | |||
| [17] | Lin, L.Y., Tseng, Y.H., Li, R.C. and Mau, J.L., “Quality of shiitake stipe bread,” Journal of Food Processing and Preservation, 32(6). 1002-1015. December. 2008. | ||
| In article | View Article | ||
| [18] | Ulziijargal, E., Yang, J.H., Lin, L.Y., Chen, C.P. and Mau, J.L., “Quality of bread supplemented with mushroom mycelia,” Food Chemistry, 138(1). 70-76. May. 2013. | ||
| In article | View Article PubMed | ||
| [19] | Shyu, Y.S., Hwang, J.Y., Huang, T.C. and Sung, W.C., “Effect of resistant starch on physicochemical properties of wheat dough and bread,” Journal of Food and Nutrition Research, 6(5). 335-340. May. 2018. | ||
| In article | View Article | ||
| [20] | Vasaf, P.S., Hamdami, N. and, Keramat, J., “Quality and microbial stability of part-baked ‘Barbari bread’ during freezing storage,” LWT - Food Science and Technology, 104. 173-179. May. 2019. | ||
| In article | View Article | ||
| [21] | Gostin, A.I., “Effects of substituting refined wheat flour with wholemeal and quinoa flour on the technological and sensory characteristics of salt-reduced breads,” LWT - Food Science and Technology, 114. 108412. November. 2019. | ||
| In article | View Article | ||
| [22] | Purlis, E., “Simple methods to predict the minimum baking time of bread,” Food Control, 104. 217-223. October. 2019. | ||
| In article | View Article | ||
| [23] | Zhang, L., Putranto, A., Zhou, W., Boom, R.M., Schutyser, M.A.I. and Chen, X.D., “Miniature bread baking as a timesaving researchapproach and mathematical modeling of browningkinetics,” Food and Bioproducts Processing, 100(A). 401-411. October. 2016. | ||
| In article | View Article | ||
| [24] | Paulin, P.P.D., Chevallier S., Pare, A. and Alain, L.B., “Effect of supplementation of wheat bran on dough aeration and final bread volume,” Journal of Food Engineering, 252. 28-35. July.2019. | ||
| In article | View Article | ||
| [25] | Purlis, E. and Salvadori, V.O., “Bread baking as a moving boundary problem. Part 1: Mathematical modelling,” Journal of Food Engineering, 91(3). 428-433. April.2009. | ||
| In article | View Article | ||
| [26] | Bosmans, G.M., Lagrain, B. and Fierens, E., “Impact of Amylases on Biopolymer Dynamics during Storage of Straight-Dough Wheat Bread,” Journal of Agricultural and Food Chemistry, 61(26). 6525-6532. June.2013. | ||
| In article | View Article PubMed | ||
| [27] | Yang, H. and Shit, M., “Research on correlation of starch syrup variety water activity,color and texture of Mochi,” Journal of the Agricultural Association of China, 8(3). 183-193. June.2007. | ||
| In article | |||
| [28] | Zhang, L., Boven, A.V., Mulder, J., Grandia, J., Chen, X.D., Boom, R.M. and Schutyser, M.A.I., “Arabinoxylans-enriched fractions: From dry fractionation of wheat bran to the investigation on bread baking performance,” Journal of Cereal Science, 87. 1-8. May.2019. | ||
| In article | View Article | ||
| [29] | Olojede, A.O., Sanni, A.I. and Banwo, K., “Effect of legume addition on the physiochemical and sensorial attributes of sorghum-based sourdough bread,” LWT - Food Science and Technology, 118. 108769. January 2020. | ||
| In article | View Article | ||
| [30] | Gül, H. and Şen, H., “Effects of pomegranate seed flour on dough rheology and bread quali,” Cyta – Journal of Food, 15. 622-628. June. 2017. | ||
| In article | View Article | ||
Published with license by Science and Education Publishing, Copyright © 2022 Hung-Ju Tsai and Chan-Chiung Liu
![]() This work is licensed under a Creative Commons Attribution 4.0 International License. To view a copy of this license, visit
http://creativecommons.org/licenses/by/4.0/
This work is licensed under a Creative Commons Attribution 4.0 International License. To view a copy of this license, visit
http://creativecommons.org/licenses/by/4.0/
| [1] | Lin, J. and Zhou, W., “Role of quercetin in the physicochemical properties, antioxidant and antiglycation activities of bread,” Journal of Functional Foods, 40. 299-306. January.2018. | ||
| In article | View Article | ||
| [2] | Gobbetti, M., Angelis, M.D., Cagno, R.D., Calasso, M., Archetti, G. and Rizzello, G.G., “Novel insights on the functional/nutritional features of the sourdough fermentation,” International Journal of Food Microbiology, 302. 103-113. August.2019.. | ||
| In article | View Article PubMed | ||
| [3] | Graça, C., Fradinho, P., Sousa, I. and Raymundo, A., “Impact of Chlorella vulgaris on the rheology of wheat flour dough and bread texture,” LWT - Food Science and Technology, 89. 466-474. March.2018. | ||
| In article | View Article | ||
| [4] | Cheng, C.W., Hsieh, Z.J., Ho, Y.C., Cheng, Y.F., Wong, Y.R. and Liang, J.Y., “In vitro radical scavenging activity of methanol extracts of red and white flesh Pitaya,” MC-Transaction on Biotechnology, 6(1). 1-12. January.2014. | ||
| In article | |||
| [5] | Wu, L.C., Hsu, H.W., Chen, Y.C., Chiu, C.C., Lin, Y.I. and Ho, J.A., “Antioxidant and antiproliferative activities of red pitaya,” Food Chemistry, 95(2). 391-327. March.2006. | ||
| In article | View Article | ||
| [6] | Leong, H.Y., Ooi, C.W., Law, C.L., Julkifle, A.L., Ling, T.C. and Show, P.L., “Application of liquid biphasic flotation for betacyanins extraction from peel and flesh of Hylocereus polyrhizus and antioxidant activity evaluation,” Separation and Purification Technology, 201. 156-166. August .2018. | ||
| In article | View Article | ||
| [7] | Tenore, G.C., Novellino, E. and Basile, A., “Nutraceutical potential and antioxidant benefits of red pitaya (Hylocereus polyrhizus) extracts,” Journal of Functional Foods, 4(1). 129-136. January. 2012. | ||
| In article | View Article | ||
| [8] | Petra, A., Hana, K. and Jana, R.K., “Health safety issues of synthetic food colorants,” Regulatory Toxicology and Pharmacology, 73(3). 914-922. December.2015. | ||
| In article | View Article PubMed | ||
| [9] | Herbach, K.M., Rohe, M. and Stintzing, F.C. and Carle, R., “Structural and chromatic stability of purple pitaya (Hylocereus polyrhizus [Weber] Britton & Rose) betacyanins as affected by the juice matrix and selected additives,” Food Research International, 39(6). 667-677. July.2006. | ||
| In article | View Article | ||
| [10] | Ho, L.H. and Latif, N.W.B.A., “Nutritional composition, physical properties,and sensory evaluation of cookies prepared from wheat flour and pitaya (Hylocereus undatus) peel flour blends,” Cogent Food & Agriculture, 2(1). 1136369. January. 2016. | ||
| In article | View Article | ||
| [11] | Hsu, C.T., Chang, Y.H. and Shiau, S.Y., “Color, antioxidation, and texture of dough and Chinese steamed bread enriched with pitaya peel powder,” Cereal Chemistry, 96(1). 76-85. February.2019. | ||
| In article | View Article | ||
| [12] | Lim, H.K., Tan, C.P., Karim, R., Ariffin, A.A. and Bakar, J., “Chemical composition and DSC thermal properties of two species of Hylocereus cacti seed oil: Hylocereus undatus and Hylocereus polyrhizus,” Food Chemistry, 119(4). 1326-1331. April. 2010. | ||
| In article | View Article | ||
| [13] | Martins, Z.E., Pinho, O. and Ferreira, I.M.P.L.V.O., “Food industry by-products used as functional ingredients of bakery products,” Trends in Food Science & Technology, 67. 106-128. September. 2017. | ||
| In article | View Article | ||
| [14] | Besseris, G.J., “Taguchi-generalized regression neural network micro-screening for physical and sensory characteristics of bread,” Heliyon, 4(3). e00551. March.2018. | ||
| In article | View Article PubMed | ||
| [15] | Sihombing, H., Hafiz., Yuhazri, M.K. and Kannan, M.Y., “Taguchi’s quality improvement analysis of the sme bread manufacturing,” Global Engineers & Technologists Review, 2(9). 6-18. 2012. | ||
| In article | |||
| [16] | Tsai, P.J, Hong, L.H, Lin, T.C., Chen, I.S., Chen, H.H., Wang, C.Y. and Lin, C.T., “Processing and Storage of Dry-type Candied Mulberry,” Taiwanese Journal of Agricultural Chemistry and Food Science, 42(2). 140-146. April.2004. | ||
| In article | |||
| [17] | Lin, L.Y., Tseng, Y.H., Li, R.C. and Mau, J.L., “Quality of shiitake stipe bread,” Journal of Food Processing and Preservation, 32(6). 1002-1015. December. 2008. | ||
| In article | View Article | ||
| [18] | Ulziijargal, E., Yang, J.H., Lin, L.Y., Chen, C.P. and Mau, J.L., “Quality of bread supplemented with mushroom mycelia,” Food Chemistry, 138(1). 70-76. May. 2013. | ||
| In article | View Article PubMed | ||
| [19] | Shyu, Y.S., Hwang, J.Y., Huang, T.C. and Sung, W.C., “Effect of resistant starch on physicochemical properties of wheat dough and bread,” Journal of Food and Nutrition Research, 6(5). 335-340. May. 2018. | ||
| In article | View Article | ||
| [20] | Vasaf, P.S., Hamdami, N. and, Keramat, J., “Quality and microbial stability of part-baked ‘Barbari bread’ during freezing storage,” LWT - Food Science and Technology, 104. 173-179. May. 2019. | ||
| In article | View Article | ||
| [21] | Gostin, A.I., “Effects of substituting refined wheat flour with wholemeal and quinoa flour on the technological and sensory characteristics of salt-reduced breads,” LWT - Food Science and Technology, 114. 108412. November. 2019. | ||
| In article | View Article | ||
| [22] | Purlis, E., “Simple methods to predict the minimum baking time of bread,” Food Control, 104. 217-223. October. 2019. | ||
| In article | View Article | ||
| [23] | Zhang, L., Putranto, A., Zhou, W., Boom, R.M., Schutyser, M.A.I. and Chen, X.D., “Miniature bread baking as a timesaving researchapproach and mathematical modeling of browningkinetics,” Food and Bioproducts Processing, 100(A). 401-411. October. 2016. | ||
| In article | View Article | ||
| [24] | Paulin, P.P.D., Chevallier S., Pare, A. and Alain, L.B., “Effect of supplementation of wheat bran on dough aeration and final bread volume,” Journal of Food Engineering, 252. 28-35. July.2019. | ||
| In article | View Article | ||
| [25] | Purlis, E. and Salvadori, V.O., “Bread baking as a moving boundary problem. Part 1: Mathematical modelling,” Journal of Food Engineering, 91(3). 428-433. April.2009. | ||
| In article | View Article | ||
| [26] | Bosmans, G.M., Lagrain, B. and Fierens, E., “Impact of Amylases on Biopolymer Dynamics during Storage of Straight-Dough Wheat Bread,” Journal of Agricultural and Food Chemistry, 61(26). 6525-6532. June.2013. | ||
| In article | View Article PubMed | ||
| [27] | Yang, H. and Shit, M., “Research on correlation of starch syrup variety water activity,color and texture of Mochi,” Journal of the Agricultural Association of China, 8(3). 183-193. June.2007. | ||
| In article | |||
| [28] | Zhang, L., Boven, A.V., Mulder, J., Grandia, J., Chen, X.D., Boom, R.M. and Schutyser, M.A.I., “Arabinoxylans-enriched fractions: From dry fractionation of wheat bran to the investigation on bread baking performance,” Journal of Cereal Science, 87. 1-8. May.2019. | ||
| In article | View Article | ||
| [29] | Olojede, A.O., Sanni, A.I. and Banwo, K., “Effect of legume addition on the physiochemical and sensorial attributes of sorghum-based sourdough bread,” LWT - Food Science and Technology, 118. 108769. January 2020. | ||
| In article | View Article | ||
| [30] | Gül, H. and Şen, H., “Effects of pomegranate seed flour on dough rheology and bread quali,” Cyta – Journal of Food, 15. 622-628. June. 2017. | ||
| In article | View Article | ||


