 OPEN ACCESS
  PEER-REVIEWED
Unsupervised Clustering of Images Using Harmony Search Algorithm
Bekoouche Ibtissem1, , Fizazi Hadria1
1Department of Computer Science Laboratory SIMPA,University of Science and Technology of Oran-Mohamed Boudiaf- Faculty of Sciences Oran, Algeria
Abstract
Clustering plays an important role in the image processing. It permits to assign a label to each point of the image from a collection of defined classes. Among the domains that use the clustering, we can mention the Remote Sensing for identification of different regions constituting a satellite image. Evaluation of the clustering algorithm results is based on the validity index. In this paper, we applied the Harmony Search algorithm (HS) for make an unsupervised clustering. Thereafter, we evaluated the performance of this tool by analyzing the results obtained. These results show that the validity index determines automatically the appropriate number of classes that represent an image. The study realized with several validity indices allowed us to find the best validity index to evaluate the performance and robustness of the algorithm HS. The experiences obtained with this algorithm show the effectiveness and performance in the stable clustering for given problem.
At a glance: Figures
Keywords: harmony search, processing of image, unsupervised clustering, validity index
Journal of Computer Sciences and Applications, 2013 1 (5),
pp 91-99.
DOI: 10.12691/jcsa-1-5-3
Received January 18, 2013; Revised June 06, 2013; Accepted June 30, 2013
Copyright © 2013 Science and Education Publishing. All Rights Reserved.Cite this article:
- Ibtissem, Bekoouche, and Fizazi Hadria. "Unsupervised Clustering of Images Using Harmony Search Algorithm." Journal of Computer Sciences and Applications 1.5 (2013): 91-99.
- Ibtissem, B. , & Hadria, F. (2013). Unsupervised Clustering of Images Using Harmony Search Algorithm. Journal of Computer Sciences and Applications, 1(5), 91-99.
- Ibtissem, Bekoouche, and Fizazi Hadria. "Unsupervised Clustering of Images Using Harmony Search Algorithm." Journal of Computer Sciences and Applications 1, no. 5 (2013): 91-99.
| Import into BibTeX | Import into EndNote | Import into RefMan | Import into RefWorks |
1. Introduction
The image itself is unusable in practice, without further processing to make it exploitable. For enjoy correctly and efficiently of the information quality contained in the images, several processing techniques have been developed; among them, we can mention the unsupervised clustering whose objective is to extract the maximum information that exists in an image, in order to represent in form understandable and interpretable [2].
These last years, several methods of unsupervised clustering were appeared. The whole of these methods can be divided into two big classes, of the traditional methods and the bio-inspired methods. The inconvenience of the traditional methods lies in their greediness at the material resources and at the computing time, this is due to their complexity. What makes, a new category of algorithms appeared which is the category of the algorithms bio-inspired. These algorithms reproduce the behavior of the natural systems in order to solve the problems.
This paper used a bio-inspired algorithm: Harmony Search (HS) for the unsupervised classification of images. This metaheuristic algorithm, it has a soft computing technique that resembles the genetic algorithm [12], because it is a stochastic search that prospectively creates new solutions by random combining of the elements present in a population. His object is to get more and more good answers to given problem. The HS algorithm has been applied to various optimization problems of science and technology [9] as: Real applications: ‘Music composition’, Computer science problems: ‘Web page clustering’, Electrical engineering problems: ‘Power system design’ …etc…
The objective of our work is to find the validity index that given the optimal solution can determine the best description of the data structure. Functions of validity indices that are used: XB index proposed by Xie and Beni (1991) [1], FS index proposed by Fukuyama and Sugeno (1989) [4] and DB index by Davies-Bouldin (1979) [11].
Our paper is organized as follows: Section II and III, we present the HS algorithm and its application to clustering. In Section IV we describe the validity indices used. Implementation and results are discussed in Section V. The conclusion is presented in the final section.
2. Harmony Search Algorithm
The Harmony Search algorithm (HS) is relatively has been developed by Z. W. Geem, J. H. Kim et G. Loganathan in 2001 [3] for the optimization problems. It has a soft computing technique that is similar to the genetic algorithm [12] and it has capacity to exploit the new solution proposed (harmony) with the synchronization of the search space at a time with intensification and diversification environmental optimization parallel [10].
The HS algorithm is inspired from the natural phenomenon of the behavior of musicians when they cooperate together to improvise tones (musical notes) of their instruments to get a fantastic harmony [13, 16].
To explain the research of harmony with more detail [6], we must understand the process of improvisation by a skilled musician. When a musician improvises a tune or pitch [5, 6], usually follows one of three rules:
1. Playing any famous pitch exactly from his or her memory
2. Playing a pitch similar to a known pitch.
3. Compose a new pitch with random notes.
By analogy, when each decision variable chosen value in the HS algorithm [7], it follows one of the three rules [8]:
1. Select a value from Harmony memory (HM): defined as "consideration of the memory."
2. Select a value adjacent to a value in HM: defined as "pitch adjustment."
3. Select a value totally random from range possible of values: defined as "randomization".
These three rules of HS algorithm are directed by using the three parameters [7, 10], which are as follows: Harmony Memory Size (HMS), Harmony Memory Considering Rate (HMCR) and Pitch Adjusting Rate (PAR).
The HS algorithm has two steps to improvise a New Harmony: following to one of three rules Presidents and fitness evaluation (validity index).
The optimization procedure of the metaheuristic HS algorithm is summarized in Figure 1.


 PowerPoint Slide
 Larger image(png format)


The HS procedure can be described as follows [8, 13]:
Step 1: Initialization the parameters of problem and algorithm HS (HMCR, PAR…). The initial parameters for algorithm HS are as follows [13]: HMS (ie the number of vectors in the solution of harmony memory), HMCR where HMCR ∈ [0, 1], PAR where PAR ∈ [0, 1] and stopping criteria (ie the number of iterations (IT)).
Step 2: Initialize the harmony memory (HM).
Step 3: Improvisation of a new harmony (solution) according to the following principle (the three rules of the algorithm HS) [10]:
- Selecting a new harmony in HM stock with a probability of the Harmony Memory Considering Rate (HMCR) ϵ [0, 1].
- If it is selected, we varied randomly in a close neighborhood with a probability of the Pitch Adjusting Rate (PAR) ϵ [0; 1], else it is left unchanged.
- If it isn’t selected from the memory then it is generated randomly.
Step 4: Update the harmony memory (HM) except if the New Harmony has the best optimization.
Step 5: Repeat steps 3 and 4 until satisfaction of the stopping criteria.
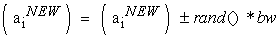
Note: The Parameter PAR means «changing of the frequency" of the music simulated. This means, generate a slightly different value for the composition of the New Harmony vector as in equation. (1). this parameter explores more additional solutions on the search space.
 | (1) |
Here, bw is a bandwidth distance arbitrarily used to improve the performance of the HS, and in this paper it is set to bw = 0,0001 MaxValeur (n); where MaxValeur (n) =255 is the maximum value that can take a pixel and the rand () is a random number generated ϵ [0, 1].
3. Unsupervised Clustering by Harmony Search Algorithm
In this section, we describe how the Harmony Search algorithm addresses the problem of unsupervised clustering.
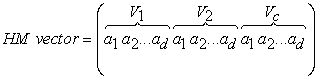
3.1. Representation of Harmony MemoryIn order to choose the representation of cluster centers for HS, each vector harmony memory (HM vector) is a solution of the clusters centers. Each vector has a physical length (c * d) [10] c: is the number of clusters and d: the dimension of the image. The vector of the solution will be as in Equation. (2):
 | (2) |
Where ak is a decision variable ak ϵ A, and A is the set of the possible range of decision variables. For example, if an image has three different regions, that is in 3 dimension (RVG) so three characteristics that describing each pixel, then the possible range of decision variables is between 0 to 255 so the harmony vector could be as (120, 52, 80, 50, 150, 20, 196, 240, 33), wherein (120, 52, 80) represent the values centers of the cluster for the first image region, (50, 150, 20) represent the values centers of the cluster for the second image region, and so on.
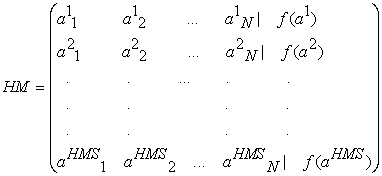
3.2. Initialization Harmony Search AlgorithmAfter the parameters of HMS HS, HMCR, PAR and IN (iterations number) are set, step of the initialization HM takes its turn. Each decision variable in each solution vector in HM will be initialized randomly from its data range. After the HM is filled with initialized solution vectors as in Equation (3), the fitness value will be calculated for each solution vector in HM by HS validity index (as explained in Section 3.4) [10, 12].
 | (3) |
Now after HM is initialized, HS algorithm start working and for each iteration, a new solution vector is generated according to the improvisation strategy in HS until the stopping criterion is reached. Through this process, the fitness value of each new vector will be calculated and compared with the worst fitness value in harmony memory [10, 12].
Hence, if the new vector’s fitness value is better or equal than that worst value in HM, replacement will take place and this new vector will be as a new vector in the HM, otherwise it will be ignored. Once the HS algorithm has met the stopping criterion, the selection of a solution vector is made in HM with minimum validity index value to reach its goal of finding approximately optimal cluster centers.
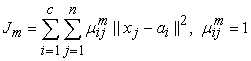
3.4. Objective FunctionThe Objective function is utilized to calculate a fitness of the solution; this value will be used to decide in which measurement the solution will be minimized to the given problem. The HS algorithm minimizes is based on optimizing an objective function Jm, and it is formulated as follows [4, 10]:
 | (4) |
Let X = {x1, . . .,xn} be a data set in an s-dimensional Euclidean space Rs and c be a positive integer larger than one. A partition, n of X into c clusters can be presented using mutually disjoint sets X, . . .,Xc such that X1U … U Xc , {vj}cj=1 are the centers of the classes c , ║·║ designates the Euclidean distance from the data point xi and the centers of the j th class and uik is the membership value of data xk of class ci .
4. Validity Indices
In this section three validity indices are introduced [1, 4, 11]. The objective of indices are used for measuring “goodness” but these indices that we have chose take in consideration two things, the first: inter cluster distance between clusters ai and aj (between center and other center), and the second: intra cluster diameter computed for cluster ai (between center and pixels) because the objective function Jm take just consideration of the second. The following validity indices used:
 | (5) |
(a) The first validity index is XB index proposed by Xie and Beni (1991).
(b) The second validity index is DB index by Davies-Bouldin (1979).
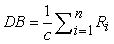 | (6) |
Where
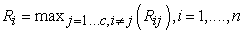 |
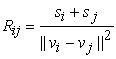 |
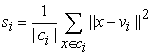 |
(c) The third validity index FS index proposed by Fukuyama and Sugeno (1989).
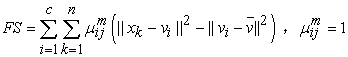 | (7) |
Where xk is the kth data point, vi are cluster prototypes (cluster centers), ci is the number of clusters,  is the grand mean of all data xk , uik is the membership value of data xk of class ci and |ci| is the total amount of data belonging to cluster i.
5. Implementation
For comparing the performance of the new conception of HS algorithm proposed for the unsupervised clustering of images, this section described the images used, the parameters of the algorithm HS, experiences, results and discussions.
5.1. Images UsedThe experiments conducted have been applied on four (4) different images: artificial images and satellite image for better evaluate our proposed algorithm. The first, second and third images are artificial images that contain three, five and two colors respectively (Figure 2).

) PowerPoint Slide
PowerPoint Slide Larger image(png format)
The fourth image is part of a satellite image type LANDSAT5 TM (Thematic Mapper) in the region of Oran West dated 2003 (Figure 3).This study area was chosen for its varied landscape that could present an interest for the evaluation of the HS algorithm.
For the satellite image, our application start by loading three images corresponding to the three channels TM1 TM3 and TM4. In order to use these images, the program performed a colored composition by associating to blue filter to channel TM1, green filter to channel TM3 and red filter to channel TM4 (Figure 3).

 PowerPoint Slide
 Larger image(png format)
In order to get the best optimization results by HS algorithm for unsupervised clustering, the selection of parameter values of the algorithm is important, because these parameters can seriously affect the performance of the algorithm.
To set the maximum number of classes of our algorithm, we estimated the number of classes constituting in a visual way the image and then we add two (2). Consequently, the choice of parameters related to HS: HMS, HMCR, PAR and IT (Iterations number), it is a very important step.
As a first test of our HS algorithm, the parameters of the image 1 (Figure 2) were fixed as following: the number of classes to 5 (nclasses=5), the iterations number to 1 (IT=1) and the size of the harmony memory to 20 (HMS=20), but the values of other parameters (HMCR, PAR) are selected the empirical basis of the suggestions provided in [6, 10]: the recommended range for harmony memory considering rate (HMCR) between [0.7, 0.9] and the pitch adjusting rate (PAR) between [0.1, 0.5], then we have fixed randomly the value of HMCR to 0.7 (HMCR=0.7) and PAR to 0.2 (PAR=0.2). The result is given in Table 1 and images result shown in Figure 4.
The first line of Table 1 shows that the classes constituting the image 1 are recognized correctly, depending to the number of clusters detected and is equal to 3. To better analyze the parameters of the HS algorithm, another test is made on image 1, with the addition of noise (Figure 4): the Gaussian noise and we have kept the same parameters test on image 1 noised. The result is given also in Table 1 and images result shown in Figure 4 too.
Table 1. Results of unsupervised clustering on image 1 by HS algorithm (IT=1, HMS=20, HMCR=0.7, PAR=0.2)

) PowerPoint Slide
PowerPoint Slide Larger image(png format)
 View current table in a new window
) PowerPoint Slide
PowerPoint Slide Larger image(png format)
The second line of Table 1 shows that the number of clusters constituting the image 1 noise is recognized correctly too.
For better analyze the parameters and optimize the performance of the HS algorithm for unsupervised clustering of images, in the first group of tests, we have going a study of the algorithm by: varying each time a parameter and set the other, to assess their contribution to the quality of the clustering. First vary the values of the number of iterations (IT) (1, 3, 5, 10, 20, 50, 100, 200) and set the other as the first experiment (HMS=20, HMCR=0.7, PAR=0.2), afterwards varying the values of the harmony memory size HMS (1, 5, 10, 20, 30, 50, 80, 150, 230) and set the other to (IT=10, HMCR=0.7, PAR=0.2), after varying the values of HMCR (0.1, 0.2, 0.3, 0.4, 0.5, 0.6, 0.7, 0.8, 0.9) and fixed (IT = 10, HMS = 20, PAR = 0.2), and finally changed values PAR (0.1, 0.2, 0.3, 0.4, 0.5, 0.6, 0.7, 0.8, 0.9) and fixed (IT = 10, HMS = 20, HMCR = 0.7). The best results of each test obtained are summarized in the table below (Table 2).
The purpose of studying the HS algorithm parameters one by one, is to try to understand the usefulness of choosing values, because as we can see that the random choice of parameters affects the results of classes recognized in the image. According to the results presented in Table 2, the conclusion is that with the minimum value of the fitness in each test group, the best value of the parameters that produce the most optimal results are: the number of iterations (IT) is 200, the size of HMS is 20, the HMCR and PAR are (0.9, 0.1) respectively. We also note that each parameter of the algorithm has a range of choices that contribute to the quality of clustering: IT [100.400], HMS [20, 150] HMCR [0.7, 0.9] and PAR [0.1, 0.4].

 PowerPoint Slide
 Larger image(png format)
 View current table in a new window
For the second group of tests on the image 2, the parameter IT is varying (50, 100, 200), determine the number of classes to 7 (nclasses=7) and for the other parameters according to the best result for the clustering of artificial image 1 of three clusters (Table 2): HMS 20, HMCR 0.9 and PAR 0.1. The different results obtained are summarized in the table below (Table 3) and images result shown in Figure 5.
According to the results presented in Table 3, there exists some confusion, because some pixels are misclassified, we can observe in the column numbers of pixels in each class recognized (in test 1 and 2), this confusion was caused by the number of iterations selected, but in the last test image is good classified. So, it confirm that the values of parameters for the HS algorithm give for clustering an artificial image of 3 clusters, can classify an image of five clusters. Also, these experiments confirm that the best values of the HS algorithm parameters are: the number of iterations (IT) is 200, the size of HMS is 20 and the HMCR and PAR that produce the best results are optimal (0.9, 0.1) respectively, for artificial image of 3 to 5 classes.
Table 3. Results of the unsupervised clustering on image 2 by HS algorithm (HMS=20, HMCR=0.9, PAR=0.1)

) PowerPoint Slide
PowerPoint Slide Larger image(png format)
 View current table in a new window
 PowerPoint Slide
 Larger image(png format)
The objective of these experiments that was made is to measure the quality of our HS algorithm proposed for the unsupervised clustering of images. However, the method as described raises an important question "how we can choose the objective function?", for this we have did different tests using three indices of validity XB, FS and DB (explained in section 4).
As a first test of our algorithm HS for better analyze the validity indices, the parameters for optimize performance of the algorithm on unsupervised clustering of images, the different tests on image 3 (Figure 2) are applied by varying the parameter IT (20, 50, 100, 200) and fix the number of clusters to 4 (nclasses=4). But for the other parameters we have fixed according to the best result obtained by HS algorithm for unsupervised clustering of an artificial image of 3 and 5 clusters and also according to parameters chose in paper [14]: HMS = 20, HMCR= 0.9 and PAR = 0.1. The results obtained of the different tests on image 3 are summarized in the table below (Table 4).

 PowerPoint Slide
 Larger image(png format)
 View current table in a new window
According to the basis of results for the unsupervised clustering on image by the HS algorithm showing in Table 4, we observed that in the first test (IT = 20) on image 3 when the algorithm uses indices DB and FS, it gives better solution compared when it using indices Jm and XB, because number of classes recognized (nclasse =2). But in the second test, when the algorithm uses the validity indices: DB and FS, the image is well classified (number clusters = 2) with a minimal fitness value. If we also compare the execution time between indices DB and FS, we see that FS is the best. So these experiments confirm that the validity index is very important to the algorithm HS for the unsupervised clustering, because when the algorithm used FS index, it has the better performance compared when it used the others validity indices in: the unsupervised clustering, the number of iterations and the execution time. It also confirm that the parameters values of the HS algorithm provide for the unsupervised clustering of artificial image of 3 and 5 classes (section 5.2) and to from article [14], it could have classified a synthetic image of two classes. So from these experiments that the best value of HS algorithm parameters are: HMS size is 20, the PAR and HMCR that produce the most optimal results are (0.9, 0.1) respectively.
The objective of the second experiments is to measure the quality of our HS algorithm proposed for the unsupervised clustering of satellite images, our first satellite image (Figure 3,) contains four different classes (Sea, Surf, Sand and bare soil and Urban) .
Table 5 shows four cases of experiments. These experiments are the best results obtained somewhat taken for each validity index using (Jm, XB, DB and FS). The parameters are fixed to: HMS = 20, HMCR = 0.9, PAR = 0.1, like testes in the Table 3 and 4 and according to the paper [15], but it has a simple change just in the number of iterations. The different results obtained are summarized in the table below (Table 5) and images result shown in Figure 6.

 PowerPoint Slide
 Larger image(png format)
 View current table in a new window
 PowerPoint Slide
 Larger image(png format)
From Table 5 and Figure 6, we can see that the validity index impulse the results obtained, because the choice of the best solution harmony optimal returns the index of validity. We note from these experiences that the best result is given by FS index. However, and despite the increase in the recognition rate (Visual) in the fourth experiment of the FS index, we remark that small confusion persist and primarily in the urban class (Orange) because our algorithm has detected that there are 5 classes: class Sea (Yellow, 7650 pixels), class Surf (Red, 513 pixels), Sand and bare soil (Green, 1216 pixels) and Urban (Orange, Rose and 543 pixels, 78 pixels).
So the experiments showing in Table 4 and Table 5 confirmed that the FS index has the better performance compared to other for unsupervised clustering the images artificial and satellite.
After these results in Table 4 and Table 5, our HS algorithm with Jm index and FS index are applied on a larger satellite image type LANDSAT5 TM (Thematic Mapper) in the region of Oran West dated 2003, this image contains ten different classes (Sea, Surf, Sand and bare soil, Cereals, Fallow, Urban, Field burning, Maquis, Foret, mariachis) for doing a compassion between us on the unsupervised clustering. About the parameters of the algorithm, we have kept the same parameters as the precedent image (HMS = 20, HMCR = 0.9, PAR = 0.1), we have just changed the number of iterations. These experiments are the best results obtained somewhat taken for each validity index using (Jm and FS). The result is summarized in the table below (Table 6).

 PowerPoint Slide
 Larger image(png format)
 View current table in a new window
To evaluate our approach, the results are compare with the actual image area (because we know this area) and these following images show that, the quality of the unsupervised clustering using the HS algorithm with FS index is a very good rate of visual recognition according to the result obtunded with Jm index, but we note that there is little confusion and principally at the Field burning class (Orange, 4260 pixels and Light Blue, 230 pixels) and Urban (Brown, 2539 pixels and Bordeaux, 308 pixels).
From these results, the conclusion is that we can trust in this new conception of HS algorithm to treat other unknown scene and retrieve information.
We note also based on these experiments (artificial images 1, 2, 3 and Satellites image 1, 2), there are four parameters that control the execution time and the quality of unsupervised clustering of the HS algorithm: the validity index selected, the number of iterations, the image size and the size of the solution vector (number of cluster centers).
6. Conclusion
After applying the Harmony Search algorithm to the unsupervised clustering of the images content (artificial and satellite), we noticed that the use of the FS validity index has increases the performance of the algorithm for unsupervised classification, and this has allowed to give new conception of the algorithm by: quality in the execution duration and the visual recognition rate in image artificial and satellite. Also we can say we can say that we can trust in this new conception of HS algorithm to treat other unknown scene and retrieve information.
We conclude that the choice of the validity index is very important, because it affects in significative way the results.
On the other side, the comparison of results obtained by the new conception of the Harmony Search algorithm in run time and quality of unsupervised clustering of two images satellite, conclude that there are four parameters that affect: number of iterations, the validity index selected, the image size and the size of the solution vector.
Finally, the new conception of the HS algorithm proposes for unsupervised classification of satellite and artificial imagery gives inspiration for future work and research.
References
| [1] | M. Ramze Rezaee, B.P.F. Lelieveldt, J.H.C. Reiber: A new cluster validity index for the fuzzy c-mean, Elsevier, Pattern Recognition Letters 19 _1998. 237-246. | ||
 In article In article | |||
| [2] | O. Pony, X. Descombes et J. Zerubia “ Classification d’images satellitaires hyperspectrales en zone rurale et périurbaine”, INSTITUT NATIONAL DE RECHERCHE EN INFORMATIQUE ET EN AUTOMATIQUE, N 4008, Septembre 2000. | ||
| In article | |||
| [3] | Z. W. Geem, J. H. Kim, and G. Loganathan, “A new heuristic optimization algorithm: harmony search.” Simulation 76 (2) (2001) 60-68. | ||
| In article | CrossRef | ||
| [4] | K.L. Wu, M.S. Yang, “A cluster validity index for fuzzy clustering”, Available online at Science Direct from 19 December 2004, Pattern Recognition Letters 26 (2005) 1275-1291. | ||
| In article | CrossRef | ||
| [5] | M. T. Ayvaz, “Simultaneous determination of aquifer parameters and zone structures with fuzzy c-means clustering and meta-heuristic harmony search algorithm” Advances in Water Resources. Vol. 30, no. 11 pp. 2326-2338, 2007. | ||
| In article | CrossRef | ||
| [6] | X.-S. Yang, Music-Inspired Harmony Search Algorithm, SpringerVerlag, 2009, ch. “Harmony Search as a Metaheuristic Algorithm”, pp. 1-14. | ||
| In article | |||
| [7] | A. Belmadani, L. Benasla and M. Rahli, “Etude d’un dispatching economique environnemental par la method Harmony search”, Mediamira Secience Publisher, 2009. | ||
| In article | |||
| [8] | P. Chakraborty, G. Ghosh Roy, S. Das and D. Jain, “An Improved Harmony Search. Algorithm with Differential Mutation Operator”, Fundamenta Informaticae, 2009. | ||
| In article | |||
| [9] | Z. W. Geem, “State-of-the-Art in the Structure of Harmony Search Algorithm”, Environmental Planning and Management Program, pp. 1-11, 2009. | ||
| In article | |||
| [10] | O. M. Alia, R. Mandava and D. Ramachandram, “Harmony Search-based Cluster Initialization for Fuzzy C-Means Segmentation of MR Images”, TENCON 2009. | ||
| In article | |||
| [11] | Hashimoto, W., Nakamura, T., and Miyamoto, S.: Comparison and Evaluation of Different Cluster Validity Measures Including Their Kernelization, Journal of Advanced Computational Intelligence and Intelligent Informatics, Vol.13 No.3, 2009. | ||
| In article | |||
| [12] | Y. Tak Ma, “A Replication of Harmony Fuzzy Image Segmentation Algorithm” Artificial Neural Networks, 2011. | ||
| In article | |||
| [13] | O. M. Alia and R. Mandava “The variants of the harmony search algorithm: an overview”, ComputerVision Research Group, School of Computer Sciences,University SainsMalaysia, 2011. | ||
| In article | |||
| [14] | I. BEKKOUCHE and H. FIZAZI, “ Conception d’une méthode bio-inspirée ‘Harmony Search ’ pour les traitements des images satellitaires’, the International Conference on New Technologies and Communication, University Hassiba Ben Bouali, Chlef, Algeria, 05 décembre 2012. | ||
| In article | |||
| [15] | I. BEKKOUCHE and H. FIZAZI, “New conception of algorithm ‘Harmony Search’ for the unsupervised clustering of images”, 1st Conference on Theoretical and Applicative Aspects of Computer Science, University 20 August 1955 - Skikda, Algeria, 25 et 26 décembre 2012. | ||
| In article | |||
| [16] | Z. W. Geem and J.Y. Choi, “Music Composition Using Harmony Search Algorithm”,. In: Giacobini M (ed) Applications of evolutionary computing. Springer, Berlin, pp 593-600, 2007. | ||
| In article | |||

 CiteULike
 Delicious

