In recent years, the degree of air pollution and climate change caused by greenhouse gases has become more and more serious, and the greenhouse gases emitted by various countries have continuously aggravated the global greenhouse effect. As a result, the United Nations and governments have drawn up plans and laws to control greenhouse gas emissions strictly. Many international organizations are also investing in greenhouse gas reduction programs, and many countries will have to consider greenhouse gas emissions data if they want to receive subsidies from the United Nations or investments from financial unions in the future. This study intends to analyze the economic and greenhouse gas emission reduction efficiency of OECD member states through the two-stage data envelopment analysis method. The results show that only four countries have a total efficiency score of more than 0.5, Estonia, Iceland, Latvia, and Luxembourg. Among the four countries, only Estonia and Latvia have national economic efficiency and greenhouse gas emission reduction efficiency above average. In contrast, Iceland and Luxembourg have national economic efficiency far above greenhouse gas emission reduction efficiency. Conversely, Latvia is the most efficient of the four countries in reducing greenhouse gases. The results of this study will provide a reference for the United Nations and international organizations to promote global greenhouse gas emission reduction.
Emissions of Greenhouse gas (GHG) from fossil fuels reached their highest level since the 19th century in 2019, putting the commitments set out in the 2015 Paris Agreement in jeopardy 1. Greenhouse gas emissions are also one of the factors contributing to climate change, causing extreme weather changes (floods, droughts, storms, etc.), rising sea levels, changing crop growth, and damaging water supply systems 2. Greenhouse gases will also cause air pollution, respiratory diseases, the disappearance of some species, and changes in typical living habits 3. During the 26th UN Climate Change Conference in 2021, more than 40 countries signed Glasgow Breakthroughs. Governments, businesses, and cities worked together to achieve climate change targets in energy, transport, agriculture, steel, and other industries 4. The Glasgow Financial Alliance for Net Zero (GFANZ), which has signed up to sustainable Finance principles to assist global net zero development, to assist in investing in global economies to transition to clean energy, and to include carbon emissions in customers' KPIs, when making loans or investments, the carbon data of customers or investment targets will be taken into consideration for credit. The World Bank is expected to launch a trust fund at the 27th Climate Change Conference to provide financial subsidies to developing countries that meet pre-negotiated outcomes in reducing greenhouse gas emissions. In order to achieve carbon neutrality, reduce greenhouse gas emissions, and transition to clean energy in the future, countries will have to focus on carbon reduction strategies to obtain more investment from banking institutions or additional subsidies successfully. Therefore, this study's primary motivation is to comprehensively compare greenhouse gas emission reduction efficiency between countries through efficiency assessment methods.
In the relevant research on greenhouse gas emissions, 5 discussed the carbon footprint of carbon crops and agricultural management. 6 studied the impact of economy and energy on greenhouse gas emissions in China and the United States. 7 examine how climate finance impacts renewable energy. 8 tried to calculate how shared bikes affect greenhouse gas emissions. 9 conducted environmental efficiency assessment of major Asian economies through Data Envelopment Analysis (DEA). 10 evaluates ecological benefit indicators of EU countries by using a two-stage DEA model. 11 Using DEA to assess energy, environmental, and economic efficiency in the top 20 industrial countries. Due to the mature development technology of DEA, many fields have conducted efficiency analysis through DEA. Therefore, this study will adopt the data envelopment analysis method to analyze different countries' greenhouse gas emission reduction efficiency.
The Organization for Economic Cooperation and Development (OECD) was founded in 1961 and has 38 member countries. The OECD brings together governments, policymakers, and citizens to establish evidence-based international standards, from the polluter pays principle to crack down on tax evasion. The main work is research and analysis, emphasizing respect for market mechanisms, reduction of government intervention, and transnational intergovernmental economic cooperation and development through policy dialogue. In this study, variables related to the economy and greenhouse gas emissions of OECD member countries will be collected to analyze the efficiency of the two-stage data envelopment analysis. By understanding the analysis results of the first-stage economic efficiency and the second-stage greenhouse gas emission reduction efficiency of OECD member countries, we provide comprehensive reference and investment help for the UN and investment institutions.
According to the U.S. Environmental Protection Agency (EPA), gases that trap heat in the atmosphere are called greenhouse gases. It contains carbon dioxide (CO2), methane (CH4), and nitrous oxide (N2O) 12. Carbon dioxide is one of the most important greenhouse gases, accounting for 3/4 of greenhouse gas emissions. It can linger in the atmosphere for thousands of years and is also the main culprit of climate change 3. According to 2, greenhouse gas emissions were very low before the Industrial Revolution. Until 1950, the annual carbon dioxide emissions were 6 billion tons, and the emissions doubled to 22 billion tons in 1990. World emissions are now 34 billion tons a year. If carbon dioxide emissions are compared by country and region, until the 20th century, global emissions have been dominated by Europe and the United States. In the second half of the 20th century, emissions in other parts of the world increased significantly, especially in Asia, especially China 2.
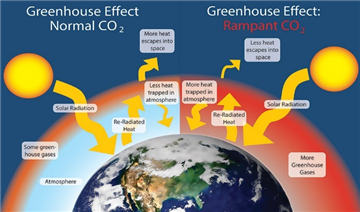
Increased emissions of greenhouse gases also contribute to the greenhouse influence, which traps heat in the atmosphere and warms the earth, allowing it to stay warmer over time than when the sun is directly in the air. The greenhouse effect is also the key to maintaining the earth's vitality. Without the greenhouse effect, the average temperature of the earth would be reduced, and many life forms created on the earth would not be able to appear. However, an unchecked continuation of global warming will lead to significant climate change, such as rising sea levels, increased ocean acidification, life-threatening weather events, and other severe natural and social impacts 13. A picture of the natural and artificial greenhouse effect is shown in Figure 1.
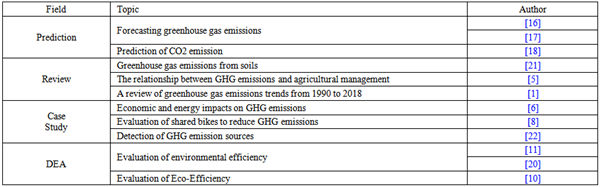
2.2. Greenhouse gas emission reduction and efficiency analysisThere is much research on greenhouse gases. Early research mainly investigated and studied greenhouse gas emissions through correlation, quantitative, and other data analyses 14, 15. 16 and 17 used Grey Theory and time series to predict carbon emissions. 18 used neural networks (NN) and multiple linear regression (MLP) to predict agricultural carbon. In the case study, 19 discussed the impact of the economy and greenhouse gas emissions in China and the United States. The results showed that economic factors impacted China and the United States slightly differently. Economic factors in China led to increased greenhouse gas emissions, while greenhouse gas emissions in the United States decreased. 8 studied whether bike-sharing in Shanghai, China, could curb part of greenhouse gas emissions. The research results showed the environmental benefits of bike-sharing and provided a valuable reference for improving urban transportation systems and developing sustainable cities.
11 tried to analyze the environmental efficiency of the top 20 countries with carbon emissions through DEA. They found that Australia, China, Japan, and other countries are the countries with the best energy efficiency and found that most countries have higher performance in economic efficiency than in environmental efficiency. 20 established an undesirable output model through DEA to measure the efficiency of the top 20 economies in Asia. The result showed that Japan was a sustainable development model that considered economic development and environmental protection at the same time. 10 assessed the evolution of ecological efficiency in 27 countries of the European Union and found that Ireland had the lowest greenhouse gas emissions and polluting gases. Table 1 shows the research on global greenhouse gases.
2.3. Data Envelopment AnalysisDEA method is behind linear mathematical programming, which is a decision-making tool used to measure the relative production efficiency between decision units (DMUs), estimate production boundaries, and evaluate the efficiency of DMUs, and can be used to evaluate the efficiency analysis of multiple inputs and outputs in a decision unit.
DEA was proposed by 23. Let and
and  , have input of ith and output of rth, there are jth DMU,
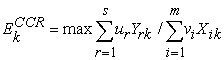
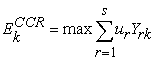
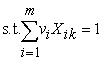
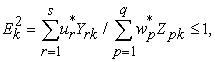
  . Under the assumption of constant returns to scale, the CCR model of DEA to measure the relative efficiency of DMU k is:
 | (1) |
 |
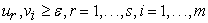 |
 is the efficiency of DMU k,
  and
and  are the multipliers associated with the rth output and the ith input,
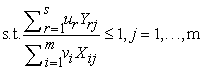
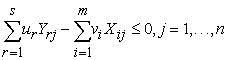
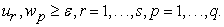
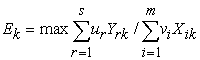
  is a small non-Archimedean number, 24 In order to prohibit each DMU from assigning zero weight to adverse input/output factors, adjust the model into a fractional linear program (fractional linear program), to transform into the following linear program:
 | (2) |
 |
 |
 |
DEA allows multiple inputs and outputs to be considered simultaneously without making any assumptions about data distribution. DEA models can be subdivided into input-oriented models, which minimize input while at least satisfying a given output level, and output-oriented models, which maximize output without requiring more input values 25. In each case, efficiency is measured regarding proportional changes in input or output. With the development and maturity of DEA technology, there are many studies on efficiency analysis through DEA in many fields, such as the efficiency measurement of insurance companies 26, traffic data analysis 27, Efficiency analysis of Balanced corporate scorecard 28 and efficiency evaluation of technological innovation 29.
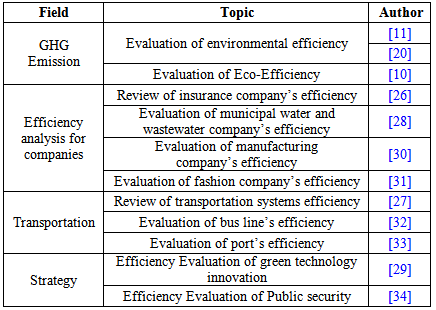
In addition to the efficiency of greenhouse gas emissions, DEA is also applied in other fields. 26 discussed the studies on insurance company analysis using DEA from 1993 to 2018 through a literature review and found that there were few published studies on DEA application in the 1990s, but observed that DEA-related applications reached a peak after 2010. In this study, other research related to DEA in recent years is integrated into Table 2. 28 ranked Iranian water supply companies' efficiency using grey correlation analysis and DEA and analyzed the efficiency from an output-oriented perspective. 30 believe that with the increasing amount of data in the real world, a large amount of calculation is required for efficiency. Therefore, DEA is combined with Machine Learning and efficiency analysis is carried out based on Chinese manufacturing listed companies in 2016. 31 determines import and export variables by the Delphi method and then studies the efficiency of fashion retail stores in Ho Chi Minh City, Vietnam, through the DEA. 27 reviewed the studies on applying DEA to the efficiency analysis of transportation systems from 2007 to 2018 through a literature review and concluded that DEA is one of the most valuable methods considered by the decision-makers of transportation systems. 32 pointed out that Bus Lines are the most important public transport system in many cities, but Bus lines are usually less efficient than other lines. 33 analyzed the efficiency of 22 harbors in Vietnam through DEA and concluded that scale and management skills were the primary sources of efficiency. In the strategy field study, 29 analyzed green technology innovation in China's emerging industries from 2004 to 2015 through DEA and Malquist Productivity Index. 34 Strengthening public safety systems is essential considering the increasing trend of violence in Mexico, so they investigated the technical efficiency of public safety systems in 1,730 Mexican cities through a two-stage data Enveloping analysis (DEA). The results show significant differences in technical efficiency between regions and cities. These studies have repeatedly proved the excellence of DEA in efficiency analysis.
Due to covid-19, many research data are flawed and incomplete; the complete sources for this study can only be taken from the latest and most complete OECD 2020 (https://data.oecd.org/) and The Global Economy (https://www.theglobaleconomy.com/), public information (Open Data) database, respectively is introduced as follows.
The OECD (Organization for Economic Co-operation and Development) is an international organization of 38 countries that aims to promote economic growth, employment, and sustainable development. The OECD Database (https://data.oecd.org/) is an online resource of economic, social, and environmental indicators, providing a wealth of statistical data and policy analysis from OECD member countries. The OECD database contains over 80,000 indicators covering many topics, including the economy, trade, Labor market, education, environment, energy, health, science and technology, and social welfare. These indicators are typically presented in a time series format, allowing users to make long-term trends and cross-country comparisons. The OECD database offers a variety of data file formats, including tables, charts, and maps, and users can customize queries and filtering criteria for different needs and purposes. In addition, the OECD database provides data download and sharing functions to facilitate the use of data for research, policy development, and reporting purposes.
The Global Economy (https://www.theglobaleconomy.com/) is a website that provides global economic data and national economic indicators. The website combines economic statistics from countries worldwide and provides an intuitive and easy-to-use platform for understanding and comparing the economic situation of different countries and regions. The Global Economy website contains over 4,000 economic indicators covering various topics, including gross domestic product (GDP), employment, inflation, trade, finance, energy, and demographic and social indicators. These indicators are typically presented in a time series format, allowing users to make historical trends and country comparisons. Users can conduct custom queries and filters and download data and charts for further analysis and use. The Global Economy website is a valuable resource for understanding the state of the global economy, comparing national economic performance, tracking economic trends, and supporting researchers, policymakers, businesses, and academia in economic analysis, business decision-making, and policy research.
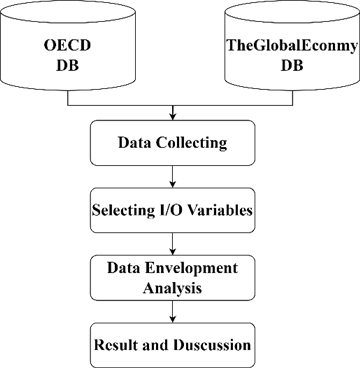
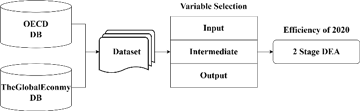
This study collected variables related to greenhouse gas emissions and the economy through a literature review, determined the input and output variables of the two-stage DEA model, and then analyzed the efficiency and overall efficiency of OECD member states at each output stage through the two-stage DEA. The research process of this study is shown in Figure 2.
This study adopted a literature review to determine the output and input variables of DEA. 11 pointed out that GDP is produced by labor, capital, and energy consumption and will produce carbon dioxide emissions. Therefore, this study adopts a two-stage DEA for efficiency analysis of OECD member states. The first stage is economic efficiency. According to 11, in the process of measuring national or regional environmental efficiency or energy efficiency, Both energy consumption and population are used as inputs to produce desirable and undesirable outputs; therefore, when conducting environmental, economic efficiency, the Openness index and GDP should be regarded as the ideal output, while CO2 emission should be regarded as the undesirable output. 9 ranked global cities through economic performance, climate change mitigation, and DEA, using population as the input variable, GDP as the ideal output, and greenhouse gas emission as the non-ideal output. 10 explores the relationship between greenhouse gas emissions and ecological efficiency for EU member States through DEA, taking labor, energy, and electricity use as inputs, GDP as ideal output, and greenhouse gas emission as non-ideal output. 35 conducted an ecological efficiency assessment through a life cycle assessment combined with DEA, in which input variables included fossil fuels (diesel, gasoline, etc.). The input and output variables of the two-stage DEA adopted in this study, and the original references are shown in Table 3.
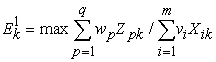
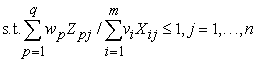
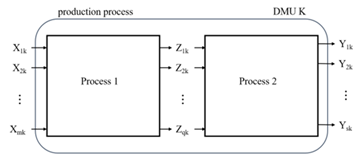
The two-stage DEA proposed by 36 is adopted as the efficiency analysis method in this study. It is assumed that the overall production process consists of two sub-processes, shown in Figure 3. The overall process uses m inputs and and produce the output of s and
  . Instead of a traditional one-stage production process, the production process here consists of two sub-processes, q is intermediate products
  . Intermediate product
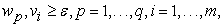
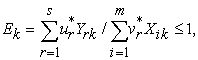
  is the output of the first stage and the input of the second stage, the equations for the model efficiency
  of the first stage and the model efficiency
  of the second stage are as follows:
 | (2a) |
 |
 |
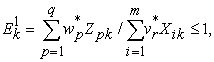
 | (2b) |
 |
 |
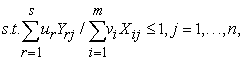
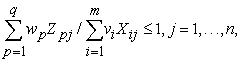
The essence of the two-stage model is similar to that of the original model (1) in that the efficiency is calculated independently. In order to connect the two-stage models with the whole process, there must be a model to describe the series relationship between the whole. Considering DMU k, the equations representing symbols  and
and  as multipliers selected by DMU k to calculate its overall comprehensive efficiency
  and two-stage model efficiencies
  and
and  are:
are:
 | (3) |
 |
 |
The overall efficiency is multiplied by the efficiency of the two substage models:
 | (4) |
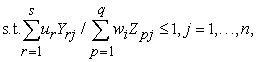
Based on this concept, the calculation method of the comprehensive efficiency  , considering the series relationship of the two sub-stage models, incorporates the constraint relationship of the two sub-stage models into the model as follows (5)
 | (5) |
 |
 |
 |
 |
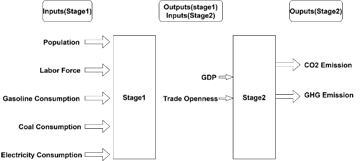
This study attempts to analyze the efficiency of greenhouse gas emission reduction of OECD member States through the two-stage DEA. The two-stage DEA analysis scenario is shown in Figure 4. This study integrates variables collected by the OECD and the GlobalEconomy database into the research data set. In the pre-processing of the data set, the linear interpolation method of SPSS 25 was used in this study to fill in the missing values, and the numerical value of greenhouse gases with non-ideal output was carried out in the way of reciprocal efficiency analysis 8.
The efficiency in the first stage of this study is economic efficiency. A country improves its economy by consuming labor and energy (gasoline, coal, and electricity). A rise in GDP means that people consume more, create more job opportunities and pay more taxes. If GDP falls, the economy shrinks, and recession may mean wage freezes and job losses. However, GDP growth also increases greenhouse gas emissions 11. The increase in greenhouse gas emissions leads to increased extreme weather events threatening property and life. In the study's second phase, greenhouse gas reduction efficiency, fossil fuels continued to dominate the global energy mix in 2019, even as wind and solar recorded record growth rates, Renewable energy will still only account for 11% of global energy consumption in 2019. Greenhouse gas emissions will increase rapidly as economies and communities open up in the future 37. Although the United Nations is pushing for a global reduction in greenhouse gas emissions, it remains to be seen how effective it will be.
This study developed a two-stage network DEA model connecting economy and greenhouse gas emission reduction, which combined population, labor force, and energy consumption with GDP and Trade Openness as the economic efficiency in the first stage. At the same time, the output of the first stage is also the input of the second stage, so the input of GDP and trade openness, output carbon emission, and greenhouse gas emission are the second stage's greenhouse gas emission reduction efficiency. The input and output of each stage in this study are shown in Figure 5.
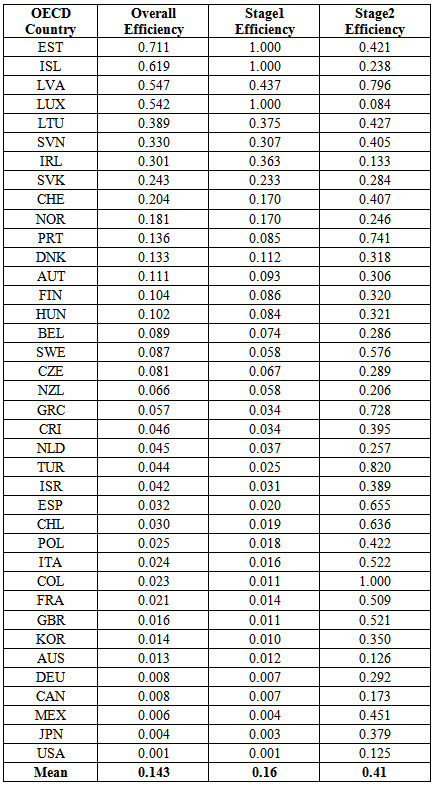
In this study, Lingo 20 was used as A software development tool. The input and output variables of the two-stage DEA efficiency analysis are shown in Table 3. The data source was 2020, the narrative statistics of input and output variables are shown in Table 4.
In this study, Lingo 20 software was used to write a two-stage DEA efficiency analysis program. The results of the two-stage DEA efficiency analysis for OECD member States are shown in Table 5. The results showed that only four countries had a total efficiency score of more than 0.5, Estonia (EST), Iceland (ISL), Latvia (LVA), and Luxembourg (LUX), respectively. Among these four countries, only Estonia (EST) and Latvia (LVA) have higher economic efficiency and greenhouse gas emission reduction efficiency than the average of their stage efficiency (0.16, 0.41). Iceland and Luxembourg are far more economically efficient than they are in reducing greenhouse gases. Latvia was the most efficient of the four countries in reducing greenhouse gases. The following is a brief speculation and discussion on these four countries.
Estonia (EST) is a high-income economy in Europe. According to the survey of the free trade index (https://www.heritage.org/index), Estonia's economic freedom scores 80, and the economic index in 2022 ranked seventh. Estonia ranks fourth out of 45 countries in the European region, with a composite score above the regional and world average, coupled with an independent judicial structure and effective mechanisms to investigate and punish isolated cases of abuse and official corruption. Latvia has an economic freedom score of 74.8, placing its economy 18th in the 2022 index. Estonia's success in economic efficiency and greenhouse gas emission reduction can be attributed to the following reasons:
1. Estonia's energy industry has traditionally been dominated by oil shale and petroleum. However, with technological advances and policy support, Estonia has shifted to more environmentally friendly forms of energy, such as natural gas and renewable energy sources. This transition has allowed Estonia to reduce greenhouse gas emissions while sustaining economic growth.
2. Estonia has a well-developed public transport system and a high acceptance of non-motorized modes of transport, such as cycling and walking, which reduces the frequency of car use and environmental pollution.
3. The Estonian government encourages businesses and people to reduce greenhouse gas emissions through green taxes and subsidies. In addition, Estonia has effectively reduced its greenhouse gas emissions through measures such as establishing a carbon emissions trading system.
4. Estonia's economic development is mainly based on the knowledge-based economy, such as the high-tech and information technology industries, which also help reduce environmental pollution and balance economic development and environmental protection.
For all these reasons, Estonia has achieved the dual advantages of economic and greenhouse gas reduction efficiency and has made many achievements in the green economy and sustainable development.
38 mention that the widespread adoption of District heating (DH) in Estonia offers the most effective opportunity at the national level to achieve energy efficiency, increase the share of renewable energy and reduce CO2 emissions. 39, regarding the sustainable development of the energy sector in Bulgaria, Czech Republic, Estonia, and Poland from 2008 to 2022, considers the importance of raising environmental taxes and the reform of the EU Emissions Trading System as critical tools for economically and effectively reducing greenhouse gas emissions.
Iceland (ISL) is a small island country. In terms of economic efficiency, Iceland has developed a robust renewable energy industry, including thermal power generation, wind power generation, and geothermal heating, through its abundant geothermal and hydraulic resources. This makes energy cheap in Iceland, and most of it comes from renewable sources, making Iceland economically efficient. In addition, Iceland's fishery, tourism, and other industries also have relatively stable development.
According to the research of 40, Iceland is regarded as the future case of a high-consumption and green region in the world. However, its carbon footprint covers the world through the supply chain of imported products (about 71% of household emissions are attributed to imported goods). As a result, the overall carbon footprint of Iceland is still very high even if the decarburization of fixed energy is carried out. However, Iceland is an example of a few countries that have completed the energy transformation, and its greenhouse gas emission reduction efficiency may be improved in the future. According to the data from the European Union, Iceland is also one of the first countries to ratify the Paris Agreement. It plans to reduce its greenhouse gas emissions by 40% compared with 1990 levels in 2030 41. The reasons for Iceland's improved greenhouse gas emission reduction efficiency in the future are as follows:
1. Iceland's energy sources mainly come from renewable sources, such as geothermal and hydropower. As a result, Iceland generates energy in a relatively environmentally friendly way and relies less on fossil fuels for energy production and use.
2. There are a considerable number of electric vehicles in Iceland, and the use of these vehicles has made a significant contribution to reducing greenhouse gas emissions.
3. Iceland's relatively small agricultural and industrial production also means there is less pressure to cut emissions.
4. The Icelandic government actively promotes energy and environmental policies. For example, by establishing the Green Foundation and other policy measures, it actively supports and promotes the development of the environmental protection industry and technology and encourages people and enterprises to participate in emission reduction actions actively.
Latvia (LVA) is a high-income economy in Europe. According to the survey of the free trade index (https://www.heritage.org/index), Latvia's economic freedom score is 74.8, and Its economy ranks 18th in the 2022 index. Latvia is relatively far ahead of its OECD peers in terms of economic efficiency and greenhouse gas reduction, mainly for several reasons:
1. Latvia's energy industry has been able to shift away from traditional energy sources such as coal and oil to more environmentally friendly forms of energy such as natural gas and renewables. This change in energy mix has enabled Latvia to maintain economic growth while reducing greenhouse gas emissions.
2. Latvia also has a high capacity for carbon capture in areas such as agriculture and forests, activities that can effectively reduce greenhouse gas emissions.
3. The Latvian government encourages businesses and people to reduce greenhouse gas emissions through green taxes and subsidies. In addition, Latvia has effectively reduced its greenhouse gas emissions by establishing a carbon emissions trading system.
4. The Latvian government actively promotes sustainable development, focuses on developing a green economy, and encourages enterprises to develop environmentally friendly technologies and products. At the same time, Latvia has a well-developed public transport system and a high acceptance of non-motorized modes of transport, such as cycling and walking, which reduces environmental pollution.
For all these reasons, Latvia has achieved the dual advantages of economic and greenhouse gas reduction efficiency and has made considerable achievements in the green economy and sustainable development.
Luxembourg (LUX) excels in economic efficiency, with one of the smallest economies in Europe and one of the highest GDP per capita, its GDP per capita is the second highest among OECD countries. Luxembourg's economic development mainly depends on finance, banking, insurance, other services, steel, high-tech, and other industrial sectors. Luxembourg has a highly open economy and a high proportion of international trade to GDP. Luxembourg, however, performs poorly in reducing greenhouse gas emissions and is one of the highest emitters in the OECD. According to 2021 statistics, Luxembourg's greenhouse gas emissions are about 20 tons per person per year, well above the OECD average. Luxembourg's primary greenhouse gas emissions are transport, energy production, and consumption.
The fact that Luxembourg is far more economically efficient than it is in reducing greenhouse gas emissions may be related to its economic structure and extraordinary circumstances, including the following reasons:
1. Luxembourg is a major country in Europe. Luxembourg is a highly industrialized and service-oriented country with a structure of economic activity contributing to high domestic greenhouse gas emissions. Its economic location and open economic system also contribute to the scale and efficiency of its economic activities.
2. Luxembourg's greenhouse gas reduction measures could be more robust, and policy implementation is also responsible for the poor results. For example, in terms of transport, Luxembourg needs an effective public transport system, and residents rely more on private vehicles, which also contributes to the high contribution of transport to greenhouse gas emissions.
3. Luxembourg is a small country with limited land area, dense population, and limited carrying capacity of environment and resources, limiting its ability to carry out large-scale greenhouse gas emission reduction measures.
4. Luxembourg's position within the European Union is relatively independent, and its commitment to climate change and emission reduction targets is relatively weak. This also leaves Luxembourg with little external pressure and incentive to implement measures to reduce emissions.
For the above reasons, the phenomenon that Luxembourg's economic efficiency is much higher than its greenhouse gas emission reduction efficiency may be caused by its inadequate economic structure and policy implementation. However, with the increasing global attention on climate change and the increasing pressure from the international community, Luxembourg is gradually strengthening its emission reduction measures to achieve the dual goals of economic development and environmental protection. The Luxembourg government has developed a climate action plan to achieve comprehensive emission reduction targets by 2050, including further measures to promote electric vehicles, improve energy efficiency in buildings, and increase renewable energy sources. In addition, Luxembourg is part of the EU's Climate Action Plan, pledging to meet greenhouse gas reduction targets by 2030.
According to the research of 42, the population of developed countries is usually smaller than that of developing countries, but the quality of life is better. As a result, cumulative greenhouse gas emissions per capita are generally more significant in developed countries than in developing countries, noting that Luxembourg and Australia are the two largest emitters of greenhouse gases based on cumulative income per capita, while India and Indonesia are the two smallest countries, Income-based greenhouse gas emissions in 2009 in Australia and Luxembourg increased by 41 percent and 60 percent, respectively, from 1995 levels. 43 pointed out that international trade led to global economic growth while emitting more greenhouse gases. They pointed out that the actual per-capita GHG emissions of countries such as Luxembourg and Australia are relatively large. 44 surveyed greenhouse gases and health in EU countries. They found that Ireland and Luxembourg were considered less active in controlling greenhouse gas emissions in terms of total greenhouse gas emissions; It also recommends that countries, in general, should focus on reducing greenhouse gas emissions and that reducing carbon dioxide emissions appears to be the most beneficial from a health perspective.
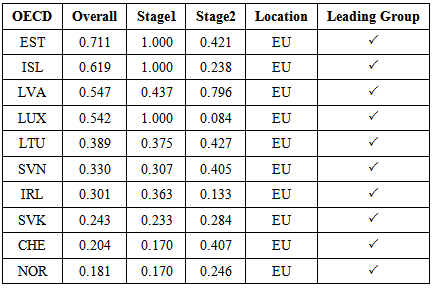
4.2. Top 10 Countries in Overall EfficiencyAt present, OECD member countries cover all over the world, including countries in Asia, Western Europe, and North America in the early stage. This study lists ten countries whose total efficiency exceeds the average (0.143), as shown in Table 6. These ten countries are all from Europe. According to the survey of the World Bank, the top 10 countries in total efficiency in this study are all high-income economies 45, and the economic efficiency of these countries is indeed higher than the average (0.16). Why the overall efficiency ranking of these countries can be so high is worth further research and investigation in the future.
Air pollution and climate change caused by greenhouse gas emissions have become increasingly severe, an essential issue of environmental protection. However, global greenhouse gas emissions continue aggravating the greenhouse effect, which may lead to more extreme climate-threatening life and property. Therefore, in the international community, countries are constantly calling for every country to control greenhouse gas emissions. International organizations and monetary unions have also called for future subsidies or investments to consider greenhouse gas emissions. However, countries seeking economic growth are bound to continue to emit large amounts of greenhouse gases. This study used the two-stage DEA efficiency analysis method to analyze the comprehensive efficiency of OECD member states by the economic efficiency of the first stage and the greenhouse gas emission reduction efficiency of the second stage. The results show that the national economic efficiency and greenhouse gas emission reduction efficiency of Estonia (EST) and Latvia (LVA) are higher than the average. In comparison, the national economic efficiency of Iceland and Luxembourg is much higher than the greenhouse gas emission reduction efficiency. Latvia is the most efficient of the four countries in reducing greenhouse gases. The results of this study can provide a reference for the United Nations and international organizations to promote global greenhouse gas emission reduction.
| [1] | Lamb, W. F., Wiedmann, T., Pongratz, J., Andrew, R., Crippa, M., Olivier, J. G., ... & Minx, J. (2021). A review of trends and drivers of greenhouse gas emissions by sector from 1990 to 2018. Environmental research letters, 16(7), 073005. | ||
| In article | View Article | ||
| [2] | Ritchie, H., Roser, M., & Rosado, P. (2020). CO₂ and greenhouse gas emissions. Our world in data. | ||
| In article | |||
| [3] | Nunez, C. (2019). Carbon dioxide levels are at a record high. Here’s what you need to know. National geographic, 13. | ||
| In article | |||
| [4] | Waslander, J. A. C. O. B., Bos, J. U. L. I. E., & Wu, Y. I. L. I. (2021). Banking Beyond Climate Commitments: Transforming Client Engagement and Products & Services for a Net-Zero Emissions Future. Working Paper | ||
| In article | View Article | ||
| [5] | Peter, C., Helming, K., & Nendel, C. (2017). Do greenhouse gas emission calculations from energy crop cultivation reflect actual agricultural management practices?–A review of carbon footprint calculators. Renewable and Sustainable Energy Reviews, 67, 461-476. | ||
| In article | View Article | ||
| [6] | Yamaka, W., Phadkantha, R., & Rakpho, P. (2021). Economic and energy impacts on greenhouse gas emissions: A case study of China and the USA. Energy Reports, 7, 240-247. | ||
| In article | View Article | ||
| [7] | Aquilas, N. A., & Atemnkeng, J. T. (2022). Climate-related development finance and renewable energy consumption in greenhouse gas emissions reduction in the Congo basin. Energy Strategy Reviews, 44, 100971. | ||
| In article | View Article | ||
| [8] | Cheng, B., Li, J., Su, H., Lu, K., Chen, H., & Huang, J. (2022). Life cycle assessment of greenhouse gas emission reduction through bike-sharing for sustainable cities. Sustainable Energy Technologies and Assessments, 53, 102789. | ||
| In article | View Article | ||
| [9] | Wang, D., Du, Z., & Wu, H. (2020). Ranking global cities based on economic performance and climate change mitigation. Sustainable cities and society, 62, 102395. | ||
| In article | View Article | ||
| [10] | Moutinho, V., & Madaleno, M. (2021). A two-stage DEA model to evaluate the technical eco-efficiency indicator in the EU countries. International Journal of Environmental Research and Public Health, 18(6), 3038. | ||
| In article | View Article PubMed | ||
| [11] | Iqbal, W., Altalbe, A., Fatima, A., Ali, A., & Hou, Y. (2019). A DEA approach for assessing the energy, environmental and economic performance of top 20 industrial countries. Processes, 7(12), 902. | ||
| In article | View Article | ||
| [12] | EPA, U.S. Environmental Protection Agency, 2022 Guidance on control strategies for state and local agencies available at: www.epa.gov/state-and-local-transportation/guidance-control-strategies-state-and-local-agencies(Accessed 20 February 2023) | ||
| In article | |||
| [13] | Kweku, D. W., Bismark, O., Maxwell, A., Desmond, K. A., Danso, K. B., Oti-Mensah, E. A., ... & Adormaa, B. B. (2018). Greenhouse effect: greenhouse gases and their impact on global warming. Journal of Scientific research and reports, 17(6), 1-9. | ||
| In article | |||
| [14] | Rypdal, K., & Winiwarter, W. (2001). Uncertainties in greenhouse gas emission inventories—evaluation, comparability and implications. Environmental Science & Policy, 4(2-3), 107-116. | ||
| In article | View Article | ||
| [15] | Zhang, Z., Qu, J., & Zeng, J. (2008). A quantitative comparison and analysis on the assessment indicators of greenhouse gases emission. Journal of Geographical Sciences, 18, 387-399. | ||
| In article | View Article | ||
| [16] | Xu, X., Wei, Z., Ji, Q., Wang, C., & Gao, G. (2019). Global renewable energy development: Influencing factors, trend predictions and countermeasures. Resources Policy, 63, 101470. | ||
| In article | |||
| [17] | Kazancoglu, Y., Ozbiltekin-Pala, M., & Ozkan-Ozen, Y. D. (2021). Prediction and evaluation of greenhouse gas emissions for sustainable road transport within Europe. Sustainable Cities and Society, 70, 102924. | ||
| In article | View Article | ||
| [18] | Altikat, S. (2021). Prediction of CO2 emission from greenhouse to atmosphere with artificial neural networks and deep learning neural networks. International Journal of Environmental Science and Technology, 18(10), 3169-3178. | ||
| In article | View Article | ||
| [19] | Yamaka, W., Phadkantha, R., & Rakpho, P. (2021). Economic and energy impacts on greenhouse gas emissions: A case study of China and the USA. Energy Reports, 7, 240-247. | ||
| In article | View Article | ||
| [20] | Wang, Q., & Zhang, F. (2021). The effects of trade openness on decoupling carbon emissions from economic growth–evidence from 182 countries. Journal of cleaner production, 279, 123838. | ||
| In article | View Article PubMed | ||
| [21] | Oertel, C., Matschullat, J., Zurba, K., Zimmermann, F., & Erasmi, S. (2016). Greenhouse gas emissions from soils—A review. Geochemistry, 76(3), 327-352. | ||
| In article | View Article | ||
| [22] | Shaw, B. K., Sangal, I., & Sarkar, B. (2022). Reduction of greenhouse gas emissions in an imperfect production process under breakdown consideration. AIMS Environmental Science, 9(5), 658-691. | ||
| In article | View Article | ||
| [23] | Charnes, A., Cooper, W.W., Rhodes, E., 1979. Short communication: Measuring the efficiency of decision making units. European Journal of Operational Research 3, 339. | ||
| In article | View Article | ||
| [24] | Charnes, A., Cooper, W.W., 1984. The non-Archimedean CCR ratio for efficiency analysis: A rejoinder to Boyd and Fa¨re. European Journal of Operational Research 15, 333-334. | ||
| In article | View Article | ||
| [25] | Ji, Y. B., & Lee, C. (2010). Data envelopment analysis. The Stata Journal, 10(2), 267-280. | ||
| In article | View Article | ||
| [26] | Kaffash, S., Azizi, R., Huang, Y., & Zhu, J. (2020). A survey of data envelopment analysis applications in the insurance industry 1993–2018. European journal of operational research, 284(3), 801-813. | ||
| In article | View Article | ||
| [27] | Mahmoudi, R., Emrouznejad, A., Shetab-Boushehri, S. N., & Hejazi, S. R. (2020). The origins, development and future directions of data envelopment analysis approach in transportation systems. Socio-Economic Planning Sciences, 69, 100672. | ||
| In article | View Article | ||
| [28] | Sarraf, F., & Nejad, S. H. (2020). Improving performance evaluation based on balanced scorecard with grey relational analysis and data envelopment analysis approaches: Case study in water and wastewater companies. Evaluation and program planning, 79, 101762. | ||
| In article | View Article PubMed | ||
| [29] | Luo, Q., Miao, C., Sun, L., Meng, X., & Duan, M. (2019). Efficiency evaluation of green technology innovation of China's strategic emerging industries: An empirical analysis based on Malmquist-data envelopment analysis index. Journal of Cleaner Production, 238, 117782. | ||
| In article | View Article | ||
| [30] | Zhu, N., Zhu, C., & Emrouznejad, A. (2021). A combined machine learning algorithms and DEA method for measuring and predicting the efficiency of Chinese manufacturing listed companies. Journal of Management Science and Engineering, 6(4), 435-448. | ||
| In article | |||
| [31] | Nong, N. M. T. (2022). An application of delphi and dea to performance efficiency assessment of retail stores in fashion industry. The Asian Journal of Shipping and Logistics, 38(3), 135-142. | ||
| In article | View Article | ||
| [32] | Forouzandeh, F., Arman, H., Hadi-Vencheh, A., & Rahimi, A. M. (2022). A combination of DEA and AIMSUN to manage big data when evaluating the performance of bus lines. Information Sciences, 618, 72-86. | ||
| In article | View Article | ||
| [33] | Nong, T. N. M. (2022). Performance efficiency assessment of Vietnamese ports: An application of Delphi with Kamet principles and DEA model. The Asian Journal of Shipping and Logistics. | ||
| In article | |||
| [34] | Flegl, M., & Gress, E. S. H. (2023). A two-stage Data Envelopment Analysis model for investigating the efficiency of the public security in Mexico. Decision Analytics Journal, 100181. | ||
| In article | View Article | ||
| [35] | Rebolledo-Leiva, R., Angulo-Meza, L., Iriarte, A., & González-Araya, M. C. (2017). Joint carbon footprint assessment and data envelopment analysis for the reduction of greenhouse gas emissions in agriculture production. Science of the Total Environment, 593, 36-46. | ||
| In article | View Article PubMed | ||
| [36] | Kao, C., & Hwang, S. N. (2008). Efficiency decomposition in two-stage data envelopment analysis: An application to non-life insurance companies in Taiwan. European journal of operational research, 185(1), 418-429. | ||
| In article | View Article | ||
| [37] | Herweijer et al., (2020). Net Zero Economy Index 2020: The Pivotal Decade, https://www.pwc.co.uk/services/sustainability-climate-change/insights/net-zero-economy-index-2020.html | ||
| In article | |||
| [38] | Latõšov, E., Umbleja, S., & Volkova, A. (2022). CO2 emission intensity of the Estonian DH sector. Smart Energy, 6, 100070. | ||
| In article | View Article | ||
| [39] | Misztal, A., Kowalska, M., & Fajczak-Kowalska, A. (2022). The Impact of Economic Factors on the Sustainable Development of Energy Enterprises: The Case of Bulgaria, Czechia, Estonia and Poland. Energies, 15(18), 6842. | ||
| In article | View Article | ||
| [40] | Clarke, J., Heinonen, J., & Ottelin, J. (2017). Emissions in a decarbonised economy? Global lessons from a carbon footprint analysis of Iceland. Journal of Cleaner Production, 166, 1175-1186. | ||
| In article | View Article | ||
| [41] | Boyd, R., Turner, J., & Ward, B. (2015). Intended nationally determined contributions: what are the implications for greenhouse gas emissions in 2030? | ||
| In article | |||
| [42] | Liang, S., Qu, S., Zhu, Z., Guan, D., & Xu, M. (2017). Income-based greenhouse gas emissions of nations. Environmental science & technology, 51(1), 346-355. | ||
| In article | View Article | ||
| [43] | Wu, Z., Yang, L., Chen, Q., & Ye, Q. (2021). The impacts of international trade on global greenhouse gas emissions: A thought experiment based on a novel no-trade analysis. Journal of environmental management, 300, 113836. | ||
| In article | View Article PubMed | ||
| [44] | Gavurova, B., Rigelsky, M., & Ivankova, V. (2021). Greenhouse gas emissions and health in the countries of the European Union. Frontiers in public health, 2007. | ||
| In article | View Article PubMed | ||
| [45] | Bank, W. (2021). World Bank country and lending groups—World Bank data help desk. World Bank Country and Lending Groups–World Bank Data Help Desk. | ||
| In article | |||
Published with license by Science and Education Publishing, Copyright © 2023 Ai-Chi Hsu, Po-Yuan Shih and Ting-Wei Wu
![]() This work is licensed under a Creative Commons Attribution 4.0 International License. To view a copy of this license, visit
http://creativecommons.org/licenses/by/4.0/
This work is licensed under a Creative Commons Attribution 4.0 International License. To view a copy of this license, visit
http://creativecommons.org/licenses/by/4.0/
| [1] | Lamb, W. F., Wiedmann, T., Pongratz, J., Andrew, R., Crippa, M., Olivier, J. G., ... & Minx, J. (2021). A review of trends and drivers of greenhouse gas emissions by sector from 1990 to 2018. Environmental research letters, 16(7), 073005. | ||
| In article | View Article | ||
| [2] | Ritchie, H., Roser, M., & Rosado, P. (2020). CO₂ and greenhouse gas emissions. Our world in data. | ||
| In article | |||
| [3] | Nunez, C. (2019). Carbon dioxide levels are at a record high. Here’s what you need to know. National geographic, 13. | ||
| In article | |||
| [4] | Waslander, J. A. C. O. B., Bos, J. U. L. I. E., & Wu, Y. I. L. I. (2021). Banking Beyond Climate Commitments: Transforming Client Engagement and Products & Services for a Net-Zero Emissions Future. Working Paper | ||
| In article | View Article | ||
| [5] | Peter, C., Helming, K., & Nendel, C. (2017). Do greenhouse gas emission calculations from energy crop cultivation reflect actual agricultural management practices?–A review of carbon footprint calculators. Renewable and Sustainable Energy Reviews, 67, 461-476. | ||
| In article | View Article | ||
| [6] | Yamaka, W., Phadkantha, R., & Rakpho, P. (2021). Economic and energy impacts on greenhouse gas emissions: A case study of China and the USA. Energy Reports, 7, 240-247. | ||
| In article | View Article | ||
| [7] | Aquilas, N. A., & Atemnkeng, J. T. (2022). Climate-related development finance and renewable energy consumption in greenhouse gas emissions reduction in the Congo basin. Energy Strategy Reviews, 44, 100971. | ||
| In article | View Article | ||
| [8] | Cheng, B., Li, J., Su, H., Lu, K., Chen, H., & Huang, J. (2022). Life cycle assessment of greenhouse gas emission reduction through bike-sharing for sustainable cities. Sustainable Energy Technologies and Assessments, 53, 102789. | ||
| In article | View Article | ||
| [9] | Wang, D., Du, Z., & Wu, H. (2020). Ranking global cities based on economic performance and climate change mitigation. Sustainable cities and society, 62, 102395. | ||
| In article | View Article | ||
| [10] | Moutinho, V., & Madaleno, M. (2021). A two-stage DEA model to evaluate the technical eco-efficiency indicator in the EU countries. International Journal of Environmental Research and Public Health, 18(6), 3038. | ||
| In article | View Article PubMed | ||
| [11] | Iqbal, W., Altalbe, A., Fatima, A., Ali, A., & Hou, Y. (2019). A DEA approach for assessing the energy, environmental and economic performance of top 20 industrial countries. Processes, 7(12), 902. | ||
| In article | View Article | ||
| [12] | EPA, U.S. Environmental Protection Agency, 2022 Guidance on control strategies for state and local agencies available at: www.epa.gov/state-and-local-transportation/guidance-control-strategies-state-and-local-agencies(Accessed 20 February 2023) | ||
| In article | |||
| [13] | Kweku, D. W., Bismark, O., Maxwell, A., Desmond, K. A., Danso, K. B., Oti-Mensah, E. A., ... & Adormaa, B. B. (2018). Greenhouse effect: greenhouse gases and their impact on global warming. Journal of Scientific research and reports, 17(6), 1-9. | ||
| In article | |||
| [14] | Rypdal, K., & Winiwarter, W. (2001). Uncertainties in greenhouse gas emission inventories—evaluation, comparability and implications. Environmental Science & Policy, 4(2-3), 107-116. | ||
| In article | View Article | ||
| [15] | Zhang, Z., Qu, J., & Zeng, J. (2008). A quantitative comparison and analysis on the assessment indicators of greenhouse gases emission. Journal of Geographical Sciences, 18, 387-399. | ||
| In article | View Article | ||
| [16] | Xu, X., Wei, Z., Ji, Q., Wang, C., & Gao, G. (2019). Global renewable energy development: Influencing factors, trend predictions and countermeasures. Resources Policy, 63, 101470. | ||
| In article | |||
| [17] | Kazancoglu, Y., Ozbiltekin-Pala, M., & Ozkan-Ozen, Y. D. (2021). Prediction and evaluation of greenhouse gas emissions for sustainable road transport within Europe. Sustainable Cities and Society, 70, 102924. | ||
| In article | View Article | ||
| [18] | Altikat, S. (2021). Prediction of CO2 emission from greenhouse to atmosphere with artificial neural networks and deep learning neural networks. International Journal of Environmental Science and Technology, 18(10), 3169-3178. | ||
| In article | View Article | ||
| [19] | Yamaka, W., Phadkantha, R., & Rakpho, P. (2021). Economic and energy impacts on greenhouse gas emissions: A case study of China and the USA. Energy Reports, 7, 240-247. | ||
| In article | View Article | ||
| [20] | Wang, Q., & Zhang, F. (2021). The effects of trade openness on decoupling carbon emissions from economic growth–evidence from 182 countries. Journal of cleaner production, 279, 123838. | ||
| In article | View Article PubMed | ||
| [21] | Oertel, C., Matschullat, J., Zurba, K., Zimmermann, F., & Erasmi, S. (2016). Greenhouse gas emissions from soils—A review. Geochemistry, 76(3), 327-352. | ||
| In article | View Article | ||
| [22] | Shaw, B. K., Sangal, I., & Sarkar, B. (2022). Reduction of greenhouse gas emissions in an imperfect production process under breakdown consideration. AIMS Environmental Science, 9(5), 658-691. | ||
| In article | View Article | ||
| [23] | Charnes, A., Cooper, W.W., Rhodes, E., 1979. Short communication: Measuring the efficiency of decision making units. European Journal of Operational Research 3, 339. | ||
| In article | View Article | ||
| [24] | Charnes, A., Cooper, W.W., 1984. The non-Archimedean CCR ratio for efficiency analysis: A rejoinder to Boyd and Fa¨re. European Journal of Operational Research 15, 333-334. | ||
| In article | View Article | ||
| [25] | Ji, Y. B., & Lee, C. (2010). Data envelopment analysis. The Stata Journal, 10(2), 267-280. | ||
| In article | View Article | ||
| [26] | Kaffash, S., Azizi, R., Huang, Y., & Zhu, J. (2020). A survey of data envelopment analysis applications in the insurance industry 1993–2018. European journal of operational research, 284(3), 801-813. | ||
| In article | View Article | ||
| [27] | Mahmoudi, R., Emrouznejad, A., Shetab-Boushehri, S. N., & Hejazi, S. R. (2020). The origins, development and future directions of data envelopment analysis approach in transportation systems. Socio-Economic Planning Sciences, 69, 100672. | ||
| In article | View Article | ||
| [28] | Sarraf, F., & Nejad, S. H. (2020). Improving performance evaluation based on balanced scorecard with grey relational analysis and data envelopment analysis approaches: Case study in water and wastewater companies. Evaluation and program planning, 79, 101762. | ||
| In article | View Article PubMed | ||
| [29] | Luo, Q., Miao, C., Sun, L., Meng, X., & Duan, M. (2019). Efficiency evaluation of green technology innovation of China's strategic emerging industries: An empirical analysis based on Malmquist-data envelopment analysis index. Journal of Cleaner Production, 238, 117782. | ||
| In article | View Article | ||
| [30] | Zhu, N., Zhu, C., & Emrouznejad, A. (2021). A combined machine learning algorithms and DEA method for measuring and predicting the efficiency of Chinese manufacturing listed companies. Journal of Management Science and Engineering, 6(4), 435-448. | ||
| In article | |||
| [31] | Nong, N. M. T. (2022). An application of delphi and dea to performance efficiency assessment of retail stores in fashion industry. The Asian Journal of Shipping and Logistics, 38(3), 135-142. | ||
| In article | View Article | ||
| [32] | Forouzandeh, F., Arman, H., Hadi-Vencheh, A., & Rahimi, A. M. (2022). A combination of DEA and AIMSUN to manage big data when evaluating the performance of bus lines. Information Sciences, 618, 72-86. | ||
| In article | View Article | ||
| [33] | Nong, T. N. M. (2022). Performance efficiency assessment of Vietnamese ports: An application of Delphi with Kamet principles and DEA model. The Asian Journal of Shipping and Logistics. | ||
| In article | |||
| [34] | Flegl, M., & Gress, E. S. H. (2023). A two-stage Data Envelopment Analysis model for investigating the efficiency of the public security in Mexico. Decision Analytics Journal, 100181. | ||
| In article | View Article | ||
| [35] | Rebolledo-Leiva, R., Angulo-Meza, L., Iriarte, A., & González-Araya, M. C. (2017). Joint carbon footprint assessment and data envelopment analysis for the reduction of greenhouse gas emissions in agriculture production. Science of the Total Environment, 593, 36-46. | ||
| In article | View Article PubMed | ||
| [36] | Kao, C., & Hwang, S. N. (2008). Efficiency decomposition in two-stage data envelopment analysis: An application to non-life insurance companies in Taiwan. European journal of operational research, 185(1), 418-429. | ||
| In article | View Article | ||
| [37] | Herweijer et al., (2020). Net Zero Economy Index 2020: The Pivotal Decade, https://www.pwc.co.uk/services/sustainability-climate-change/insights/net-zero-economy-index-2020.html | ||
| In article | |||
| [38] | Latõšov, E., Umbleja, S., & Volkova, A. (2022). CO2 emission intensity of the Estonian DH sector. Smart Energy, 6, 100070. | ||
| In article | View Article | ||
| [39] | Misztal, A., Kowalska, M., & Fajczak-Kowalska, A. (2022). The Impact of Economic Factors on the Sustainable Development of Energy Enterprises: The Case of Bulgaria, Czechia, Estonia and Poland. Energies, 15(18), 6842. | ||
| In article | View Article | ||
| [40] | Clarke, J., Heinonen, J., & Ottelin, J. (2017). Emissions in a decarbonised economy? Global lessons from a carbon footprint analysis of Iceland. Journal of Cleaner Production, 166, 1175-1186. | ||
| In article | View Article | ||
| [41] | Boyd, R., Turner, J., & Ward, B. (2015). Intended nationally determined contributions: what are the implications for greenhouse gas emissions in 2030? | ||
| In article | |||
| [42] | Liang, S., Qu, S., Zhu, Z., Guan, D., & Xu, M. (2017). Income-based greenhouse gas emissions of nations. Environmental science & technology, 51(1), 346-355. | ||
| In article | View Article | ||
| [43] | Wu, Z., Yang, L., Chen, Q., & Ye, Q. (2021). The impacts of international trade on global greenhouse gas emissions: A thought experiment based on a novel no-trade analysis. Journal of environmental management, 300, 113836. | ||
| In article | View Article PubMed | ||
| [44] | Gavurova, B., Rigelsky, M., & Ivankova, V. (2021). Greenhouse gas emissions and health in the countries of the European Union. Frontiers in public health, 2007. | ||
| In article | View Article PubMed | ||
| [45] | Bank, W. (2021). World Bank country and lending groups—World Bank data help desk. World Bank Country and Lending Groups–World Bank Data Help Desk. | ||
| In article | |||


