 OPEN ACCESS
  PEER-REVIEWED
Bootstrapping Normal and Binomial Distributions
Acha Chigozie Kelechi
Abstract
This paper examines and compares the implications of bootstrapping normal and binomial distributions. Hypothetical data set was used aided by S-plus package. Data analysis, examination, and comparison were based on their correlation coefficients and the bootstrap estimate of the standard error of plug-in correlation coefficient. Evidence shows that both distributions behave very well as seen in the fundamental theory of statistics. Also as the bootstrap level increases, the binomial gives a lower correlation coefficient (-0.07258132), against -0.1355295 in normal distribution. It is pertinent to note that the correlation coefficient is steady as the bootstrap increases.The paper therefore focuses on the performance of the standard error of plug-in correlation coefficient. Result shows that the normal distribution gives lower standard error which suggests more reliability to the plug-in estimate. Thus, this study uses the bootstrap method to demonstrate a scenario where the normality assumption becomes stronger as the bootstrap sample sizes (100, 500, and 1000) gets larger but on approximation at two decimal places, both distributions give the same statistical inference (1000: 0.14). Therefore, binomial distribution is preferred to normal distribution in terms of their correlation coefficient but the normal distribution is preferred to binomial for carrying out further analysis in parameter estimation and other statistical inference in terms of their standard error of plug-in correlation coefficient.
Keywords: correlation coefficients, plug-in, parameter, normality, standard error
International Journal of Econometrics and Financial Management, 2014 2 (6),
pp 253-256.
DOI: 10.12691/ijefm-2-6-5
Received October 20, 2014; Revised November 06, 2014; Accepted November 10, 2014
Copyright © 2013 Science and Education Publishing. All Rights Reserved.Cite this article:
- Kelechi, Acha Chigozie. "Bootstrapping Normal and Binomial Distributions." International Journal of Econometrics and Financial Management 2.6 (2014): 253-256.
- Kelechi, A. C. (2014). Bootstrapping Normal and Binomial Distributions. International Journal of Econometrics and Financial Management, 2(6), 253-256.
- Kelechi, Acha Chigozie. "Bootstrapping Normal and Binomial Distributions." International Journal of Econometrics and Financial Management 2, no. 6 (2014): 253-256.
| Import into BibTeX | Import into EndNote | Import into RefMan | Import into RefWorks |
1. Introduction
The bootstrap provides accuracy by using plug-in principle to estimate the standard error of a summary statistic. The bootstrap makes it practical to expand the statistical repertoire to make greater use of statistical methods and to avoid unrealistic assumptions. Furthermore, the bootstrap makes it very easy to draw inference for the median, standard error, correlation coefficient as well as the mean. For the above inferences to be possible, the bootstrap must be applied on the right distribution to get accurate statistical inference (Acha, 2014; Lehikoinen, et al. 2010; O'Hara, 2009). The importance of statistical inference cannot be overemphasized because it makes the estimate of population features derived from analyzing a sample accurate. As the accurate inference is expected at the end of a study or experiment; it therefore becomes expedient for the study to be carried out. S-plus program was used to generate two independent bootstrap samples of 50 observations each from normal (0, 1) and binomial (50,200,0.5) distributions with correlation coefficients and the bootstrap estimate of the standard error of plug-in correlation coefficient.
This paper, drawing from the foregoing, aims at examining the impact of bootstrap on statistical inference. The objective would be achieved by analytically examining the correlation coefficients and the bootstrap estimate of the standard error of plug-in correlation coefficient from the two distributions using S-plus package.
To achieve this objective which this paper has set for itself, the next section examines the concept and theoretical underpinnings of binomial and normal distributions, the third section describes the method to be adopted in data analysis. In the fourth section data is analyzed using the estimates from correction coefficients and the bootstrap estimates of the standard error of plug-in correlation coefficient. The kernel densities at different bootstrap levels were also plotted. The interpretation of the results was done in the fifth section. Finally, the paper is concluded in the sixth section.
2. Theoretical Review
According to Cover and Thomas (2006) and Park and Bera (2009), the normal (or Gaussian) distribution is a very commonly occurring continuous probability distribution. It is also function that tells the probability that any real observation will fall between any two real limits or real numbers. Normal distributions are extremely important in collecting, analyzing and organizing in statistics and are often used in other sciences’ real-valued random variables whose distributions are not known. Acha (2010) laid down the normal distribution assumptions and how to test them.
A normal distribution is;
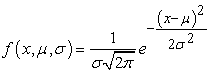 |
Where; parameter μ in this definition is the mean, the parameter σ is its standard deviation and σ2 is variance.
The binomial distribution, in probability theory and statistics, is the discrete probability of the number of successes in a sequence of n independent experiments, each of which yields success with probability p. A success/failure experiment is also called a Bernoulli experiment or Bernoulli trial; when n = 1, the binomial distribution is a Bernoulli distribution (Lord, 2010). The binomial distribution is the basis for the popular binomial test of statistical significance.The binomial distribution is frequently used to model the number of successes in a sample of size n drawn with replacement from a population of size N; (MacKay, 2003 and Kaas & Buhrmanb, 1980). In general, if the random variable X follows the binomial distribution with parameters n and p, we write X ~ B(n, p). The probability of getting exactly k successes in n trials is given by the probability mass function:
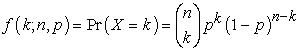 |
for k = 0, 1, 2, ..., n, where
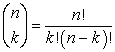 |
is the binomial coefficient, hence the name of the distribution. They two distributions (normal and binomial) are very important in statistical inference. Acha and Acha (2011) lay emphasis on the importance of statistical inference. Statistical inference is the process of drawing conclusions about population or other collections of objects about which we have only partial knowledge from the samples. It is often beneficial to represent the distribution of random variables using a convenient approximation, facilitating mathematical and statistical analysis. Acha (2012a; 2012b), point out that a major criterion in judging a certain distribution is the use of a few parameters in defining the distribution. This was done by estimating the coefficients of the explanatory variables in the analysis. It is not always easy to choose the model solely on theoretical and biological grounds. Knowing the type of data used is of course important and general exploration of data in terms of, e.g., plotting may be useful or recommendable (O'Hara and Kotze, (2010) & Chatfield, (2004). As VerHoef and Boveng (2007) state, plotting can be a useful step while deciding how to model, predict and forecast. However, knowing the of nature of the data, for example by plotting, can change the beliefs in what model may be the most appropriate and what modeling decision to make (Acha, 2014).
3. Research Methodology
This paper will be based on descriptive research method and kernel density plots, as well as different statistical distributions to enable ascertainment of the distribution preferred to carry out analysis on statistical inference. Two distributions regularly used in econometrics were adopted to generate the hypothetical data set. S-plus package was used to augment the process.
4. Data Analysis
The S-plus package was used to generate two independent bootstrap samples of 50 observations each from normal (0; 1) and binomial (50, 200, 0.5) distributions. These samples will be used to estimate the correlation coefficients and the bootstrap estimate of the standard error of plug-in correlation coefficient. The samples are as follows;
• y from the normal (0,1) distribution.
-0.5819044 -1.3900293 -2.6014063 0.3153851 0.6188953 -1.3258955 1.0572165 0.2271110 1.3331262 1.5330396 -0.9329452 0.5899096 0.6403601 0.3564061 1.0203796 0.1149446 1.6847397 0.6823885 -0.1461679 -0.7362833 1.1004349 0.3878337 -1.6650632 0.4519873 0.3875775 -1.6257174 1.3722611 0.3063014 -0.4122679 -0.1064458 1.0646592 -2.0570282 -0.3373929 0.2881138 0.3188099 1.0324257-0.3406803 1.4960063 -0.1547065 -0.8608756 0.4076623 1.0254347 -1.0793785 -0.7641281 -0.4020797 -0.1845112 -1.4103341 0.6717081 -1.2577988 -0.7475800
• x from the normal (0,1) distribution.
-1.41176171 -0.02643503 -1.93856594 1.00158991 -0.26466963 -0.80466842 -0.82510846 0.65399227 0.47536062 0.77462941 0.66641037 1.06127633 -0.19024063 -1.39004784 1.34806018 -0.06331429 0.44395255 0.04132000 -0.99746368 1.47864107 0.27903659 0.84638141 0.30833595 0.29504473-0.14961059 0.41092279 -0.90368872 1.29590334 -0.50628037 -0.45396268 -0.75236215 0.05145706 0.65191420 -0.39926948 -2.33230085 0.78887501 -0.99981305 -0.25086507 -0.32911544 0.56563726-0.25119700 0.07456379 -0.57901988 0.10996612 0.98294317 -0.83291568 0.32660949 0.38478362-0.50992689 -0.44825172
 |
 |
 |
• x from binomial (50 ,200 ,0.5) distributions data sets.
111 103 99 88 91 106 107 97 96 107 102 107 101 98 100 107 95 99 92 89 95 88 89 98 104 105 110 94 106 110 99 97 106 104 107 98 101 96 101 104 88 103 96 105 100 96 93 111 113 98
• y from binomial (50 ,200 ,0.5) distributions data sets.
109 104 82 95 100 112 105 104 116 97 103 93 99 115 94 90 92 97 96 100 112 111 111 104 97 102 94 98 85 98 99 92 98 101 97 95 104 92 94 114 89 95 97 106 112 100 88 90 96 107
 |
 |
 |
5. Interpretation of the Results


 PowerPoint Slide
 Larger image(png format)
 View current table in a new window
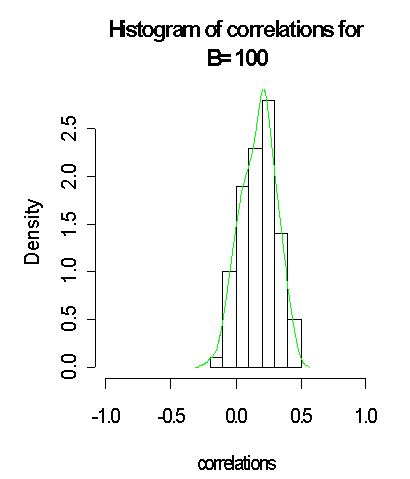
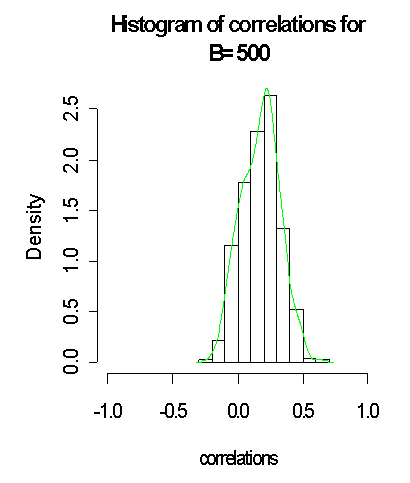
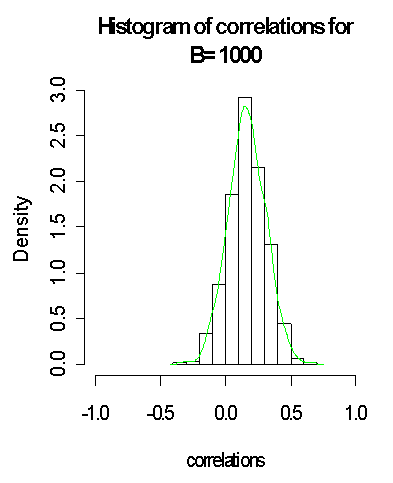
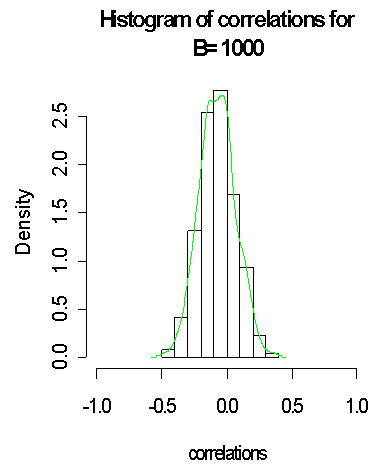
It is good to note that with larger bootstrap B = 1000 generated from the normal distribution and the approximated distribution on green lines, the closer to normality it gets when compared to B = 100 and B = 500. It is observed that the standard error of the plug-in estimate of the correlation coefficient reduced from (0:555346; 0:1399294) for B = (100; 500) to 0:1380868 when B = 1000, which suggests more reliability to the plug-in estimate. Thus, we have used the bootstrap method to demonstrate a scenario where the normality assumption becomes stronger as the sample size (here the bootstrap samples) gets larger.

 PowerPoint Slide
 Larger image(png format)
 View current table in a new window
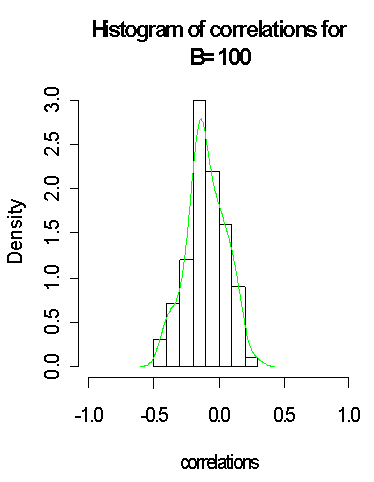
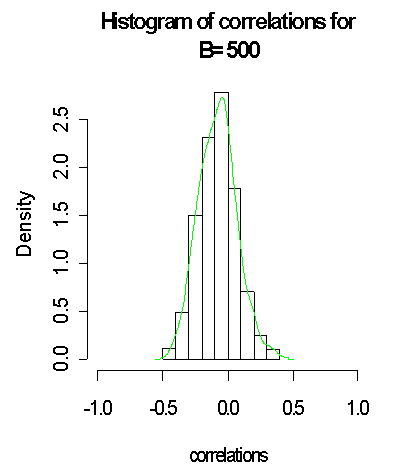
The above histogram and the results with B = 100, B= 500 and B=1000 generated from the binomial distribution and the approximated distribution on green lines does seem to support normality assumption weakly and this can clearly be depicted by the density curve. In fact, with larger bootstrap B = 5000 generated from the normal distribution and the approximated distribution on green lines, the above does tend to be closer to normality when compared with B = 100, B= 500 and B=1000. It was observed, also that the standard error of the plug-in estimate of the correlation coefficient reduced.
6. Conclusion
Considering the results obtained from the experiment used in this research work, different observations were made. In Table 1, that is, the bootstrap samples (B) generated from the normal distribution tend to be closer to normality. It also observed from Table 1, that the standard error of the plug-in estimate of the correlation coefficient reduced from (0:555346; 0:1380868) for B = (100; 1000) respectively. Similarly, the samples generated from the binomial distribution in Table 2 behaved like the samples in Table 1, as the bootstrap samples gets larger. In addition, from the standard error of the plug-in estimate of the correlation coefficient reduced in Table 1 & Table 2; suggesting more reliability to the plug-in estimate.
On the basis of comparison, the normal distribution is preferred to the binomial distribution for carrying out further analysis in parameter estimation and other statistical inference in terms of their standard error of plug-in correlation coefficient.
References
| [1] | Acha, C. K. (2014). Parametric Bootstrap Methods for Parameter Estimation in SLR Models. International Journal of Econometrics and Financial Management, 2014, 2(5), 175-179. | ||
 In article In article | |||
| [2] | Acha, C. K. (2012a). Regression and Principal Component Analyses: A Comparison Using Few Regressors. American Journal of Mathematics and Statistics, 2(1): 1-5. | ||
| In article | CrossRef | ||
| [3] | Acha, C. K. (2012b) On Two Methods of Analyzing Balanced Incomplete Block Designs. Pakistan Journal of Statistics and Operation Research, 8(4), 749-757. | ||
| In article | |||
| [4] | Acha, C. K. (2010). Impact of Housing and Age of Birds on Egg Production.International Journal of Numerical Mathematics, 5(2):275-298. | ||
| In article | |||
| [5] | Acha, I. A. and Acha, C. K. (2011). Interest Rates in Nigeria: An Analytical Perspective. Research Journal of Finance and Accounting, 2(3); 71-81. | ||
| In article | |||
| [6] | Chatfield, C. (2004).The Analysis of Time Series.- An Introduction.Chapman and Hall,London, UK.Sixth Edition. | ||
| In article | |||
| [7] | Cover, T. M. and Thomas, J. A. (2006).Elements of Information Theory.John Wiley and Sons. p. 254. | ||
| In article | |||
| [8] | Kaas, R. and Buhrman, J. M. (1980).Mean, Median and Mode in Binomial Distributions. Statistica Neerlandica, 34 (1): 13-18. | ||
| In article | CrossRef | ||
| [9] | Lehikoinen, A., Saurola, P.,Byholm, P.,Linden, A. and Valkama, J. (2010). Life history event of euasian sparrowhawk in a changing climate.Journal of Avian Biology, 41;627-636. | ||
| In article | CrossRef | ||
| [10] | Lord, N. (2010). Binomial averages when the mean is an integer, The Mathematical Gazette, 94, 331-332. | ||
| In article | |||
| [11] | MacKay, D. (2003). Information Theory, Inference and Learning Algorithms.Cambridge University Press; First Edition.ISBN 978-0521642989. | ||
| In article | |||
| [12] | O'Hara, R. B. (2009). How to make up models add up—a primer on GLMMs. Annales Zoologici Fennici, 46:124-137. | ||
| In article | CrossRef | ||
| [13] | O'Hara, R. B., and Kotze, D. J. (2010). Do not log-transform count data. Methods in Ecology and Evolution, 1:118-122. | ||
| In article | CrossRef | ||
| [14] | Park, S. Y. and Bera, A. K. (2009). Maximum entropy autoregressive conditional heteroskedasticity model. Journal of Econometrics, 150 (2): 219-230. | ||
| In article | CrossRef | ||
| [15] | VerHoef, J. M., and Boveng, P. L. (2007). Quasi-Poisson vs. negative binomial regression: How should we model overdispersed count data? Ecology, 88:2766-2772. | ||
| In article | CrossRef | ||

 CiteULike
 Delicious

