 OPEN ACCESS
  PEER-REVIEWED
Selecting Appropriate Variables for DEA Using Genetic Algorithm (GA) Search Procedure
R. Madhanagopal1, , R. Chandrasekaran1
1Department of Statistics, Madras Christian College, Chennai, Tamil Nadu, India
Abstract
Data envelopment analysis (DEA) is one of the most powerful non-parametric methods to assess the relative efficiency of each Decision making units (DMU’s). Its simplicity in computation and mathematical programming technique attracted many researchers and at the same time DEA is more sensitive to variables considered. It uses multiple inputs and outputs for efficiency analysis but does not provide any guidelines in choosing variables and hence researchers selected their own number of input and output variables using several methods. Usage of all the variables in DEA is not sensible, since irrelevant variables will reduce the efficiency power. Therefore, selection of appropriate or best set of variables for input and output is needed but it’s one of the crucial tasks in DEA. In the present paper, a new approach of selecting appropriate set of variables using genetic algorithm are discussed and applied to Indian banking sector.
At a glance: Figures
Keywords: data envelopment analysis, variable selection, genetic algorithm, Indian banking sector, efficiency analysis
International Journal of Data Envelopment Analysis and *Operations Research*, 2014 1 (2),
pp 28-33.
DOI: 10.12691/ijdeaor-1-2-3
Received June 30, 2014; Revised July 14, 2014; Accepted July 20, 2014
Copyright © 2013 Science and Education Publishing. All Rights Reserved.Cite this article:
- Madhanagopal, R., and R. Chandrasekaran. "Selecting Appropriate Variables for DEA Using Genetic Algorithm (GA) Search Procedure." International Journal of Data Envelopment Analysis and *Operations Research* 1.2 (2014): 28-33.
- Madhanagopal, R. , & Chandrasekaran, R. (2014). Selecting Appropriate Variables for DEA Using Genetic Algorithm (GA) Search Procedure. International Journal of Data Envelopment Analysis and *Operations Research*, 1(2), 28-33.
- Madhanagopal, R., and R. Chandrasekaran. "Selecting Appropriate Variables for DEA Using Genetic Algorithm (GA) Search Procedure." International Journal of Data Envelopment Analysis and *Operations Research* 1, no. 2 (2014): 28-33.
| Import into BibTeX | Import into EndNote | Import into RefMan | Import into RefWorks |
1. Introduction
Data envelopment analyses (DEA) are used widely in different field’s viz., education, financial or non-financial institutions, agriculture, sports and hospital, for the past five decades to assess the relative efficiency. One of the main reasons for DEA’s success over other traditional efficiency identifying methods was using multiple numbers of inputs and outputs. But the same advantage gave path for another difficult situation while selecting the variables. DEA does not provide any guidelines for selecting number of variables to be used. Therefore, researchers create their own number of input and output variables for the same set of problem. Usage of all the variables is not sensible due to the following reasons, firstly, the number of DMU’s should be greater three times than sum of input and output variables, but in real life application, DMU’s are restricted. Secondly, availability of data for all DMU’s are difficult. Thirdly, discriminating power between efficient and inefficient DMU’s was purely dependent on the number of variables and even though there was no limit on the number of variables, the use of excessive number of variables would make all DUM’s efficient. Also omission of some of the inputs can have a huge effect on the measure of technical efficiency [1]. Omission of relevant variables, inclusion of irrelevant variables and incorrect assumption on return-on-scale are the principal causes of model specification [2]. Misspecification of model has had a significant effect on DEA efficiency scores ([3, 4, 5]). Therefore, DMU’s efficiency are purely dependent on the input and output variables used in the model and need for selection of appropriate or best set of variables for input and output, but is one of the crucial tasks in DEA.
To overcome this problem, several methods have been proposed by various authors on the topic of relevant variables selection. [6] developed a new method to find relevant variables based on the variables contribution to efficiency. [7] proposed a multivariate statistical approach for reducing the number of variables using partial correlation, which showed that removing highly correlated variables, will certainly affect the efficiency scores heavily. [8] used regression analysis as a technique for identifying relevant variables wherein variables are selected if statistically significant. [9] sketched a method based on design of experiment concept, to distinguish between two groups based on external information selected outputs using 2-level orthogonal layout experiment and found statistically optimal variables. [10] based on the maximizing principle of correlation between the external performance index and DEA scores proposed a generalized DEA approach to select inputs and outputs. [11] proposed a selection method based on discriminant analysis using external evolution to find an appropriate combination of inputs and outputs by 3-level orthogonal layout design.
In this context, the present paper contributes an another method using Genetic algorithm (GA) as a searching procedure for selecting best subset of variables which contributed more in evaluating the efficiency of DMU’s.
The present paper is organized as follows: Section 2 contains the proposed methodology with brief introduction to GA and selection of subsets of variables using GA. Section 3 gives full case study based on Indian banking sector, wherein, selection of banks, variables and data set are explained in detail. Section 4 presents results and discussion, followed by conclusion in section 5.
2. Proposed Methodology
The proposed method for selecting best set of variables for DEA is very simple. It is combined of two methods, firstly, from the initial set of input and output variables, subgroup of variables for input and output separately selected using GA search procedure for different number of combinations. Secondly, the method proposed by Ruiz, Pastor and Sirvent (2002) to construct the best set of input and output variables by running DEA for subgroup of variables ( this methodology explained directly in section 4.2).
2.1. Genetic AlgorithmThe concept of GA was introduced by Prof. John Holland and his students De Jong in the year 1975 ([12, 13, 14]). It was a variable searching process based on the principal laws of nature selection and genetics mechanisms viz., crossover, mutation and survival of the fittest to optimization and machine learning ([15, 16]). The basic concept of GA which needed to describe procedure is given here. For full detail information regarding GA refer [17]. The essential components of simple GA are i) chromosomes ii) fitness function and iii) genetic operator’s viz., crossover and mutation.


) [18]) PowerPoint Slide
PowerPoint Slide Larger image(png format)

With the aid of the subselect R package contributed by [19], best subset of variables for the study was obtained and the essence of the GA search procedure is given here. For full detail discussion of search procedure can be seen in [19, 20].
The procedure of selection process is simple and as follows. For any subgroup of variables (say,  ), a
), a  - variable subsets is randomly selected from the full data set of
  variables as an initial population (N), where (
 ). In each iteration, the number of child-bearing couples (parents) to be formed is half the size of the population (ie., N/2) and each couples generates a child (a new
  - variable subsets) which takes over all the properties of its parents. Each father is selected among the members of the population with probability proportional to his value of the criterion. For each father F, a mother M is selected with equal probability among the members of the population which have at least two variables not belonging to F. The child produced by each pair (F; M) includes all the variables which belong to both parents. The remaining variables are selected with equal probability from the parents’ symmetric difference with the additional restriction that at least one variable from M\F and one from F\M will be selected. Each offspring may optionally undergo a mutation in the form of a local improvement algorithm, with a user-specified probability. The parents and offspring are ranked according to their criterion value, and the best population of these
  -subsets will make up the next generation, which is used as the current population in the subsequent iteration. The stopping criterion for the number of generation is based on
  .
.
For measuring the quality of variable subset RM criteria was used. [21, 22] defined four different types of criteria to measure the quality of subset variables. RM criterion is equivalent to the second method of those four criteria. It is a simple concept, a weighted average of the multiple correlations between each principal component (PC) of the full data set and the r - subset variables. Further, RM criteria has also been referred by [19, 23]. The value of RM coefficient lies between 0 and 1.
2.3. RM Coefficient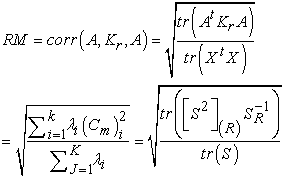 |
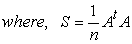
Where,
 |
 is the full data matrix;
 is the orthogonal projection matrix on the subspace spanned by a given
  variable subset;
 is the
  correlation of (covariance) matrix of the full data set;
 is the index set of the
  variables in the variable subset;
 is the
  principal submatrix of
  which results from retaining the rows and columns whose indices belongs to R;
 is the
  principal submatrix of
  obtained by retaining the rows and columns associated with set
 is
is  largest eigenvalue of the covariance (or correlation ) matrix defined by A;
 is the multiple correlation between the
  principal component of the full data set and the
  -variable subset.
3. Case Study: Indian Banking Sector
3.1. Initial Variables SelectionAccording to [24], in banking theory literature, there are two approaches for selection of input and output for DEA, viz., production and intermediation approach. The production approach defines the bank activity as production of services and views the banks as using physical inputs such as labor and capital to provide deposits and loans accounts. On the other hand, intermediation approach views banks as the intermediating funds between savers and investors. Banks collect deposits, using labor and capital, and then intermediate those sources of funds to loans and other earning assets. Intermediation approach is more suitable and most widely used in the banking literature reported by [25]. Production approach is more suitable for the analysis of bank branch efficiency and at the same time, intermediation approach more suitable for cross-sectional bank studies and also its quite popular in empirical research ([26, 27]). Therefore, in the present study, intermediation approaches are followed to estimate the efficiency of banks. Even then, it is possible to see that different authors using different variables for the same problem. Initial variables for the study are selected after carefully examining literatures based on efficiency estimation on Indian commercial banks. The maximum number of times repeated variables from recent literatures are taken as initial variables. In intermediation approach variable deposit is used as inputs. Table 1. shows the initial variables and its code.

 PowerPoint Slide
 Larger image(png format)
 View current table in a new window
Commercial banks in India (DMUs) for the present study are determined based on the following criteria i) Banks should be active in the Indian business market for a minimum period of five years (2008 – 2012), ii) Every selected bank should have more than 3 branches and 100 employees and iii) Banks should not be continuously in loss for 2 years. Based on the above conditions, 55 commercial banks were selected for the study of which 26 are public sector banks (six SBI and its association and twenty nationalized banks), 20 private sector banks (thirteen old and seven new private banks) and 9 foreign banks.
The present study deals with the secondary data for the year 2012 published in web pages of Reserved Bank of India (RBI) and Indian Banks’ Association (IBA) are used for the analysis efficiency of commercial banks in India. The initial data set consists of 55 banks and 15 variables (both inputs and outputs).
4. Result and Discussion
4.1. Selection of Best Subset of Inputs and Outputs Using GAAs stated earlier, Subselect R package contributed by [19] was used, and best subset of variables for the study was obtained. The process of selecting the best subset of variables was subjective in nature. Several solutions are generated using different number of  values viz (1, 2, 3…, n-1). Subsets of variables have been obtained separately for inputs and outputs using the dataset for the year 2012. At initial stage, eight input variables were selected for the present study. The variable TCO was removed before executing the GA due to correlation error encounter which affects the search algorithm while obtaining subsets. Similarly, TIE from output variable was also removed for the same reason. Therefore, maximum number of subset for input and output became six and five respectively. In DEA, [28] provides two thumb rules for the selection of sample size; a) n ≥ max(S * P), which states that sample size should be greater than or equal to product of inputs and outputs; b) n ≥ 3(S + P), states that the number of observation in the data should be at least three times the sum of the inputs and outputs, where n is the sample size (DMU’s), S is the number of inputs and P is the number of outputs. Based on these conditions, the present study uses maximum number of subsets available because number of commercial banks (DMU’s) was 55 which was greater than (S*P) = (6*5) = 30 and 3(S+P) = 3(6+5) = 33.

 PowerPoint Slide
 Larger image(png format)
 View current table in a new window
Table 2. shows the subset of input and output variables and its best value obtained from GA search procedure for different values of  . For r value 6 in input and 5 in output obtains the maximum best values (0.99955 and 0.99988).
By applying DEA ( input oriented – VRS ) technique, efficiency of banks was computed for different combinations of subsets of input and outputs. Analysis started with r = 1 for input and output (input variable DEP and output variable LAA). Model is named as M11. Further, computation was carried by keeping the same input and increasing the r value (2, 3, 4 and 5) for output and models named as, M12, M13, M14 and M15. Likewise, the same methodology was followed for the remaining subsets of both inputs and outputs reported elsewhere. A total of 35 models were constructed in the present study search process.
Table 3 exhibited the variables used in different models, number of efficiency, average efficiency scores and percentage of banks efficiency change by 10%. Selection process was done as follows. First, percentage difference of efficiency scores for model M11 and M12 were computed; approximately 84% difference was found which was greater than 10%, as a result, M12 model was retained. Then computed percentage difference between model M12 against M13 was found to be approximately 2% difference and again model M12 was retained and was kept as a base model till next model obtained had more than 10% of efficiency difference. While computing percentage difference between model M12 and M15 approximately 46% difference was found which is greater than 10%, as a result M15 retained as base model for computing difference with other models. This process was carried till end of the models (M65) and found none of the model obtained was greater than 10% difference and finally M15 was chosen as the best model for further study.

 PowerPoint Slide
 Larger image(png format)
 View current table in a new window
Final model for DEA is shown in Table 4.

 PowerPoint Slide
 Larger image(png format)
 View current table in a new window
5. Conclusion
For identifying the efficiency of banks, DEA technique was used as it is a non-parametric method, and it does not need any assumptions as parametric models. The calculation was simple due to mathematical programming technique and its simplicity attracted many researchers. Every method has its own drawbacks and one of the major problems with DEA is selecting a suitable or relevant variables. DEA is more sensitive to variables but does not provide any guidelines for the selection of variables, decision regarding choice of variables and it is left to researchers or experts. One of the main advantage of DEA than traditional efficiency identifying methods was using multiple numbers of inputs and outputs which pave path for researchers to create their own number of input and output variables. For the same problem, various researchers used different sets of input and output variables and even though there is no limit on the number of variables, the use of excessive number of variables will make all DMU’s as efficient, but at the same time, omission of some of the inputs can have a huge effect on the measure of technical efficiency. Therefore, selection of best set of input and output variables which contribute more to identify the efficient banks becomes necessary.
Several approaches have been proposed by different authors on the topic of selecting the relevant variables. In the present study, a new approach has been used in selecting best subset of variables using GA search procedure. With the help of the Subselect R package, best subset of variables for the present study was obtained. Initially, fifteen input and output variables regarding the banks efficiency were selected based on the literature review of Indian commercial banks. Subsets of variables have been obtained separately for inputs and outputs using the dataset for the year 2012. At initial stage, eight input and seven output variables were selected, of which one input (TCO) and output (TIE) variable was removed before executing the GA due to correlation error encounter which affects the search algorithm while obtaining subsets. Therefore, maximum number of subset for input and output becomes six and five respectively. The process of selecting the best subset of variables was subjective in nature and several solutions were generated using different number of r values viz., (1, 2, 3…, n-1). Based on the thumb rules provided by [28] the present study used maximum number of subsets available since number of commercial banks (DMU’s) was 55 which was greater than (S*P) = (6*5) = 30 and 3(S+P) = 3(6+5) = 33.
Therefore, by applying DEA, efficiency of banks was computed for different combinations of subsets of input and outputs. A total of 35 models were constructed in the present study search process and the best model was selected based on the 10% change in the efficiency scores of the banks.
References
| [1] | Dyson, R. G., Allen, R., Camanho, A. S., Podinovski, V. V., Sarrico, C. S and Shale, E.A., Pitfalls and protocols in DEA, European Journal of Operational Research, 132(2), 245-259, 2001. | ||
 In article In article | CrossRef | ||
| [2] | Galagedera, D.U. A and Silvapulle, P., Experimental Evidence on Robustness of Data Envelopment Analysis, Journal of the Operational Research Society, 54, 654-660, 2003. | ||
| In article | CrossRef | ||
| [3] | Sexton, T. R., Silkman, R. H and Hogan A. J., Data Envelopment Analysis: Critique and Extensions, New Directions for Program Evaluation, 32, 73-105, 1986. | ||
| In article | CrossRef | ||
| [4] | Smith, P., Model Misspecification in Data Envelopment Analysis, Annals of Operations Research, 73, 233-252, 1997. | ||
| In article | CrossRef | ||
| [5] | Natarja, N. R and Johnson, A. J., Guidelines for Using Variable Selection Technique in Data Envelopment Analysis, European Journal of Operation Research, 215, 662-669, 2011. | ||
| In article | CrossRef | ||
| [6] | Ruiz J.L.; Pastor, J.; Sirvent, I., A statistical test for radial DEA models, Operations Research, 50(4), 728-735, 2002. | ||
| In article | CrossRef | ||
| [7] | Jenkins, L and Anderson, M., A Multivariate Statistical Approach to Reducing the Number of Variables in Data Envelopment Analysis, European Journal of Operational Research, 147(1), 51-61, 2003. | ||
| In article | CrossRef | ||
| [8] | Ruggiero, J., Impact Assessment of Input Omission on DEA, International Journal of Information Technology and Decision Making, 4(3), 359-368, 2005. | ||
| In article | CrossRef | ||
| [9] | Morita, H and Haba,Y., Variable Selection in Data Envelopment Analysis Based on External Information, Proceedings of the Eighth Czech-Japan Seminar on Data Analysis and Decision Making Under Uncertainty, 181-187, 2005. | ||
| In article | |||
| [10] | Edirisinghe, N. C. P and Zhang, X., Generalized DEA Model of Fundamental Analysis and Its Application to Portfolio Optimization, Journal of Banking and Finance, 31, 311-335, 2007. | ||
| In article | CrossRef | ||
| [11] | Morita. H and Avkiran. N. K., Selecting Inputs and Outputs in Data Envelopment Analysis by Designing Statistical Experiments, Journal of Operation Research Society of Japan, 52 (2), 163-173, 2009. | ||
| In article | |||
| [12] | Coley, A. D., An Introduction to Genetic Algorithm for scientists and Engineers, World Scientific, Singapore, 1999,188. | ||
| In article | CrossRef | ||
| [13] | Pham, D.T and Karaboga, D., Intelligent Optimization Techniques, Springer, London, Great Britain, 261, 2000. | ||
| In article | CrossRef | ||
| [14] | Holger F., Feature Selection for Support Vector Machines by Means of Genetic Algorithm, Diploma Thesis in Computer Science, Philipps Univesity, Marburg, 2002. | ||
| In article | |||
| [15] | Tang, K.S., Man, K.F., Kwong, S and HE, Q., Genetic Algorithm and Its Applications, IEEE Signal Processing Magazine, 22-37, 1996. | ||
| In article | |||
| [16] | Kim, H. S and Cho, S. B., An Efficient Genetic Algorithm with Less Fitness Evolution by Clustering, Proceedings of the IEEE Congress on Evolutionary Computation Seoul, Korea, May, 27-30, 887-894, 2001. | ||
| In article | |||
| [17] | Melanie M., An Introduction to Genetic Algorithms, A Bradford Book, The MIT Press, London, 1998. | ||
| In article | |||
| [18] | Trevino, V and Falciani, F., GALGO: an R Package for Multivariate Variable Selection Using Genetic Algorithms, Bioinformatics, 22(9), 1154-1156, 2006. | ||
| In article | CrossRef | ||
| [19] | Cadima, J., Cerderira, J,O., Silva, P.D and Minhoto, M., The subselect R package, (2012). Available at: http://cran.r-project.org/web/packages/subselect/subselect.pdf. | ||
| In article | |||
| [20] | Cadima, J., Cerdeira J.O and Minhoto, M., Computational aspects of algorithms for variable selection in the context of principal components, Computational statistics and Data Analysis, 47, 225-236, 2004. | ||
| In article | CrossRef | ||
| [21] | McCabe, G. P., Principal variables, Technometrics, vol.26 (2), pp.137-144, 1984. | ||
| In article | CrossRef | ||
| [22] | McCabe, G. P., Prediction of Principal Components by Variables Subsets, Technical Report 86-19, Department of Statistics, Purdue University, 1986. | ||
| In article | |||
| [23] | Cadima, J and Jolliffe, I. T., Variable Selection and the Interpretation of Principal Subspaces, Journal of Agricultural, Biological, Environment Statistics, 6(1), 62-79, 2001. | ||
| In article | CrossRef | ||
| [24] | Sealey, C and Lindley J. T., Inputs, outputs and a theory of production and cost at depository financial institution, Journal of Finance, 32, 1251-1266, 1977. | ||
| In article | CrossRef | ||
| [25] | Berger, A. N and Humphrey, D. B., Efficiency of Financial Institutions: International Survey and Directions for Future Research, European Journal of Operational Research, 98, 175-212, 1997. | ||
| In article | CrossRef | ||
| [26] | Colwell and Davis., Output and Productivity in Banking, Scandinavian Journal of Economics, 94 (Supplement), 111-129, 1992. | ||
| In article | CrossRef | ||
| [27] | Favero, C.A. and Papi, L., Technical efficiency and scale efficiency in the Italian banking sector, Applied Economics, 27(4): 385-395, 1995. | ||
| In article | CrossRef | ||
| [28] | Cooper, W. W., Seiford, L. M and Tone, K., Data Envelopment Analysis, A Comprehensive Text with Models, Applications, References and DEA-Solver Software, Second Edition. USA: Springer, 2007. | ||
| In article | |||

 CiteULike
 Delicious

