This study aimed to assess the retention of grade 12 students in statistics and probability, along with a comparative analysis of these retentions across the distinct topics of the subject. Statistics and probability subjects were taken by the students when they were in grade 11. Employing a quantitative approach, the research used descriptive-comparative design to describe the level of retention of the students and compare the retention of the students in each topic. These encompass random variables and probability distribution, normal distribution, sampling and sampling distribution, and estimation parameters. The retention of the students studying at Nueva Vizcaya General Comprehensive High School, a public school in Nueva Vizcaya, Philippines was analyzed through the validated retention test administered to them. Using frequency count and percent, the result revealed that the grade 12 students’ retention was described as “poor retention rate”. Repeated-measures ANOVA confirmed that the retention of the students in all the topics are all poor. Hence, teachers should consider making an intervention to improve the retention of the students in statistics and probability. They may consider innovative ways to engage the students in learning. Also, the factors that influence the students in solving problems in designing the interventions.
Statistics is the art of data learning. To understand more about something, gathering data should be done first. Statistics concerns the compilation of data, its subsequent description, interpretation, and drawing of conclusions 1. But without applying probability theory, a student cannot appreciate the true essence of data analysis. Elements of probability help us infer with confidence. As such, probability principles are a major counterpart to statistical methods and allow one to measure the importance of statistics 2.
In the Philippines’ K to 12 curriculum, statistics and probability is introduced as early as elementary years from Grade 1 to Grade 6 during the fourth quarter of the academic year 3. For the secondary level, it is offered in the seventh, eighth, tenth, and eleventh grades. In the tenth grade of junior high school, the third and fourth quarters are allotted for teaching the subject. Thus, Grade 11 students take classes in this subject during the second half of the academic year regardless of the career track chosen. The integration of this subject aims to foster worldwide competitiveness and equip learners with mathematical skills. However, the first-ever participation of the Philippines in the Program for International Student Assessment (PISA), showed that Filipino learners placed near last in science and mathematics among the 79 participating countries in the PISA 4, 5. Filipino students scored 353 points in mathematics against the 489 Organization for Economic Co-operation and Development (OECD) average 6. In addition, the results of students in local examinations display low performance in mathematics. According to the Department of Education (DepEd) 2019-Year End Report regarding the National Achievement Test (NAT), the results displayed low proficiency levels, especially in science, English, and mathematics 7. It is noted that NAT is administered for Grade 6, Grade 10, and Grade 12 students.
Addressing the challenges in mathematics education goes beyond understanding difficulties in learning the subject matter; it involves considering students’ retention. Retention is needed to expand the cognitive abilities of children, logical thinking, self-sufficiency, and empowering memory, all of which are objectives of mathematics education 8.
Moreover, there are reports of difficulties in retaining information and basic concepts after the initial teaching phase is evident among students. Thus, there is a need for interventions to improve cognitive retention 9. In addition, reports show that students have difficulties in understanding content areas in statistics and probability. Based on the findings, there is a deficiency of students in retention of skills before instruction. Thus, this should be addressed to avoid low performance in upcoming assessments on the subjects. Furthermore, the root cause of misconceptions is the retention of skills learned during instruction 10. Studies such as Bachelor, Vaughan, and Wall 11, Tintle, Topliff, VanderStoep, Holmes and Swanson 12, and Guvercin, Cilavdaroglu, and Savas 13, and Hamalia and Hamanenga 14 assessed the effects of an intervention on mathematics achievement and retention and the results showed that their intervention showed a positive effect on students’ retention. Ajai and Imoko 15 studied if there is a difference in mathematics effect on achievement and retention when grouped according to gender.
Furthermore, the covid-19 pandemic brought unprecedented challenges to education including the shift from face-to-face to distance learning. The covid-19 pandemic stopped face-to-face education to stop the virus from spreading. The Department of Education through the 2020 Education (DepEd) Order No. 12 recommended different learning methods, including online Hybrid, modular, and TV/radio methods 16. One significant element to consider in the teaching-learning process is how the material is taught because teachers are not used to teaching and learning via online modalities. Students and teachers are significantly impacted 17.
Considering the crucial role of statistics and probability in mathematics education and the impact of retention on the students’ performance, this study aimed to determine the retention of the Grade 12 students in Statistics and Probability during Covid-19. Moreover, comparison between and among the retention in each of the topics in Statistics and Probability was also explored to determine what topics need to be emphasized in teaching this subject.
The study used a quantitative approach, particularly descriptive design. The study was conducted at Nueva Vizcaya, General Comprehensive High School (NVGCHS), one of the largest public high school in Nueva Vizcaya, Philippines. Grade 12 students who studied statistics and probability in their eleventh grade were the respondents of the study. There were only twenty (20) STEM students who willingly responded and answered the retention tests. This is one of the limitations of covid-19 especially since the test was given online. The questionnaire for identifying the retention of students towards statistics and probability was validated by four experts. Validator 1 has a doctorate degree, is the Program Chair of the College of Arts and Science Graduate Program of a public state university with 22 years of teaching experience. Validator 2 has a doctorate degree, is Master Teacher I in the Department of Education (DepEd) with 20 years of teaching experience. Validator 3 has a doctorate degree, Teacher III in DepEd with three years of teaching experience. Validator 4 has a doctorate degree, and a faculty at a private university with ten years of teaching experience.
The retention test on statistics and probability was used to measure students’ retention. The coverage was Grade 11 statistics and probability topics and corresponding learning competencies. The topics involved were random variables and probability distribution, normal distribution, sampling and sampling distribution, and estimation parameters. It is a multiple-choice type of test. There were four available choices for students to choose from. In addition, the validity of the researcher-made examination was tested.
The validity results showed that it is valid in terms of clarity and direction of the items (M= 3.25), valid in terms of presentation and organization of items (M=3.25), highly valid for suitability of items (M=3.50), highly valid in terms of its adequateness of the content (M= 3.50), highly valid for the attainment of the purpose of the questionnaire (M= 3.75), highly valid in terms of its objective (M=4.00), and highly valid for scale and evaluation of rating (M=3.50). In general, the questionnaire is highly valid (M=3.54). In terms of its reliability, it has a 0.79 coefficient alpha. This indicates that the reliability test result is acceptable.
The answers of Grade 12 students for the statistics and probability retention test were scored. Every correct response to each item was scored 1 and 0 otherwise. Scores were converted to percent scores to determine the retention rate.
The retention of students in statistics and probability was analyzed and interpreted using Table 1. The DepEd Order No. 8 series of 2015 grading scale with the corresponding descriptor was modified in interpreting the retention rate of the students.
Moreover, frequency counts and percent were used in the tabulation of the summary scores of students in each of the learning competencies of the retention tests. Mean was computed to determine the overall rating of retention of students.
In finding out if significant difference exists between and among the retention of the students in the different topics in Statistics and Probability, preliminary analysis was done to check the assumptions of the tests. The data were checked using one-sample Kolmogorov-Smirnov test because the sample size is less than 30. Table 2 shows the result of one sample Kolmogorov Smirnov test.
As shown in the table, the p-values of the normality test are beyond 0.05, indicating that the retentions in each topic are normally distributed. Hence, the appropriate test for comparing the retentions was parametric test. The Repeated Measures Analysis of Variance (ANOVA) was performed to answer this problem.
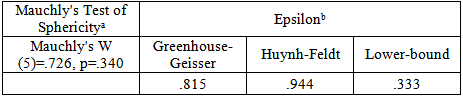
Another assumption of the test is the sphericity. Mauchly's Test of Sphericity was used to check this. Table 3 shows the test for assumption on sphericity.
The retention of students was determined under each of the learning competencies. In every learning competency, frequencies and percent of students who answered the items correctly in the retention tests are presented. Table 4 presents the different learning competencies for the topic of random variables and probability distribution.
As shown in Table 4, the students have poor retention rates in all the competencies in random variables and probability distribution except in finding the possible values of a random variable (fairly satisfying) and interpreting the mean and the variance of a discrete random variable (satisfying).
Figure 1 shows the sample problems for solving probabilities corresponding to a given random variable. In this item, the retention rate of students was poor.
As shown in Figure 2, the item is about solving probabilities corresponding to a given random variable. For this item, 70% of students answered A; 10% answered B; 15% answered C; and 5% answered D. The correct answer for this item is letter B, the probability that students will borrow at least two books means borrowing exactly two books or more than two books. This shows that only 10% of the students got the item correctly. Most of the students answered letter A (incorrect answer), which just corresponds to the probability that the students will borrow exactly two books.
Meanwhile, Figure 2 shows the item question wherein the students find for the possible values of a random variable that is fairly satisfying. For this item, students have fairly satisfying retention rate.

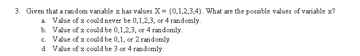
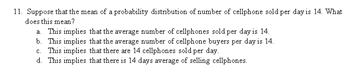
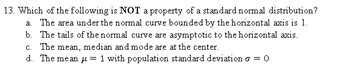
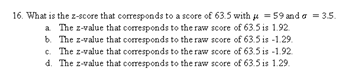
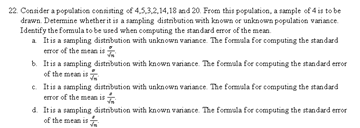
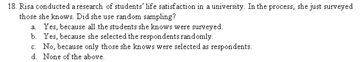
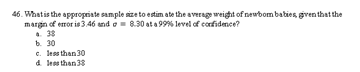
Figure 3 shows the corresponding item for finding the possible values of a random variable. For this item, 15% of students answered A; 75% of students answered B; 10% answered C; and no student answered D. The correct answer for this item is letter B, the possible values of the random variable could be 0,1,2, 3, or 4. Majority of students got the correct answer. This indicates that the majority of students can find the possible values of the given random variable.
In addition, the students have satisfying retention rates for interpreting the mean and variance of a random variable. Figure 3 shows the sample item for this learning competency.
Figure 3 shows the corresponding item for interpreting the mean and the variance of a discrete random variable. For this item, 80% of students answered A; 5% answered B; 10% answered C; and 5% answered D. If the mean of the probability distribution for the number of cellphones sold per day is 14, this implies that the average number of sold per day is 14. Majority (80%) of the students got the item correct.
Table 5 presents the different learning competencies for the topic on normal distribution. The frequencies, percent, and qualitative description for retention rates of students are displayed.
As shown in Table 5, the students got poor retention rates for all the learning competencies for normal distribution.
Figure 4 shows the corresponding item for illustrating a normal random variable and its characteristics. For this competency, the students have a poor retention rate.
Figure 4 displays the item to illustrate a normal random variable and its characteristics. Students were to choose which of the given choices is not a property of a standard normal distribution. For this item, 15% of students answered A; 30% of students answered B; 35% of students answered C; and 20% of the students answered D. 20% of students got the correct answer which is letter D, the mean is 1 and population standard deviation of 0. The property of a standard normal table is with a mean of 0 and a population standard deviation of 1. All the other choices are the true property of a standard normal table.
Meanwhile, Figure 5 shows one of the items wherein 70% of the students got the correct answer, one of the highest percent of students getting the correct answer about normal distribution but still considered as having a poor retention rate.
As shown in Figure 5, the item measures student’s understanding of converting a normal random variable to a standard normal variable. Students were to use a formula to convert the given raw to get its z-value. For this item, 5% of students answered A; 10% of students answered B; 15% of students answered C; and 70% of students answered D. Majority (70%) of students know how to convert a normal random variable to a standard normal variable.
For the third topic covered in this study, Table 6 indicates the retention rate of students on the sampling and sampling distribution of the sample mean. The frequencies, percent, and qualitative descriptions for retention rates of students are displayed.
As shown in Table 6, students have a poor retention rate in all the learning competencies under-sampling distribution of the sample mean except in illustrating random sampling.
Figure 6 shows the corresponding item for illustrating a normal random variable and its characteristics. For this competency, the students have poor retention rate.
As shown in Figure 6, the item measures students understanding of defining the sampling distribution of the sample mean for a normal population when the variance is known and unknown. Given the specific given and situation, students were to determine if the sampling distribution is with known or unknown population variance, and based on this, they were to identify the formula to be used for the computation of the standard error. For this item, 40% of students answered A; 20% of students answered B; 25% of students answered C; and 15% of students answered D. Most of the students (20%) got the item correctly. This means that some have identified that in the given population of the given problem, the mean and variance of the sampling distribution can be computed, while most students (40%) considered the distribution to have unknown variance.
On the other hand, students have a very satisfying rate of illustrating a random sampling. Eighty-five percent (85%) of students got the corresponding item correctly. Figure 7 shows the corresponding item for illustrating a random sampling.
As shown in Figure 7, the item measures students understanding of illustrating random sampling. Students were asked if random sampling was used given the scenario. For this item, 10% of students answered A; 5% of students answered B; 85% of students answered C; and no student answered D. Majority of the students (85%) got the item correctly. This indicates that majority of students can illustrate or identify if the given scenario used random sampling or not.
As shown in Table 7, the students have poor retention in almost all except one of the learning competencies under estimation of parameters, illustrates point and interval estimations.
Figure 8 shows the corresponding item for computing an appropriate sample size using the length of the interval. For this item, students have poor retention rates. This is also the item having the lowest percent (15%) of students getting the correct answer for estimation of parameters. For this competency, the students have a poor retention rate.
As shown in Figure 8, the item measures students’ understanding of computing for an appropriate sample size using the length of the interval. Students are asked to find the appropriate sample size to estimate the average weight of newborn babies. For them to answer the item correctly, they also must apply the formula for getting the appropriate sample size. For this item, 15% of students answered A; 45% of students answered B; 30% of students answered C; and lastly 10% of students answered D. Fifteen percent (15%) of students got the item correctly. This means that few students can identify the appropriate sample size.
Only one of the learning competencies under estimation of parameters have a fairly satisfying rate. Seventy-five percent (75%) of students got the correct answer for distinguishing between point and interval estimation. Figure 9 shows the corresponding item for this competency in the retention tests.
As shown in Figure 10, the item measures the understanding of students about point and interval estimates. Students were asked to determine if the identified statements are true about point and interval estimates. For this item, 20% of students answered A; 75% of students answered B; 5% of students answered C; and no student answered D. Seventy-five percent (75%) of the students answered the item correctly. This means that majority of the students have distinguished the difference between point and interval estimate.
In general, students have poor retention rate in majority of the learning competencies for topics about random variables and probability distribution, normal distribution, sampling and sampling distribution, and estimation of parameters. On the other hand, students have a fairly satisfying rate of finding the possible values of a random variable and distinguishing between point and interval estimates. They have a satisfying rate in interpreting the mean and the variance of a discrete random variable. Moreover, they have a very satisfying rate for illustrating random sampling. The findings are similar to Guvercin, et.al 13 who found lower retention of the students regardless of the intervention such as the traditional method. Bachelor, Vaughan, and Wall 11revealed that students reported issues with retaining information. In particular, teachers stated that students could not recall information and remember essential concepts. Curriculum review indicated that there is a need to do an intervention to improve cognitive retention. Hamalia and Hamanenga 14 justified that there is a learning difficulty shown by students leading to poor performance in probability and mathematics. This led to the use of a discovery learning approach to find out if it can influence students’ achievement and retention in probability. Rosli, Capraro, and Capraro 18 assessed the effects of problem posing intervention on 9th-grade students’ mathematics achievement and retention. They found a favorable result in retention in mathematics after using the problem-posing method in teaching the topic of triangles. Similarly, Tintle, Topliff, VanderStoep, Holmes, and Swanson 12found a higher level of retention among introductory statistics students. Hamalia and Hamanenga 14 found a statistically significant increase in achievement scores and retention scores in probability when the discovery learning approach was used. Bachelor, Vaughan, and Wall 11 found a positive change in cognitive retention after using a variety of active learning techniques which were student-centered. This shows that teachers need to do something that will help the students improve their retention rate. Moreover, teachers must also consider possible factors affecting the students in solving mathematical tasks such as their attitudes, time limit, beliefs and learning style, and using metacognitive strategy knowledge 19.

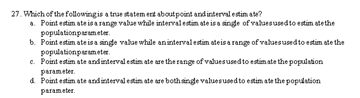
Table 8 displays the repeated measures ANOVA result.
As gleaned on the table, the mean scores reveals that the retention of the students in random variable and probably distribution was the highest (m=51.67, s=23.195), followed by normal distribution (m=49.00, s=32.751), estimation of parameters (m=47.27, s=14.554) and the lowest was sampling and sampling distribution (m=36.88, s=19.649). The retention of the students in each of the topics were below 75% indicating that the students have poor retention rate in all the topics. This was also confirmed by the Huynh-Feldt result showing that the retention in each of the topics in Statistics and Probability was not statistically significant, F(2.832)=2.171, p=.106. Hence, the retentions of the students in the topics of Statistics and Probability are the same. Generally, all of these topics must be given emphasis in teaching this subject.
The students’ overall retention in statistics and probability is described as poor retention rate. The learning competencies that had good retention results were finding the possible values of a random variable, distinguishing point, and interval estimate, interpreting the mean and the variance of a discrete random variable, and illustrating random sampling. However, generally, the retention of the students in each topic of Statistics and Probability is poor. In the related studies, interventions were recommended and employed by the teachers to improve the achievement or retention of the students such as problem-posing and student-centered active learning techniques. In designing an intervention, possible factors that influence students in doing mathematical tasks must also be considered.
We thank the Department of Science and Technology – Science Education Institute for the financial support through the Capacity Building Program in Science and Mathematics Education Scholarship.
| [1] | Ross, S. M. (2020). Introduction to probability and statistics for engineers and scientists (6th ed.). Academic Press. https://bit.ly/41CPgeX | ||
| In article | |||
| [2] | Walpole, R., Myers, R., Myers, S., & Ye, K. (2012). Probability and statistics for engineers and scientists (9th ed, p. 4). Pearson. https://www.pearson.com/us/higher-education/product/Walpole-Probability-and-Statistics-for-Engineers-and-Scientists-9th-Edition/9780321629111.html | ||
| In article | |||
| [3] | K to 12 Curriculum Guide MATHEMATICS | Joe Plasabas - Academia.edu. (2016b). Academia.Edu - Share Research. https://www.academia.edu/33308395/K_to_12_Curriculum_Guide_MATHEMATICS | ||
| In article | |||
| [4] | Paris, J. (4 December 2019,). Philippines ranks among lowest in reading, math, and science in 2018 study. Rappler; https://www.rappler.com/nation/philippines-ranking-reading-math-science-pisa-study-2018 | ||
| In article | |||
| [5] | Gamboa, R. (12 December 2019). When teachers need to relearn | Philstar.com. Philstar.Cm; Philstar.com.https://www.philstar.com/business/2019/12/12/1976242/when-teachers-need-relearn | ||
| In article | |||
| [6] | Magsambol, B. (9 December 2020,). PH lowest among 58 countries in math, science – global assessment. Rappler; Rappler. https://www.rappler.com/nation/filipino-students-lagging-behind-math-science-timms-international-results-2019 | ||
| In article | |||
| [7] | Gonzales, E. (22 December 2019). Year-end report: DepEd in 2019: The quest for quality education continues - Manila Bulletin. Manila Bulletin; https://www.facebook.com/manilabulletin/. https://mb.com.ph/2019/12/29/year-end-report-deped-in-2019-the-quest-for-quality-education-continues/ | ||
| In article | |||
| [8] | Rosli, R., Capraro, M. M., & Capraro, R. M. (2014). The effects of problem posing on student mathematical learning: A meta-analysis. International Education Studies, 7 (13), 227-241. | ||
| In article | View Article | ||
| [9] | Bachelor, R. L., Vaughan, P. M., & Wall, C. M. (2012). Exploring the effects of active learning on retaining essential concepts in secondary and junior high classrooms. Online Submission. https://files.eric.ed.gov/fulltext/ED531546.pdf | ||
| In article | |||
| [10] | Capate, R. N. A., & Lapinid, M. R. C. (2015). Assessing the mathematics performance of grade 8 students as basis for enhancing instruction and aligning with K to 12 curriculum. Proceedings of the De La Salle Research Congress, 3 (1), 1–7. https://goo.gl/EkdpDG | ||
| In article | |||
| [11] | Bachelor, R. L., Vaughan, P. M., & Wall, C. M. (2012). Exploring the effects of active learning on retaining essential concepts in secondary and junior high classrooms. Online Submission. https://files.eric.ed.gov/fulltext/ED531546.pdf | ||
| In article | |||
| [12] | Tintle, N. L., Topliff, K., VanderStoep, J., Holmes, V. L., & Swanson, T. (2012). Retention of statistical concepts in a preliminary randomization-based introductory statistics curriculum. Statistics Education Research Journal, 11(1), 21. https://iaseweb.org/documents/SERJ/SERJ11(1)_Tintle.pdf?1402525003 | ||
| In article | View Article | ||
| [13] | Guvercin, S., Cilavdaroglu, A. K., & Savas, A. C. (2014). The effect of problem posing instruction on 9th grade students’ mathematics academic achievement and retention. The Anthropologist, 17 (1), 129-136. | ||
| In article | View Article | ||
| [14] | Hamalia, M. M., & Hamanenga, J. (2020). Impact of discovery learning on students’ achievement and retention in probability: A case study of Chinika Secondary School. Research and Scientific Innovation Society (RSIS International). https://www.rsisinternational.org/virtual-library/papers/impact-of-discovery-learning-on-students-achievement-and-retention-in-probability-a-case-study-of-chinika-secondary-school/ | ||
| In article | |||
| [15] | Ajai, J. T., & Imoko, B. I. (2015). Gender differences in mathematics achievement and retention scores: A case of problem-based learning method. International Journal of research in Education and Science, 1(1), 45-50. https://files.eric.ed.gov/fulltext/EJ1105194.pdf | ||
| In article | View Article | ||
| [16] | Canilao, C.M. & Gurat, M.G.(2023). Comparing Mathematics Achievement: Control vs. Experimental Groups in the Context of Mobile Educational Applications. American Journal of Educational Research,11(6):348-358.pubs.sciepub.com/education/11/6/2/index.html. | ||
| In article | View Article | ||
| [17] | Aquino, E.T.M., & Gurat, M.G. (2023). Satisfaction of Students in the Methods Used in Mathematics in the Modern World in a New Normal. American Journal of Educational Research, 11(3):144-150. pubs.sciepub.com/education/11/3/7/index.html. | ||
| In article | View Article | ||
| [18] | Rosli, R., Capraro, M. M., & Capraro, R. M. (2014). The effects of problem posing on student mathematical learning: A meta-analysis. International Education Studies, 7 (13), 227-241. | ||
| In article | View Article | ||
| [19] | Gurat, M. & Medula, C. Jr. (2016). Metacognitive Strategy Knowledge Use through Mathematical Problem Solving amongst Pre-service Teachers. American Journal of Educational Research, 4(2): 170-189 | ||
| In article | |||
Published with license by Science and Education Publishing, Copyright © 2023 Cathlyn P. Dumale and Melanie G. Gurat
![]() This work is licensed under a Creative Commons Attribution 4.0 International License. To view a copy of this license, visit
http://creativecommons.org/licenses/by/4.0/
This work is licensed under a Creative Commons Attribution 4.0 International License. To view a copy of this license, visit
http://creativecommons.org/licenses/by/4.0/
| [1] | Ross, S. M. (2020). Introduction to probability and statistics for engineers and scientists (6th ed.). Academic Press. https://bit.ly/41CPgeX | ||
| In article | |||
| [2] | Walpole, R., Myers, R., Myers, S., & Ye, K. (2012). Probability and statistics for engineers and scientists (9th ed, p. 4). Pearson. https://www.pearson.com/us/higher-education/product/Walpole-Probability-and-Statistics-for-Engineers-and-Scientists-9th-Edition/9780321629111.html | ||
| In article | |||
| [3] | K to 12 Curriculum Guide MATHEMATICS | Joe Plasabas - Academia.edu. (2016b). Academia.Edu - Share Research. https://www.academia.edu/33308395/K_to_12_Curriculum_Guide_MATHEMATICS | ||
| In article | |||
| [4] | Paris, J. (4 December 2019,). Philippines ranks among lowest in reading, math, and science in 2018 study. Rappler; https://www.rappler.com/nation/philippines-ranking-reading-math-science-pisa-study-2018 | ||
| In article | |||
| [5] | Gamboa, R. (12 December 2019). When teachers need to relearn | Philstar.com. Philstar.Cm; Philstar.com.https://www.philstar.com/business/2019/12/12/1976242/when-teachers-need-relearn | ||
| In article | |||
| [6] | Magsambol, B. (9 December 2020,). PH lowest among 58 countries in math, science – global assessment. Rappler; Rappler. https://www.rappler.com/nation/filipino-students-lagging-behind-math-science-timms-international-results-2019 | ||
| In article | |||
| [7] | Gonzales, E. (22 December 2019). Year-end report: DepEd in 2019: The quest for quality education continues - Manila Bulletin. Manila Bulletin; https://www.facebook.com/manilabulletin/. https://mb.com.ph/2019/12/29/year-end-report-deped-in-2019-the-quest-for-quality-education-continues/ | ||
| In article | |||
| [8] | Rosli, R., Capraro, M. M., & Capraro, R. M. (2014). The effects of problem posing on student mathematical learning: A meta-analysis. International Education Studies, 7 (13), 227-241. | ||
| In article | View Article | ||
| [9] | Bachelor, R. L., Vaughan, P. M., & Wall, C. M. (2012). Exploring the effects of active learning on retaining essential concepts in secondary and junior high classrooms. Online Submission. https://files.eric.ed.gov/fulltext/ED531546.pdf | ||
| In article | |||
| [10] | Capate, R. N. A., & Lapinid, M. R. C. (2015). Assessing the mathematics performance of grade 8 students as basis for enhancing instruction and aligning with K to 12 curriculum. Proceedings of the De La Salle Research Congress, 3 (1), 1–7. https://goo.gl/EkdpDG | ||
| In article | |||
| [11] | Bachelor, R. L., Vaughan, P. M., & Wall, C. M. (2012). Exploring the effects of active learning on retaining essential concepts in secondary and junior high classrooms. Online Submission. https://files.eric.ed.gov/fulltext/ED531546.pdf | ||
| In article | |||
| [12] | Tintle, N. L., Topliff, K., VanderStoep, J., Holmes, V. L., & Swanson, T. (2012). Retention of statistical concepts in a preliminary randomization-based introductory statistics curriculum. Statistics Education Research Journal, 11(1), 21. https://iaseweb.org/documents/SERJ/SERJ11(1)_Tintle.pdf?1402525003 | ||
| In article | View Article | ||
| [13] | Guvercin, S., Cilavdaroglu, A. K., & Savas, A. C. (2014). The effect of problem posing instruction on 9th grade students’ mathematics academic achievement and retention. The Anthropologist, 17 (1), 129-136. | ||
| In article | View Article | ||
| [14] | Hamalia, M. M., & Hamanenga, J. (2020). Impact of discovery learning on students’ achievement and retention in probability: A case study of Chinika Secondary School. Research and Scientific Innovation Society (RSIS International). https://www.rsisinternational.org/virtual-library/papers/impact-of-discovery-learning-on-students-achievement-and-retention-in-probability-a-case-study-of-chinika-secondary-school/ | ||
| In article | |||
| [15] | Ajai, J. T., & Imoko, B. I. (2015). Gender differences in mathematics achievement and retention scores: A case of problem-based learning method. International Journal of research in Education and Science, 1(1), 45-50. https://files.eric.ed.gov/fulltext/EJ1105194.pdf | ||
| In article | View Article | ||
| [16] | Canilao, C.M. & Gurat, M.G.(2023). Comparing Mathematics Achievement: Control vs. Experimental Groups in the Context of Mobile Educational Applications. American Journal of Educational Research,11(6):348-358.pubs.sciepub.com/education/11/6/2/index.html. | ||
| In article | View Article | ||
| [17] | Aquino, E.T.M., & Gurat, M.G. (2023). Satisfaction of Students in the Methods Used in Mathematics in the Modern World in a New Normal. American Journal of Educational Research, 11(3):144-150. pubs.sciepub.com/education/11/3/7/index.html. | ||
| In article | View Article | ||
| [18] | Rosli, R., Capraro, M. M., & Capraro, R. M. (2014). The effects of problem posing on student mathematical learning: A meta-analysis. International Education Studies, 7 (13), 227-241. | ||
| In article | View Article | ||
| [19] | Gurat, M. & Medula, C. Jr. (2016). Metacognitive Strategy Knowledge Use through Mathematical Problem Solving amongst Pre-service Teachers. American Journal of Educational Research, 4(2): 170-189 | ||
| In article | |||


