Non-revenue water (NRW) presents a critical challenge to water security in Sub-Saharan Africa, directly undermining the financial viability and operational efficiency of public utilities. However, comprehensive studies quantifying its multifaceted impacts and root causes within specific utility contexts remain limited. This study addresses this gap through a mixed-methods assessment of the Société Nationale des Eaux du Bénin (SONEB) in Parakou, Benin. Analysis of utility records (2012-2024), household surveys (n=204), and semi-structured staff interviews (n=17) quantified NRW and evaluated its impacts across technical, commercial, financial, institutional, and customer-oriented performance dimensions. Results identify an NRW rate of 39% in 2024, significantly exceeding best-practice thresholds. While 96.6% of customers reported a reliable water supply, a critical service paradox exists: satisfaction is severely undermined by billing inefficiencies, with 54.1% experiencing delayed bills and 68.1% perceiving tariffs as excessive. Financially, the utility is crippled by a revenue collection efficiency averaging only 50.7%. The drivers are systemic, encompassing aging infrastructure, frequent leaks, absence of network sectorization, illegal connections, metering inaccuracies, and the critical institutional gap created by the dissolution of the dedicated NRW management unit. The study concludes by proposing evidence-based recommendations for SONEB, which are scalable to comparable utilities in the region to transition towards financial sustainability and improved service delivery.
Water resource management has become as a global priority in response to accelerating population growth, climate, and land use changes. Ensuring equitable access to safe and reliable water supplies is especially challenging in urban centers of low- and middle-income countries, where population growth rates are among the highest worldwide 1. In many of these settings, national and municipal authorities respond to rising demand primarily by expanding production capacity; however, financial and technical constraints frequently limit the feasibility of such investments, making optimization of existing assets a more sustainable and cost-effective alternative. International policy and scholarly literature increasingly assert that reducing water losses should be a priority for utilities, as this enables more efficient service delivery without costly increases in production capacity 2.
Despite this recognition, for many utilities in low- and middle-income countries, increased operational costs associated with water losses are often offset through tariff increases rather than through preventive investments, such as systematic leak detection, pressure management, or comprehensive network rehabilitation 3. Globally, between 25% and 50% of distributed water is estimated to be lost or unbilled owing to illegal connections, faulty billing, meter inaccuracies, network leaks, aging infrastructure, and inadequate pressure control 4. This phenomenon, commonly referred to as non-revenue water (NRW), is particularly pronounced in developing countries where institutional and technical capacities for loss management are limited 5.
The magnitude of NRW is substantial. In 2019, global losses were estimated at 346 million m3 day-1 (126 billion m³ yr-1), corresponding to an annual financial loss on the order of US$39 billion 6. NRW levels in low-income countries often reach 50-60% of supplied volumes, relative to a global average near 35% 7. The World Bank recommends that efficient utilities maintain NRW below 23%, a target that is exceeded by the majority of utilities worldwide 8.
In Africa, an audit of 19 utilities reported an average NRW of 39% of system input volume 2. High NRW levels not only reduce water availability but also erode utilities’ revenues, increase operating costs, and constrain funds for network expansion and service improvement, thereby limiting utilities’ capacity to extend services to underserved populations.
The persistence of high NRW is commonly attributed to a constellation of factors, including limited technical capacity, obsolete infrastructure, insufficient equipment, and weak institutional arrangements 9. Human error and poor maintenance exacerbate meter inaccuracies, leave leaks undetected, and undermine data management systems 10. Historically, water losses were often overlooked because water was perceived as abundant and inexpensive 9. However, rising population densities, increasing operational costs, and tightening water-quality standards have rendered the neglect of NRW unsustainable.
In Benin, urban water supply is managed by the Société Nationale des Eaux du Bénin (SONEB). In 2019, SONEB reported a national NRW rate of 33% 11, exceeding the 25% threshold commonly cited for efficient utilities 12. This pattern reflects broader trends in sub-Saharan Africa, where NRW frequently surpasses 30% 13, 14. Country-level and regional studies point to similar drivers: in Cameroon, losses reaching 52.5% have been linked to aging infrastructure and weak coordination 15; in Ghana, governance deficits and fragmented regulatory oversight have been associated with NRW above 45% 16; and in Nigeria, the absence of dedicated NRW management units and performance-based systems has impeded effective control 9.
Parakou, Benin’s third largest city, exemplifies the operational constraints posed by limited supply options and deteriorating infrastructure. Since 1975, Parakou has relied primarily on surface water from the Okpara Dam, which offers restricted exploitable capacity 17. Moreover, approximately 40% of boreholes in the region are classified as non-productive due to low yields, further intensifying pressure on existing supply infrastructure 17, 18. As a result, many residents in underserved neighborhoods depend on costly and sometimes unsafe alternative sources such as tanker deliveries or informal vendors. Although SONEB and development partners have examined NRW at national and regional scales 2, 19, 20, 21 these reports principally address aggregated trends and rely heavily on internal audits and secondary operational data, offering limited insight into city-level operational dynamics and consumer perspectives.
Best practices in NRW management advocate for mixed-methods assessments that combine standardized performance indicators, participatory engagement, and benchmarking against international frameworks 22, 23. Localized, context-specific data and governance strategies are essential to design effective interventions 15, and participatory, data-driven approaches that integrate digital monitoring and community engagement have been recommended to better capture the spatial and institutional dimensions of water loss 24, 25.
Against this background, Parakou provides a compelling case for targeted research on NRW. The present study was initiated to address this evidence gap by delivering a detailed, evidence-based analysis of NRW in Parakou. Employing a mixed-methods design that integrates operational performance indicators, stakeholder interviews, and household surveys, the study aims to: (i) examine the extent of NRW and assess its operational and financial impacts on SONEB and its customers; (ii) identify the principal drivers of losses; and (iii) propose practical, context-appropriate strategies to enhance the utility’s efficiency and long-term sustainability. Beyond its local relevance, the study intends to contribute to the broader empirical and policy discourse on NRW management in sub-Saharan Africa.
Research hypotheses and analytical framework
Based on the research gap and the conceptual understanding of non-revenue water as a multidimensional phenomenon affecting water utility performance, this study is guided by the following hypotheses:
H1: High levels of NRW are associated with reduced financial efficiency at SONEB Parakou;
H2: Institutional weaknesses contribute more significantly to high NRW levels than technical factors; and
H3: High levels of non-revenue water (NRW) are associated with negative customer perceptions of billing accuracy and service responsiveness.
These hypotheses are examined through a multidimensional analytical framework integrating technical, commercial, financial, institutional, and customer-oriented performance indicators.
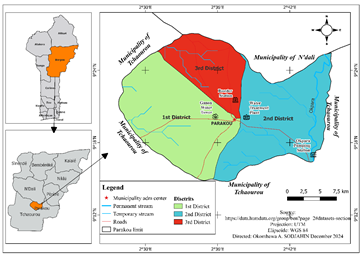
The present study was conducted in the commune of Parakou, which is geographically situated between latitudes 9°15′ and 9°27′ North and longitudes 2°30′ and 2°46′ East, approximately 435 km from the economic capital, Cotonou. Encompassing a total area of 441 km², the commune is administratively subdivided into three districts (Figure 1).
The climate is of Sudanian type and characterized by a distinct seasonal pattern: a rainy season from mid-April to mid-October and a dry season from mid-October to mid-April. Mean annual precipitation is approximately 1,200 mm, with peak rainfall occurring between July and September. Monthly temperatures fluctuate from 18°C during the coolest period (November to January) to 35°C during the hottest months (March and April) 26.
Parakou has undergone significant demographic and economic expansion in recent decades, establishing it as a major urban center in Benin 26. According to the fourth national population census (RGPH 4), the commune had a population of 255,478 inhabitants 27. Given an estimated annual growth rate of 4.9% 28, demographic projections indicate the population could exceed 700,000 by 2034. Economically, Parakou serves as the principal commercial and industrial hub for northern Benin, a status favored by its strategic position within national road and rail transport networks. The local economy is dominated by the tertiary sector, particularly commerce and transport; however, agriculture, livestock, and fishing continue to constitute the primary livelihood for approximately 30% of the active labor force 29. This rapid growth and economic profile generate substantial water demand for domestic, industrial, and commercial purposes.
In urban areas of Parakou, the provision of potable water is managed exclusively by SONEB. The public water supply system is primarily dependent on the Okpara Dam. This infrastructure draws raw water from the Okpara River, a perennial watercourse located 12 km east of the city, which represents the most critical hydrological resource for the urban supply system. As of March 2024, the piped distribution network extended 748.5 km, serving 27,500 subscriber connections and an estimated population of 330,000 residents 30.
In contrast, water supply in the rural portions of the commune falls under the purview of the Regional Hydraulics Department, relying primarily on boreholes and wells equipped with hand pumps.
This section outlines the methodological approaches used to assess NRW and its impacts at SONEB Parakou.
A mixed-methods research design was employed, integrating both primary and secondary data sources to ensure a comprehensive analysis.
Secondary data were obtained from official records and performance reports covering the period 2012 to 2024, sourced from SONEB in Parakou.
Primary data collection was conducted in two phases. First, structured interviews were held with a purposively selected sample of SONEB personnel, encompassing meter readers, maintenance agents, and management staff. These interviews were designed to gather qualitative insights into operational procedures, including meter reading and billing processes, the incidence and drivers of illegal connections, the primary causes of pipeline failures, and institutional dynamics such as staffing, budget allocation, and network sectorization.
Subsequently, a cross-sectional survey was administered to a random sample of households in Parakou to capture customer perspectives on service delivery. To enhance the reliability of respondent declarations, the questionnaire incorporated consistency checks through logically linked questions and triangulation with observable data where possible. Strict ethical protocols were followed, including obtaining informed verbal consent and guaranteeing full respondent anonymity. All responses were treated confidentially, with data aggregated for analysis to prevent identification of individuals or specific households.
The required sample size was calculated using Slovin’s formula 31 to derive a representative sample from the total population of connections (N), with a margin of error (e) set at 7%. The formula applied was:
 | (1) |
Given a total of 27,500 households and a 7% margin of error, this yielded a sample of 204 households. This total was distributed equally across the three districts of Parakou, resulting in 68 households per district. While proportional allocation based on the number of subscribers per district would have been methodically preferable, precise subscriber data per district were not available within the study's timeframe. Consequently, an equal allocation was implemented to ensure geographic representativeness across districts while accommodating the logistical and temporal constraints of the survey.
The questionnaire addressed key dimensions including the perceived reliability of water supply, billing accuracy, the efficacy of complaint-handling mechanisms, the utilization of alternative water sources, and the perceived impacts of NRW.
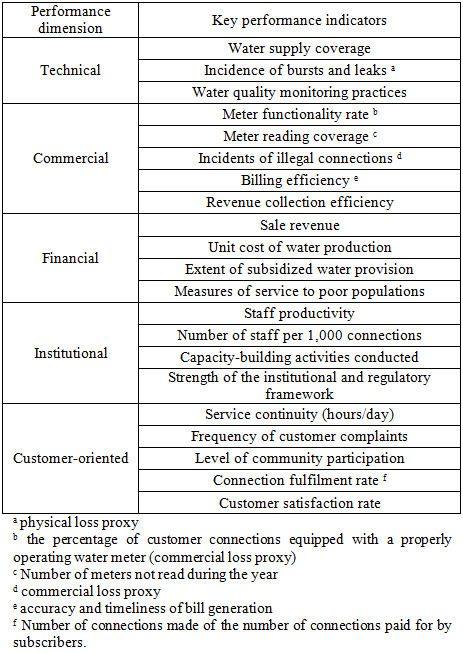
The evaluation of system performance was structured around a multidimensional framework encompassing technical, commercial, financial, institutional, and customer-oriented dimensions. A comprehensive set of key performance indicators was selected for each to enable a holistic assessment (Table 1). This framework facilitated a systematic analysis of operational efficiency, financial viability, organizational capacity, and service quality.
A central, cross-cutting metric for this study is the aggregate NRW level. Following the standardized water audit principles established by 10, NRW is defined as the difference between System Input Volume and Authorized Billed Consumption, further disaggregated into "Real Losses" (physical) and "Apparent Losses" (commercial). As the available data do not allow for a precise volumetric disaggregation, the drivers of NRW are examined through proxy indicators within their respective dimensions, aligning with the "component-based analysis" recommended by 10 for utilities with limited high-resolution data.
The incidence of bursts and leaks (technical dimension) is used as a proxy for physical losses, while meter functionality rate and incidents of illegal connections (commercial dimension) serve as proxies for commercial losses. As emphasized by 10, apparent losses due to metering inaccuracies often represent a significant portion of NRW in aging networks, justifying the use of meter functionality as a critical commercial proxy. This approach enables a diagnostic assessment of the main drivers and contributing factors of NRW within the Parakou system.
Quantitative data from surveys and secondary records were processed and analyzed using SPSS 27, Excel 365, and R-Studio 4.2.3. The analysis primarily employed descriptive statistics to characterize the state of the water utility system. Qualitative data from interviews were analyzed thematically to identify recurring patterns and insights.
To enhance the validity of the findings, data triangulation was employed by cross-validating results from official SONEB records with those from the household survey.
The evaluation of SONEB Parakou’s performance relied on a set of Key Performance Indicators (KPIs) selected for their relevance to the operational realities of developing countries. As noted by 7, while financial and operational indicators are used worldwide, their application in developing contexts often reveals significant management gaps, particularly in the consistent tracking of water loss.
Table 1 presents the performance indicators used in this assessment. These metrics align with the benchmarking methodologies reviewed by 7, ensuring that the analysis captures both the financial viability and the technical reliability of the water distribution system.
This section presents the key findings from the data collection and processing, structured according to a multidimensional performance framework.
3.1. Technical Performance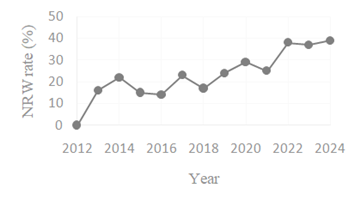
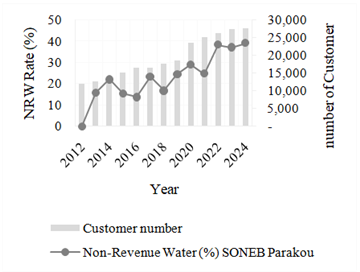
SONEB's technical performance reflects a utility with broad coverage but challenged by aging infrastructure. The utility achieves a high water supply coverage of 92% in Parakou and maintains full compliance with water quality standards. However, the system's physical integrity is a critical concern. Accounting for a total network length of 748.5 km, the mean annual incidence of 320 pipe failures between 2020 and 2024 represents a failure density of 0.43 breaks/km/year. This contributes significantly to physical losses, a major component of the high NRW rate, which kept increasing during the past two decades and reached 39% in 2024 (Figure 2).
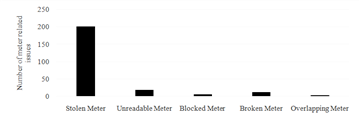
3.2. Commercial performanceCommercial operations, crucial for revenue protection, are severely inefficient. A central issue is the aggregate NRW level of 39%, driven partly by commercial losses. The effective meter functionality rate is undermined by issues of theft, damage, and being unreadable, with 200 cases of meter theft reported in 2024 (Figure 3).
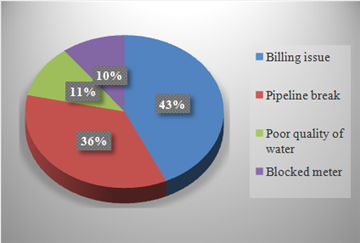
Furthermore, meter reading coverage is inadequate, with 9,056 meters going unread per year due to a team of 12 staff being responsible for over 27,500, approximately 33% of total registered connections. This poor data collection directly impacts billing efficiency, leading to estimated bills that customers report as inaccurate and the main matter of complaints from the customers (Figure 4).
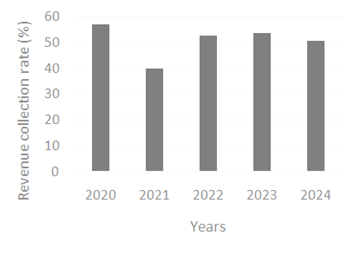
Incidents of illegal connections are prevalent, particularly in informal settlements and involving fire hydrants, though a lack of dedicated detection programs resulted in only four formal fraud cases in 2024. These commercial failures culminate in a critically low revenue collection efficiency of 50.7% in 2024, meaning nearly half of all billed revenue remains uncollected (Figure 5).
The financial viability of SONEB Parakou is severely constrained. Despite generating an annual sale revenue of 2.4 billion CFA francs in 2024, the chronically low collection efficiency creates a significant deficit. The unit cost of water production is unsustainable relative to the tariff structure, with the lowest consumption tier (0 to 5 m³) charged at 198 F CFA/m³ exclusive of value-added tax, the intermediate tier (6 to 50 m³) at 453 FCFA/m³ inclusive of value-added tax, and the higher volumes (>50 m³) at 658 FCFA/m³ inclusive of value-added tax, a situation exacerbated by customers who circumvent the increasing block tariff (IBT) by employing multiple meters. The extent of subsidized water provision and measures of service to poor populations are weak; the financial strain has directly curtailed network expansion in low-income areas, with only four standpipes installed in 2024.
3.4. Institutional PerformanceInstitutional capacity for effective NRW management is significantly weakened by several critical deficiencies. Human resources are a primary constraint: staff productivity is low, with each reader responsible for 2,292 meters, and the number of staff per 1,000 connections (2.4) is insufficient. Key positions, including the Head of Technical Services, remain vacant. Capacity-building activities conducted have been non-existent for the past two to four years, resulting in a limited conceptual understanding of NRW among staff, with only half of the network agents and a quarter of meter readers clearly understanding the concept of NRW. The strength of the institutional and regulatory framework is weak, evidenced by the lack of network sectorization, the absence of a dedicated team budget for NRW reduction, and a critical shortage of modern equipment for leak detection and meter replacement.
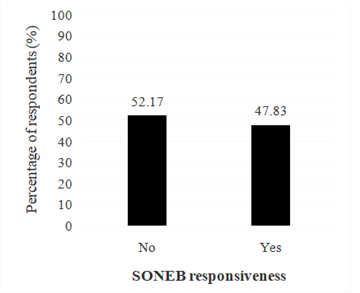
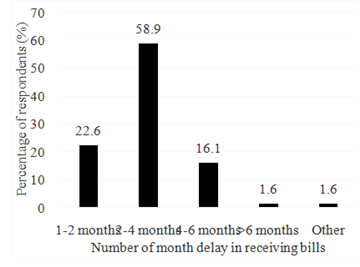
3.5. Customer-Oriented PerformanceCustomer perceptions reveal a service delivery paradox: reliable water quantity but poor responsiveness and billing. A strong majority of customers (over 94%) reported high service continuity. However, there is significant dissatisfaction with reactive services. The frequency of customer complaints is high, and less than half (47.8%) of subscribers believe SONEB responds satisfactorily (Figure 6), a fact supported by the low resolution rate of 41.6% for lodged complaints in 2024. A major service failure is the connection fulfilment rate, which stood at only 62% in 2024 (only 552 connections made out of 887 paid). Billing issues are rampant, with 68.1% of users considering their bills too high and 54.1% reporting delays of 2-4 months (Figure 7).
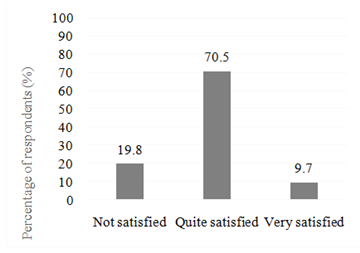
Consequently, while the survey indicated a generally high overall customer satisfaction rate of approximately 80%, this figure remains slightly lower than the 87% reported by SONEB itself (Figure 8).
The level of community participation is minimal, and public awareness of NRW is critically low, with 96.1% of customers unfamiliar with the term, indicating a failure in customer education and engagement.
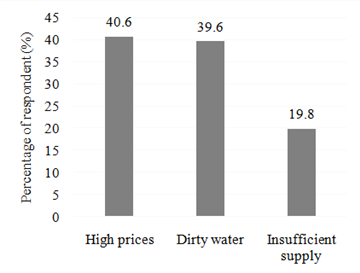
Customers primarily perceive the impacts of NRW as manifesting in high tariffs (40.6%), poor water quality (39.6%), and insufficient supply (19.8%), as detailed in Figure 9.
The primary causes of NRW, as identified through staff interviews and surveys, align with the performance gaps in the technical, commercial, and institutional dimensions.
Factors influencing physical losses: Staff identified aging infrastructure (cited by 75% of meter readers) and a batch of poor-quality pipes received in 2021 as major drivers. Operational challenges, including high water pressure (noted by 75% of staff) and poor installation, exacerbate the incidence of bursts and leaks, which maintenance agents encounter daily. Furthermore, the expanding customer base has not been matched by proportional growth in maintenance personnel. As illustrated in Figure 10, the simultaneous increase in the number of subscribers and the NRW rate suggests that network expansion has outpaced maintenance, metering, and institutional capacity. While not implying causality, this pattern supports the interpretation of NRW growth as a systemic capacity constraint rather than isolated technical failures.
Factors influencing commercial losses: These are driven by the widespread incidents of illegal connections and systemic issues with meter functionality rate and meter reading coverage as detailed in Section 3.2.
Institutional and other factors: The strength of the institutional and regulatory framework is undermined by the lack of network sectorization and modern equipment. External factors include damage from large-scale road construction projects, and soil erosion. The absence of a dedicated call center further hinders customer engagement in loss reduction.
The study confirms that the operational and financial performance of SONEB Parakou is critically hampered by a NRW rate between 31% and 40%, which aligns with the regional average for Sub-Saharan Africa and mirrors findings from utilities in Eritrea and Nigeria 2, 6, 9, 32. However, the 39% NRW rate recorded at SONEB Parakou in 2024 is significantly higher than the regional benchmarks for operational efficiency. For instance, the 12 report identified that while many utilities struggle, high-performing African operators manage to maintain NRW below 25%, suggesting that SONEB's current trajectory deviates from regional best-practice recovery trends. This high NRW level is not merely a technical metric but a symptom of systemic inefficiencies with direct multidimensional consequences.
Financially, the critically low revenue collection efficiency of 50.7% creates a debilitating cycle. The utility fails to collect nearly half of its billed revenue, severely constraining its capacity to reinvest in infrastructure renewal and proactive NRW reduction strategies. This financial vulnerability is a common challenge in the region, reflecting weak management practices that undermine sustainability 9.
From a customer-oriented perspective, the study reveals a significant service-quality paradox and a critical perception gap. While service continuity is reported as high, customer trust is eroded by poor reactive services. The discrepancy between the utility’s internal resolution metrics and the survey finding that only 41.6% of complaining customers had their issues resolved highlights a major accountability flaw. This is compounded by pervasive billing issues, including delays and high perceived costs, which 68.1% of respondents cited. Customer perceptions directly link NRW to high tariffs (40.6%) and poor water quality (39.6%), a finding consistent with 33, confirming that NRW directly undermines service affordability and perceived quality, even if basic supply is maintained.
4.2. Root Causes as a Convergence of Technical, Commercial, and Institutional FailuresIt is important to note that the relationships discussed in this section are based on proxy indicators rather than direct volumetric measurements. The observed associations should therefore be interpreted as indicative correlations that highlight structural weaknesses within the system, rather than strict causal relationships. The persistent gap between theoretical loss reduction and the operational reality at SONEB Parakou underscores the challenges highlighted by 14. In his study of African water utilities, 14 argues that traditional water loss tools often fail in developing countries due to unique constraints such as intermittent supply and poor data quality. His research advocates a 'toolbox' of context-specific methodologies including multi-criteria decision analysis to prioritize interventions where institutional capacity is limited, a situation directly observed in the current management of NRW in Parakou. Consequently, the drivers of NRW in Parakou are multifaceted and interdependent, aligning with the common challenges documented across African utilities 2, 15, 34.
The high incidence of bursts and leaks, exceeding 300 annually, is closely associated with aging infrastructure, pressure fluctuations, and the use of poor-quality pipes. These factors are concurrent with significant physical losses. The situation is further linked to the lack of network sectorization (District Metered Areas - DMAs) and modern leak detection equipment, forcing a purely reactive maintenance approach. As highlighted by 4, achieving a 'low-loss' status requires a holistic planning approach where digital monitoring and District Metered Areas (DMAs) are not just technical additions but core strategic investments. In the absence of these strategic frameworks, the high prevalence of non-visible sub-surface leaks, estimated at 90%, suggests that passive maintenance strategies are fundamentally limited in their capacity to facilitate substantive reductions in water loss 24, 35.
Commercial losses are substantial and are characterized by incidents of illegal connections (e.g., unmetered fire hydrant use, theft in informal settlements) and a low effective meter functionality rate due to theft, damage, and inaccuracies. The poor meter reading coverage, with over 9,000 meters unread annually, and the subsequent practice of estimating bills correlates with revenue shortfalls and customer billing complaints, suggesting a cycle of nonpayment and financial loss.
The current institutional framework faces significant challenges that correlate with limited effectiveness in driving improvements. Areas requiring attention include the dissolution of the dedicated NRW management unit in 2021, leading to diluted responsibility and loss of expertise, a recognized obstacle to progress. Such institutional challenges align with the diagnostic criteria established by 13, which emphasizes that sustainable NRW reduction in African utilities is concomitant with robust “institutional anchoring”, the integration of loss management into core performance mandates.
Furthermore, the utility’s situation is characterized by limited investment in capacity-building, which has contributed to gaps in technical understanding of NRW among staff and vacant key positions. The absence of a specific budget and strategy for NRW reduction, alongside a critical shortage of tools, reflects an institutional and regulatory framework that would benefit from further strengthening, a factor associated with high NRW in similar contexts 36.
4.3. A Proposed Integrated Strategy for NRW ReductionTo address these interconnected challenges, SONEB Parakou requires a structured, phased strategy that moves from immediate actions to a sustainable management model. The following integrated approach is proposed.
Re-establish and empower a dedicated NRW management unit: As a cornerstone institutional reform, a specialized unit with a clear mandate, budget, and authority must be created to coordinate all loss reduction activities. This aligns with recommendations by 23 and is essential for fostering interdepartmental synergy and maintaining focus, reversing the current fragmented responsibility.
Launch a comprehensive capacity building program: Immediate and regular training for technical staff on proactive leak detection, pressure management, and meter maintenance is crucial. Building internal expertise, as demonstrated successfully in Cambodia 37, is a prerequisite for effective and sustained NRW control.
Implement a public awareness and customer engagement campaign: Educating customers on the impacts of NRW and empowering them to report leaks and fraud transforms them from passive recipients into active allies in loss reduction. This strategy proved effective in Phnom Penh 38 and is vital in Parakou, where 96.1% of customers are unfamiliar with the term "NRW."
Adopt digital tools for proactive management: The integration of Geographic Information Systems (GIS) for network mapping and the phased installation of smart meters are critical long-term investments. Smart meters can reduce unmetered consumption by 15-30% through accurate billing 39, while GIS enables systematic planning for sectorization and leak detection.
Overhaul billing and revenue protection systems: Improvements must include automating billing processes, strictly enforcing penalties for illegal consumption, and establishing a free, 24/7 customer call center for incident reporting. To improve revenue collection efficiency, the study recommends adopting the phased approach suggested by 13. This strategy includes the systematic rotation of meter readers to prevent collusion and the implementation of household-to-household surveys to update the customer database and detect illegal connections. Furthermore, metering all extraction points, including fire hydrants, provides vital data for water balance calculations 40.
Explore strategic Public-Private Partnerships (PPPs): For specific, resource-intensive tasks, SONEB could partner with private firms. Successful models, such as the Basic Sanitation Company of the State of São Paulo (SABESP) in Brazil, have used contractors for network leak surveys and targeted debt collection, paying them based on results like kilometers surveyed or percentage of debt recovered 36. This can amplify the utility’s reach and effectiveness.
By adopting the proposed strategy, SONEB Parakou can systematically address the technical, commercial, and institutional roots of its high NRW. This path offers a scalable framework to transition from a reactive utility to a proactive, efficient, and financially sustainable service provider, ultimately enhancing water security for the city.
This study evaluated the impact of NRW on the operational performance of SONEB in Parakou and explored pathways for its sustainable management. The analysis reveals a critical NRW rate of 39% in 2024, posing a substantial threat to the utility's financial sustainability and operational efficiency. While water delivery remains high, with 94% of surveyed households reporting consistent supply, customer trust and satisfaction are significantly eroded by systemic billing inaccuracies, high perceived costs (68.1%), and delayed bill delivery (54.1%). These service shortfalls are exacerbated by a severely low revenue collection efficiency, averaging just 50.7% between 2020 and 2024, which intensifies financial losses and constrains reinvestment capacity.
The identified drivers of NRW are multifaceted and interrelated. Physical losses stem primarily from aging infrastructure, frequent pipe breaks, pressure fluctuations, and damage from external activities such as road construction. Commercial losses are driven by illegal connections, water theft, and unmetered consumption, including from fire hydrants. Institutionally, the absence of a dedicated NRW management unit, lack of network sectorization, limited proactive maintenance, and insufficient technological investment hinder effective loss control.
Strategic interventions are required to reverse this trend. An integrated NRW reduction model should be adopted, prioritizing the establishment of a specialized NRW management department, the implementation of District Metered Areas (DMAs), and the deployment of modern leak detection technologies. Furthermore, enhancing billing systems through smart metering, strengthening institutional capacity via training and clear accountability frameworks, and fostering customer engagement through awareness campaigns and responsive reporting channels are essential. These measures, supported by policy reforms and stricter enforcement against fraud, would enable a transition from reactive to proactive utility management.
While the analysis identifies strong associations between NRW and multiple dimensions of operational performance, these relationships should not be interpreted as strict causal links. The study relies on descriptive indicators and proxy variables to diagnose operational weaknesses, and the observed correlations are therefore understood as mutually reinforcing dynamics that highlight priority areas for intervention rather than direct cause-effect relationships.
This research provides SONEB with evidence-based recommendations to improve operational and financial viability while contributing transferable insights for utilities across Sub-Saharan Africa facing similar NRW challenges. Future studies should investigate the cost-benefit analysis and long-term efficacy of the proposed interventions.
This research was funded by the African Union Member States through a scholarship grant, with support from the German Government, and administered by the Pan African University Institute for Water and Energy Sciences (PAUWES) under Grant Number PAUWES/2023/MWP09. We gratefully thank the National Water Company of Benin SONEB for facilitating data collection.
| [1] | Wyatt S. A., Non-revenue water: Financial model for optimal management in developing countries., RTI Press., vol. 12, no. 4. 2010. | ||
| In article | View Article | ||
| [2] | USAID & AfWA, “Africa Non-Revenue Water Program Synthesis Report,” USAID / African Water Association (AfWA), 2015. | ||
| In article | |||
| [3] | Perera B. A. K. S., Mallawaarachchi H., Jayasanka K. S., and Rathnayake R. R. P. N., “A Water Management System for Reducing Non-Revenue Water in Potable Water Lines: The Case of Sri Lanka,” Eng. J. Inst. Eng. Sri Lanka, vol. 51, no. 2, p. 53, 2018. | ||
| In article | View Article | ||
| [4] | IWA (International Water Association) and State of Green, “Reducing Urban Water Losses: How water utilities can improve efficiency and meet future demand for water [White Paper],” State of Green, Copenhague, Danemark, Version 3.0, 2021. | ||
| In article | |||
| [5] | van den Berg C., “Drivers of non-revenue water: A cross-national analysis,” Util. Policy, vol. 36, pp. 71–78, 2015. | ||
| In article | View Article | ||
| [6] | Liemberger R. and Wyatt A., “Quantifying the global non-revenue water problem,” Water Sci. Technol. Water Supply, vol. 19, no. 3, pp. 831–837, 2018. | ||
| In article | View Article | ||
| [7] | Makaya E. and Hensel O., “Water Distribution Systems Efficiency Assessment Indicators–Concepts and Application,” Int. J. Sci. Res., vol. 3, no. 7, pp. 219–228, 2014. | ||
| In article | |||
| [8] | Mubvaruri F., Hoko Z., Mhizha A., and Gumindoga W., “Investigating trends and components of non-revenue water for Glendale, Zimbabwe,” Phys. Chem. Earth, Parts A/B/C, vol. 126, p. 103145, Jun. 2022. | ||
| In article | View Article | ||
| [9] | Abdu Nasara, M., Zubairu, I., Jagaba, A. H., Hussaini Jagaba, A., Ahmed Azare, A., Musa Yerima, Y., & Yerima, B., “Assessment of Non-Revenue Water Management Practices in Nigeria (A Case Study of Bauchi State Water and Sewerage Cooperation),” Am. J. Eng. Res., no. 10, pp. 390–401, 2021. | ||
| In article | |||
| [10] | Thornton J., Sturm R., and Kunkel G., Water Loss Control, 2nd ed. New York: The McGraw-Hill Companies, Inc, 2008. | ||
| In article | |||
| [11] | MEM, “Document de Programmation Pluriannelle des Dépenses,” Ministère de l’Eau et des Mines, Cotonou, Bénin, 2020. | ||
| In article | |||
| [12] | WSP-Africa, “Water Operators Partnerships-Africa Utility Performance Assessment Washington, DC: World Bank.,” Nairobi, Kenya, 2009. | ||
| In article | |||
| [13] | USAID & World Bank Institute, “Manuel Du Manager Sur L’Eau Non Comptabilsée En Afrique Handbook for Africa,” 2010. | ||
| In article | |||
| [14] | Mutikanga H.E. 2012. Water loss management strategies: Tools and Methods for developing Countries. Dissertation (PhD), Delft University of Technology, The Netherlands. | ||
| In article | |||
| [15] | Mvongo D. V., Defo C., and Tchoffo M., “Quantifying the non-revenue water problem in a sub-Saharan African environment: a practical application in the Republic of Cameroon (Central Africa) Quantifying the nonrevenue water problem in a sub-Saharan African environment: a practical application in,” Res. Sq., no. February, 2024. | ||
| In article | View Article PubMed | ||
| [16] | Appiah K. and Du J., “Non-Revenue Water Management in Ghana : The Opportunities and Challenges,” J. Environ. Earth Sci., vol. 7, no. 10, pp. 59–67, 2017. | ||
| In article | |||
| [17] | Hountondji N. L. and Nouatin G. S., “Perception de la qualité des services d’eau potable dans les localités périphériques de la commune de Parakou,” Inetrnational J. Humanit. Soc. Sci., no. Uirtus 2.1.(avril), pp. 133–152, 2022. | ||
| In article | View Article | ||
| [18] | Habirou A. A., “Apport de la télédétection et de l’analyse multicritère dans la détermination des zones à forte potentialité en eau souterraine dans le socle : cas des communes de Parakou et de Tchaourou,” Université d’Abomey-Calavi, 2023. | ||
| In article | |||
| [19] | AfDB, “Water loss reduction and performance improvement of drinking water supply systems in Cotonou, Porto-Novo and their suburbs,” 2015. | ||
| In article | |||
| [20] | AfDB, “Rapport sur l’état d’exécution et sur les résultats (EER): réduction de perte d’eau SONEB,” Cotonou, Bénin, 2024. | ||
| In article | |||
| [21] | SONEB, “Rapport d’activités de la Société Nationale de l’Eau du Bénin 2015,” Société Nationale des Eaux du Bénin, Cotonou, Bénin, 2016. | ||
| In article | |||
| [22] | van den Berg C. and Alexander D., “Performance of Water Utilities in Africa,” ResearchGate, Washington, DC, 2014. | ||
| In article | |||
| [23] | IWA (International Water Association) and State of Green, “Reducing urban water losses: How water utilities can improve efficiency and meet future demand for water,” State of Green, Copenhague, Danemark, Version 3.1, 2022. | ||
| In article | |||
| [24] | Mutikanga H. E., Sharma S., and Vairavamoorthy K., “Water loss management in developing countries: Challenges and prospects,” J. / Am. Water Work. Assoc., vol. 101, no. 12, pp. 57–68, Dec. 2009. | ||
| In article | View Article | ||
| [25] | Makaya E., “Water loss management for developing countries: Understanding the dynamics of water leakages,” University of Kassel, 2015. | ||
| In article | |||
| [26] | Mairie de Parakou, “Plan de Développement Communal 2019- 2023 Version définitive après adoption,” Parakou, Benin, 2018. | ||
| In article | |||
| [27] | INSAE, “Rgph4 : Que Retenir Des Effectifs De Population En 2013 ?,” Cotonou, Bénin, 2013. | ||
| In article | |||
| [28] | INSAE, “Cahier des villages et quartiers de ville du département du Littoral (RGPH-4, 2013),” 2016. | ||
| In article | |||
| [29] | BOPEN, “Projet de construction du collecteur ″G″ et d’ouvrages complémentaires dans le bassin ″B″ dans la ville de Parakou,” Parakou, Benin, 2008. | ||
| In article | |||
| [30] | DDBA SONEB, “Données statistiques Direction Départementale Borgou Alibori 2024,” Unpublished Data - Direct Communication, Parakou, Benin, 2024. | ||
| In article | |||
| [31] | Adam A. M., “Sample Size Determination in Survey Research,” J. Sci. Res. Reports, no. June, pp. 90–97, 2020. | ||
| In article | View Article | ||
| [32] | Zeraebruk K. N., Mayabi A. O., Gathenya J. M., and Tsige Z., “Assessment of Water Supply Services and Operational Performance of Asmara Water Supply Department (AWSD ) for Development of Decision Support Tools,” Environ. Nat. Resour. Res., no. January 2016, 2014. | ||
| In article | View Article | ||
| [33] | Ndegwa, L. M., “the Impact of Non-Revenue Water on Water Utilities and Their Customers,” University of Nairobi, 2016. | ||
| In article | |||
| [34] | Farley M., Wyeth G., Ghazali Z. B. M., Istandar A., and Singh S., The Manager ’ s Non-Revenue Water Handbook: A Guide to Understanding Water Losses. Washington DC.: USAID, 2008. | ||
| In article | |||
| [35] | Frauendorfer R. and Liemberger R., “The Issues and Challenges of Reducing Non-Revenue Water,” Asian Development Bank, Mandaluyong City, Philippine, 2010. | ||
| In article | |||
| [36] | Kingdom B., Liemberger R., and Marin P., “The challenge of reducing non-revenue water (NRW) in developing countries - How the private sector can help: A look at performance-based service contracting.,” The World Bank Group / PPIAF (Public-Private Infrastructure Advisory Facility), Washington, D.C., 2006. | ||
| In article | View Article | ||
| [37] | Sewilam H., Capacity Development for Drinking Water Loss Reduction: Challenges and Experiences, no. June. München (Munich): August Dreesbach Verlag, 2011. | ||
| In article | |||
| [38] | Lai C. H., Chan N. W., and Roy R., “Understanding public perception of and participation in non-revenue water management in Malaysia to support urban water policy,” MDPI, vol. 9, no. 1, 2017. | ||
| In article | View Article | ||
| [39] | Ornaghi C. and Tonin M., “The effects of the universal metering programme on water consumption, welfare and equity,” Oxf. Econ. Pap., vol. 73, no. 1, pp. 399–422, 2021. | ||
| In article | View Article | ||
| [40] | Faber S. and Radakrishnan M., “Roadmap to Non-Revenue Water Reduction / Management,” GWOPA/UN-Habitat and IHE Delft Institute for Water Education, 2020. | ||
| In article | |||
Published with license by Science and Education Publishing, Copyright © 2026 Djigbo Félicien BADOU, Okombawa Adolphe SODJAHIN and Agnidé Emmanuel Lawin
![]() This work is licensed under a Creative Commons Attribution 4.0 International License. To view a copy of this license, visit
http://creativecommons.org/licenses/by/4.0/
This work is licensed under a Creative Commons Attribution 4.0 International License. To view a copy of this license, visit
http://creativecommons.org/licenses/by/4.0/
| [1] | Wyatt S. A., Non-revenue water: Financial model for optimal management in developing countries., RTI Press., vol. 12, no. 4. 2010. | ||
| In article | View Article | ||
| [2] | USAID & AfWA, “Africa Non-Revenue Water Program Synthesis Report,” USAID / African Water Association (AfWA), 2015. | ||
| In article | |||
| [3] | Perera B. A. K. S., Mallawaarachchi H., Jayasanka K. S., and Rathnayake R. R. P. N., “A Water Management System for Reducing Non-Revenue Water in Potable Water Lines: The Case of Sri Lanka,” Eng. J. Inst. Eng. Sri Lanka, vol. 51, no. 2, p. 53, 2018. | ||
| In article | View Article | ||
| [4] | IWA (International Water Association) and State of Green, “Reducing Urban Water Losses: How water utilities can improve efficiency and meet future demand for water [White Paper],” State of Green, Copenhague, Danemark, Version 3.0, 2021. | ||
| In article | |||
| [5] | van den Berg C., “Drivers of non-revenue water: A cross-national analysis,” Util. Policy, vol. 36, pp. 71–78, 2015. | ||
| In article | View Article | ||
| [6] | Liemberger R. and Wyatt A., “Quantifying the global non-revenue water problem,” Water Sci. Technol. Water Supply, vol. 19, no. 3, pp. 831–837, 2018. | ||
| In article | View Article | ||
| [7] | Makaya E. and Hensel O., “Water Distribution Systems Efficiency Assessment Indicators–Concepts and Application,” Int. J. Sci. Res., vol. 3, no. 7, pp. 219–228, 2014. | ||
| In article | |||
| [8] | Mubvaruri F., Hoko Z., Mhizha A., and Gumindoga W., “Investigating trends and components of non-revenue water for Glendale, Zimbabwe,” Phys. Chem. Earth, Parts A/B/C, vol. 126, p. 103145, Jun. 2022. | ||
| In article | View Article | ||
| [9] | Abdu Nasara, M., Zubairu, I., Jagaba, A. H., Hussaini Jagaba, A., Ahmed Azare, A., Musa Yerima, Y., & Yerima, B., “Assessment of Non-Revenue Water Management Practices in Nigeria (A Case Study of Bauchi State Water and Sewerage Cooperation),” Am. J. Eng. Res., no. 10, pp. 390–401, 2021. | ||
| In article | |||
| [10] | Thornton J., Sturm R., and Kunkel G., Water Loss Control, 2nd ed. New York: The McGraw-Hill Companies, Inc, 2008. | ||
| In article | |||
| [11] | MEM, “Document de Programmation Pluriannelle des Dépenses,” Ministère de l’Eau et des Mines, Cotonou, Bénin, 2020. | ||
| In article | |||
| [12] | WSP-Africa, “Water Operators Partnerships-Africa Utility Performance Assessment Washington, DC: World Bank.,” Nairobi, Kenya, 2009. | ||
| In article | |||
| [13] | USAID & World Bank Institute, “Manuel Du Manager Sur L’Eau Non Comptabilsée En Afrique Handbook for Africa,” 2010. | ||
| In article | |||
| [14] | Mutikanga H.E. 2012. Water loss management strategies: Tools and Methods for developing Countries. Dissertation (PhD), Delft University of Technology, The Netherlands. | ||
| In article | |||
| [15] | Mvongo D. V., Defo C., and Tchoffo M., “Quantifying the non-revenue water problem in a sub-Saharan African environment: a practical application in the Republic of Cameroon (Central Africa) Quantifying the nonrevenue water problem in a sub-Saharan African environment: a practical application in,” Res. Sq., no. February, 2024. | ||
| In article | View Article PubMed | ||
| [16] | Appiah K. and Du J., “Non-Revenue Water Management in Ghana : The Opportunities and Challenges,” J. Environ. Earth Sci., vol. 7, no. 10, pp. 59–67, 2017. | ||
| In article | |||
| [17] | Hountondji N. L. and Nouatin G. S., “Perception de la qualité des services d’eau potable dans les localités périphériques de la commune de Parakou,” Inetrnational J. Humanit. Soc. Sci., no. Uirtus 2.1.(avril), pp. 133–152, 2022. | ||
| In article | View Article | ||
| [18] | Habirou A. A., “Apport de la télédétection et de l’analyse multicritère dans la détermination des zones à forte potentialité en eau souterraine dans le socle : cas des communes de Parakou et de Tchaourou,” Université d’Abomey-Calavi, 2023. | ||
| In article | |||
| [19] | AfDB, “Water loss reduction and performance improvement of drinking water supply systems in Cotonou, Porto-Novo and their suburbs,” 2015. | ||
| In article | |||
| [20] | AfDB, “Rapport sur l’état d’exécution et sur les résultats (EER): réduction de perte d’eau SONEB,” Cotonou, Bénin, 2024. | ||
| In article | |||
| [21] | SONEB, “Rapport d’activités de la Société Nationale de l’Eau du Bénin 2015,” Société Nationale des Eaux du Bénin, Cotonou, Bénin, 2016. | ||
| In article | |||
| [22] | van den Berg C. and Alexander D., “Performance of Water Utilities in Africa,” ResearchGate, Washington, DC, 2014. | ||
| In article | |||
| [23] | IWA (International Water Association) and State of Green, “Reducing urban water losses: How water utilities can improve efficiency and meet future demand for water,” State of Green, Copenhague, Danemark, Version 3.1, 2022. | ||
| In article | |||
| [24] | Mutikanga H. E., Sharma S., and Vairavamoorthy K., “Water loss management in developing countries: Challenges and prospects,” J. / Am. Water Work. Assoc., vol. 101, no. 12, pp. 57–68, Dec. 2009. | ||
| In article | View Article | ||
| [25] | Makaya E., “Water loss management for developing countries: Understanding the dynamics of water leakages,” University of Kassel, 2015. | ||
| In article | |||
| [26] | Mairie de Parakou, “Plan de Développement Communal 2019- 2023 Version définitive après adoption,” Parakou, Benin, 2018. | ||
| In article | |||
| [27] | INSAE, “Rgph4 : Que Retenir Des Effectifs De Population En 2013 ?,” Cotonou, Bénin, 2013. | ||
| In article | |||
| [28] | INSAE, “Cahier des villages et quartiers de ville du département du Littoral (RGPH-4, 2013),” 2016. | ||
| In article | |||
| [29] | BOPEN, “Projet de construction du collecteur ″G″ et d’ouvrages complémentaires dans le bassin ″B″ dans la ville de Parakou,” Parakou, Benin, 2008. | ||
| In article | |||
| [30] | DDBA SONEB, “Données statistiques Direction Départementale Borgou Alibori 2024,” Unpublished Data - Direct Communication, Parakou, Benin, 2024. | ||
| In article | |||
| [31] | Adam A. M., “Sample Size Determination in Survey Research,” J. Sci. Res. Reports, no. June, pp. 90–97, 2020. | ||
| In article | View Article | ||
| [32] | Zeraebruk K. N., Mayabi A. O., Gathenya J. M., and Tsige Z., “Assessment of Water Supply Services and Operational Performance of Asmara Water Supply Department (AWSD ) for Development of Decision Support Tools,” Environ. Nat. Resour. Res., no. January 2016, 2014. | ||
| In article | View Article | ||
| [33] | Ndegwa, L. M., “the Impact of Non-Revenue Water on Water Utilities and Their Customers,” University of Nairobi, 2016. | ||
| In article | |||
| [34] | Farley M., Wyeth G., Ghazali Z. B. M., Istandar A., and Singh S., The Manager ’ s Non-Revenue Water Handbook: A Guide to Understanding Water Losses. Washington DC.: USAID, 2008. | ||
| In article | |||
| [35] | Frauendorfer R. and Liemberger R., “The Issues and Challenges of Reducing Non-Revenue Water,” Asian Development Bank, Mandaluyong City, Philippine, 2010. | ||
| In article | |||
| [36] | Kingdom B., Liemberger R., and Marin P., “The challenge of reducing non-revenue water (NRW) in developing countries - How the private sector can help: A look at performance-based service contracting.,” The World Bank Group / PPIAF (Public-Private Infrastructure Advisory Facility), Washington, D.C., 2006. | ||
| In article | View Article | ||
| [37] | Sewilam H., Capacity Development for Drinking Water Loss Reduction: Challenges and Experiences, no. June. München (Munich): August Dreesbach Verlag, 2011. | ||
| In article | |||
| [38] | Lai C. H., Chan N. W., and Roy R., “Understanding public perception of and participation in non-revenue water management in Malaysia to support urban water policy,” MDPI, vol. 9, no. 1, 2017. | ||
| In article | View Article | ||
| [39] | Ornaghi C. and Tonin M., “The effects of the universal metering programme on water consumption, welfare and equity,” Oxf. Econ. Pap., vol. 73, no. 1, pp. 399–422, 2021. | ||
| In article | View Article | ||
| [40] | Faber S. and Radakrishnan M., “Roadmap to Non-Revenue Water Reduction / Management,” GWOPA/UN-Habitat and IHE Delft Institute for Water Education, 2020. | ||
| In article | |||


