In southwest coastal Bangladesh, surface water is a crucial basis both for domestic and irrigation purposes. This study investigated the water quality of the Jhapjhapia River, Khulna, Bangladesh using the Water Quality Index (WQI). For many purposes like agriculture, fish farming, and household and industrial activities, surrounding people depend on these water sources. Hence, this study examined the physico-chemical attributes and Weighted Arithmetic Water Quality Index (WAWQI) of three (03) different stations, collected during the monsoon and winter seasons. Among the investigated parameters, ten (10) crucial parameters were considered for the evaluation of water quality. Throughout the research period, the pH value ranges from 7.65 to 7.79. From Station-1 to Station-3, the concentration of EC, TDS, and DO was steadily reduced (Station-1>Station-2>Station-3). The analytical results found that the water transparency ranged from 5 to 10 cm while BOD ranged from 1.85 to 2.71 mg/l and 1.79 to 2.75 mg/l in the monsoon and winter seasons respectively. The levels of total hardness varied from 95 mg/l to 160 mg/l and 130 mg/l to 225 mg/l whereas total alkalinity ranged from 108 to 140 mg/l throughout the monsoon and winter season. Similarly, Ca2+ value ranged from 24.71 to 28.05 mg/l and 34.74 mg/l to 42.01 mg/l and Mg2+ ranged from 10.93 to 6.07 mg/l and from 5.93 mg/l to 8.56 mg/l correspondingly. The overall WQI value is found between 51 to 75, demonstrating the status of water quality is poor (Grade-C), unhealthy for drinking without proper treatment though can be used for irrigation and industrial purposes till now. Therefore, this study seeks appropriate strategic initiatives and conservation measures with proper monitoring to stop the deterioration of the water quality for sustaining the health and livelihood of many people who depend on it.
To maintain the ecological balance and survive human, animal and plant life water is envisaged as a major and valuable natural resource. The true fact is that without food human may survive for a period of time but it is implausible to survive without water 1. Not even for only drinking purposes, water is a significant part of other sectors like livestock rearing, forest and homestead vegetation, commercial activities, fisheries and agricultural productions 2, 3. Though water is a basic need for sustaining the lives on the ecosystem but the major sources of the river remain untreated due to a lack of proper management and continuous monitoring approaches 4, 5. Among these, rivers are the largest source of surface water; a vital source for maintaining groundwater levels, and have a noteworthy effect on the surrounding livelihood 6. In recent times, natural water resources predominantly river water have deteriorated for the growing demand of the increasing population, land use pattern and diversification including industrialization and urbanization 7, 8. Moreover, different anthropogenic interruptions to the environmental processes such as weathering, chemical changes, soil and river bank erosion with frequent calamities like flood, cyclone, storm surges, salinization etc. are also accountable for the worsening of the quantity and quality water 9, 10, 11. In addition, rivers act as a central reservoir where the effluent dumped from various sources like agricultural runoff point, and industrial and municipal waste stations 2, 11. Water quality monitoring and management has become more difficult due to the contamination from non-point sources mostly from municipal wastewater flow, pesticides and surface runoff to the nearby river 12. Hence, there has been a tremendous demand for fresh water in the last few decades 13. For any specific regions, physico-chemical and biophysical attributes represent the characterization of water sources, and when the values of these parameters are beyond the allowable limit, become injurious to human health 14, 15, 16. Besides, the Water quality index (WQI) insights overall water status under different categories as an indicator of water contamination and uses suitability 17 though it is very hard to address the suitability of water for the common people and local inhabitants 18, 19. Equally, for a specific geographical region, WQI helps to distinguish the appropriateness of different water sources by giving a valuable impression to the water users in terms of to what extent it is suitable for domestic and irrigation purposes 20, 21. Among the five major methods of water quality indexing and evaluation, weighted arithmetic water quality index (WAWQI) is considered for this study to explore the quality of water as this method incorporates numerous physico-chemical attributes into an integrated mathematical equation and finally reveals the overall quality of different water body by a single converted value 22.
The Jhapjhapia is a distributary of Pasur River under Khulna division of Bangladesh situated neighboring to the localities of Kasiadanga and Buna. The Jhapjhapia River flows downstream to the Kajibacha River’s terminus. The Jhapjhapia River is a significant source of homegrown fish production and capturing chiefly for shrimp farming to the adjacent land surface. The major flow into the existing canals from this river meets the need of the local community for irrigation purposes especially in ground water constrained areas. In case of river water quality assessment of Bangladesh, several studies have been carried out in the Halda and Karnafully River, ponds and tributaries of Boalia khal, and so on 17, 20, 21, 22, 23. For exploring the hydro-chemical attributes and water quality evaluation especially focusing on WQI, no study on Jhapjhapia River has been conducted yet. Therefore, this study would be a very imperative and realistic attempt to reveal the detailed physico-chemical evidence regarding user perspectives and the urgency of management approaches for protecting the Jhapjhapia River from different types of pollution and contamination.
Jhapjhapia River is a distributary located in Khulna that separates Batiaghata and Dacope upazila into two distinct land masses areas. It is geographically located between North latitudes of 22°36'0" and East longitude of 89°31'60". The length is almost 18 km long with width of 37 m and depth is 7.5m (Field visit, 2022) and its number of population around 112,200. Earlier Jhapjhapia River was familiar as old Pasur River as it flows downstream throughout the whole Pasur River (Figure 1). It has mixed three mouths of the river like Kajibacha River and flows downstream to the Pasur River 24.
During summer, the river basin’s climate is hot and humid as well as pleasantly warm during winter. The city has an annual average temperature of 26.3°C with monthly averages ranging from 11.4°C on January mornings to 34.6°C during April. The highest temperature is recorded in April during summer with a maximum of 40°C while the lowest temperature is observed in January with a minimum of 2°C during winter. In addition, during the monsoon the maximal precipitation (1000 to 1220 mm) is observed in July to August and least precipitation (0 - 10 mm) is found in December to January during winter season 25. For the formation of the study area, Ganges deltaic deposits are mainly responsible. Mangrove swamp deposits and deposits of deltaic silt as well as tidal deltaic deposits perceive the surface lithology 26. In this area, the litho-stratigraphic units are composed of diverse proportions of silt, sand, and clay with a smaller amount of coarse sand 27.

To demonstrate the entire quality of the water of Jhapjhapia River, a total of three (03) sampling stations were selected namely, Station-1 (Pankhali Ferry Ghat), Station-2 (Office Ghat), and Station-3 (Bara Bhuiya Ghat). Station-1 is located between 22°37'39" N and 89°31'6" E whereas the depth is around 11m at the time of high tide (HT) and 9m throughout low tide (LT). This station falls in between two major rivers like Kajibacha River and the Pasur River. Station-2 (Office Ghat) is located between 22°37'58" N and 89°30'39" E with a depth of around 8m during HT and 7m during LT. In station -2, the bottom is full of suspended sediment. On the other hand, Station-3 (Bara Bhuiya Ghat) is located between 22°38'14" N and 89°30'5" E and here depth is around 6m during HT and 5.1m during LT as well as bottom is filled with sediment and muddy in this station.
2.2. Sample Collection and Analysis ProcedureTo conduct this study a total number of three (03) sampling stations were selected to represent the whole of Jhapjhapia River. During the monsoon and winter seasons in 2022, nine (09) water samples were collected from these three stations consecutively. Further, from each sampling station, three (03) water samples were taken. 500ml plastic bottles were used to collect water samples. Before sampling, the bottles used for sampling were carefully purified with distilled water and then dried at room temperature. Bottles were washed with the sampled water at the time of sampling as well as labeled the sampling bottles properly. Samples were carefully collected at the best possible time given the ambient conditions. During the sampling time in the monsoon season, no rainwater was precipitated so the sample water was free from rainwater. Selected parameters including surface water temperature, DO were measured in the field immediately after collecting the samples using Digital Thermometer with probe and DO meter with probe respectively and taking reading of coordination through GPS at every sampling station. The water samples were transferred instantly to the laboratory from the field for different types of analysis.
Hydrogen ion concentration (pH), total dissolved solid (TDS), electrical conductivity (EC), transparency, dissolved oxygen (DO), total hardness (TH), biological oxygen demand (BOD), total alkalinity (TA), Calcium (Ca2+), Magnesium (Mg2+), Phosphate (PO43-), Sulphate (SO42-) Nitrate (NO32-) were analyzed in this study. pH was measured using pH meter (HI2211pH/ORP Meter), by using a conductivity meter (HQ40d) EC was determined. Besides, BOD was determined by using Thermo Scientific ORION 087003. TDS was determined by using Multimeter (HQ 40D) and total hardness, Calcium, and Magnesium were measured using titrimetric method. Phosphate (PO43-), Nitrate (NO32-) and Sulphate (SO42-) were measured using the Turbidimetric method, Ascorbic Acid Method (UV-Spectronic Method) (UV-1280SHIMADZU) accordingly. In order to conduct an accurate study of all of the selected parameters, APHA's Standard Methods have been followed for the Examination of Water and Wastewater 28. The analysis was done at Soil, Water and Air Research Laboratory of Environmental Science Discipline in Khulna University, Khulna, Bangladesh where samples were examined using the proper resources and conditions.
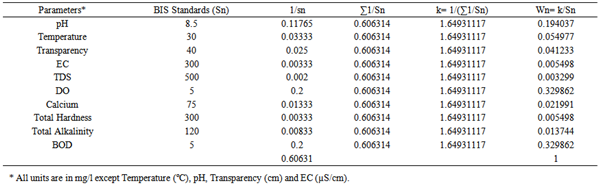
2.3. Weighted Arithmetic Water Quality Index (WQI) CalculationIn this study, The Weighted Arithmetic Water Quality Index method was used to calculate WQI which was proposed by 29 and afterward flourished by 30 and formerly 31 in which a weighting factor is generally multiplied by water parameters. Allowing the degree of clarity, this method classified the water quality using the most measured variables of water quality 32. One of the key benefits of this procedure is the specific usage of water, which makes comparisons simpler with fewer factors needed.
The water quality index,
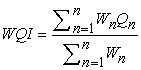 |
 |
Qn is the Quality rating and Wn, is the Unit weight for the nth water quality parameter
N is Water quality parameters
Vn is the estimated value of nth parameter at a given water sampling station
Sn is the Standard possible value for nth parameter whereas Vi is the ideal value of nth parameter, (0 for all) except pH = 7 and DO = 14.6 mg/L 31
By using the following equation, for each water quality parameter, the unit weight is calculated by a value inversely proportional to recommended standard (Sn) for the corresponding parameter.
Wn = K/ Sn Where, K is proportionality constant. K value was calculated as;
 |
In the following Table 1, Quality approach of Water and Water Quality Index level both are depended on the Weighted Arithmetic Index method was represented.
For conducting the statistical analysis, gathered data were arranged in proper format. To interpret those data, SPSS 25, Microsoft office word, and Excel applications were used for descriptive examination and explanation of the findings.
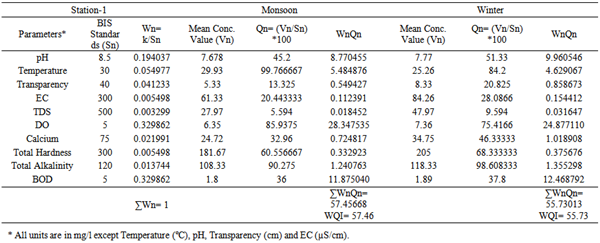
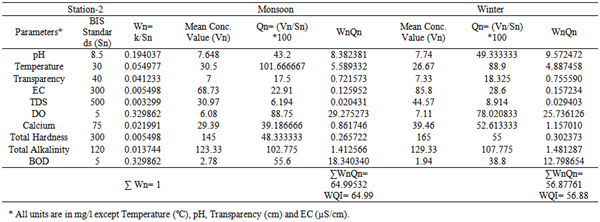
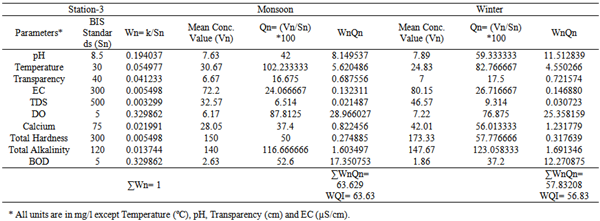
The physico-chemical attributes for the water samples of monsoon and winter season are incorporated in Table 2 with their mean value and standard deviation. Among all sampling stations, the water samples parameters varied significantly across both the monsoon and winter season. The pH is slightly different in each season and is rather consistent. The mean value of pH in monsoon is 7.65, the highest value examined in station-1. On the contrary, station-3 had the highest value (7.89) during winter followed by station-1 and 2 with the mean value of 7.80 (Table 2). Although all recorded pH value is within the recommended limit by ECR in 1997 (6.5-8.5) but the river water has a proximity to be alkaline for effluent runoff and discharge of alkali consisting waste. The present explored insight and cause effect results also support by some similar studies like Majumder et al. 34, Alam et al. 35 and Islam et al. 36. The detail hydrochemistry and analytical results are shown in Annex A and Annex B.
In monsoon, the maximum water temperature of the river was 30.67ºC at station-3 while lowest temperature (26.67ºC) was examined at station-2. The average temperature of water samples was 30.37ºC and 25.59ºC in monsoon and winter consequently (Table 2). Followed by the standard water temperature limit is 20-30ºC, indicating that the water temperature is within the suggested limit. Constituents and variables of water temperature influence the aquatic flora and fauna 37 supported by similar investigation carried out by Alam et al. 35 and Khan et al. 38.
The highest water transparency of Jhapjhapia river was observed 7 cm at station-2 during monsoon, whereas during winter the highest transparency was 8.33 cm observed at station 1 (Table 2). Suitable for aquatic environments 39. Overall, the lowest transparency found during the study period might be the cause of surface runoff and erosion of river bank, dynamic river water flow with sand. Human-induced interference like wastewater discharge, river bed siltation and circulation can influence the transparency of Jhapjhapia River’s water.
The electrical conductivity at station-3 was higher compared to stations 1 and 2 correspondingly. The electrical conductivity varied from 61.33-72.2 μS/cm with an average value of 67.74 μS/cm during monsoon as well as during winter the EC values ranged from 80.15-85.8 μS/cm while the uppermost value detected in station-2. The highest agricultural runoff from farmlands increases the concentration of EC whereas the lowest concentration caused by less runoff and discharge trend 43
At station-3, the highest TDS value was examined during the monsoon season compared to station 1 and 2, but in winter highest value of TDS was inspected at station 1 followed by the station 2 and 3. In Bangladesh, the standard limit of TDS is approximately 1000 mg/L 42. The less and high amounts of both insoluble and soluble minerals might be act as the significant cause of varied concentrations of TDS 44.
The DO content of the river water revealed the maximum value was 6.35 mg/l and 7.36 mg/l at station 1 while the lowest was 6.08 mg/l and 7.11 mg/l at station -2 during monsoon and winter respectively, whereas in monsoon the average dissolve oxygen concentration was 6.20 mg/l and in winter the mean DO content was 7.23 mg/l (Table 2). Compare to standard DO concentration is 5.0 mg/l 41 most of the water samples cross the standard limit 36.
The uppermost and lowest hardness were observed at station-1 and station-2 during monsoon and winter respectively, whereas, the mean hardness content was found 158.89 mg/l and 181.11 mg/l in monsoon and winter accordingly (Table 2). The standard of surface water hardness contents is >100 39 and the study revealed that suitable hardness contents help to balance the acid-base characteristics of the aquatic environment. Huq and Alam 45 and Islam et al., 36 found similar results which are closely analogous to the current investigation.
The mean alkalinity of the river water was noted 129.89 mg/l and 174 mg/l in monsoon and winter, correspondingly. The concentration of total alkalinity in a highly productive water body should be more than 100 mg/l 39. At Station -3, the highest alkalinity found to be (140 mg/l and 147.67 mg/l) might have caused by agricultural practices and surface flow into the river system (Table 2). In both seasons, the highest BOD contents were found at station-2 which was 2.78 mg/l and 1.94 mg/l respectively (Table 2) whereas the mean BOD content was 2.40 mg/l during monsoon and 1.89 mg/l during winter. The study showed that the BOD contents of the Jhapjhapia River water were within the standard limit <6.0mg/l 40 which was likely suitable for fish production. Islam et al., 36 and Majumder et.al 34 found parallel results to the present study.
3.2. Water Quality Index (WQI)The water quality index (WQ) is a number without dimension that adds several water quality indicators together. Ten crucial parameters for measuring water quality are utilized by the weighted Arithmetic Index Method. Individual water quality results are used to compute individual WQI station wise before total WQI calculations are performed 31. The periodic computation of the station wise WQI is the same. The unit weight and their standards are always the same for all three stations and seasons as well. For the determination of WQI, the unit weight (Wn) of different parameters with their standards is presented in Table 3. Therefore, the summation of the unit weight of all parameters must have to be 1. That depicts the weighted arithmetic method is significant (Table 3). To compare the water quality of several bodies in a certain area, WQI is used and it provides information to the public about water quality. The indices are the most efficient way to notify the relevant authorities for managing water quality 46.
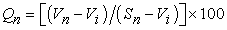
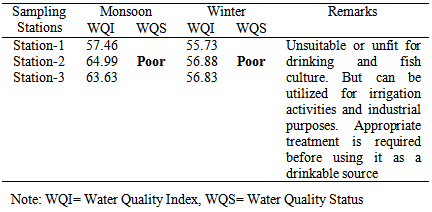
The WQI at three stations during two seasons (monsoon and winter) are shown in Tables 4-6. Besides, Table 7 states the WQI of Jhapjhapia River along with its status of water quality (WQS). Each station's water quality value is based on three water sample average data. The WQI values ranged from 57.46 (Station-1) to 64.99 (Station-2) in the monsoon and from 55.73 (Station 1) to 56.88 (Station 2) in the winter across three sampling stations and two seasons. The study's station wise water quality index results for the year 2022 are presented in Table 4, Table5 and Table6 as 57.46, 64.99, and 63.63 in monsoon and 55.73, 56.88 and 56.83 in winter respectively. The WQI at the three stations of Jhapjhapia River during the monsoon and winter seasons are illustrated in Figure 2. In monsoon, the highest WQI was 64.99 and the lowest was 57.46 on the other hand in winter the highest WQI was 56.88 and the lowest was 55.73 (Figure 2).
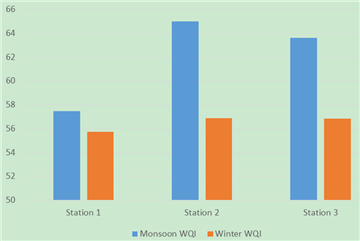
Based on particular physicochemical parameters for all water samples, the measured water quality index (WQI) (Table 4,Table 5,Table 6, and Table 7) demonstrates the quality of water is poor (Grade-C). The overall quality of the water under study is found to be valued between 51-75 (Table 7) and it is unfit for drinking. The water of the river can be utilized for industrial, irrigation, and other activities but is unsuited or not safe for drinking purposes. Before using the water of the river appropriate treatment is required.
The findings from the water quality index (WQI) insights that the quality of surface water for all three stations of Jhapjhapia River was poor, indicating the unsuitability of water for human consumption and freshwater fish culture. Though the water of this river basin is still suitable for industrial and agricultural purposes but continuous human interruptions and wastewater discharge into this distributary through the adjacent link channels specify the vulnerability of water sources. Besides, adding organic and inorganic ingredients into the river system by agricultural and municipal runoff might cause poor-quality water based on WQI value across the stations. The overall assessment also suggests the deterioration of water quality, and demand for appropriate treatment, especially for safe human consumption. Dumping of poultry waste and nearby sources of wastewater discharge must be stopped or treated before entering into the mainstream of Jhapjhapia River. Optimum use, effective strategic plan and awareness of the local inhabitants and stakeholder is very much important for abating the contamination and sustaining the suitability of water over the time.
The authors are grateful to Environmental Science Discipline of Khulna University, Bangladesh for providing support during laboratory analysis.
| [1] | Igwe, O., Adepehin, E.J. and Adepehin, J.O., “Integrated geochemical and microbiological approach to water quality assessment: case study of the Enyigba metallogenic province, South-eastern Nigeria,” Environmental earth sciences, 74. 3251-3262. 2015. | ||
| In article | View Article | ||
| [2] | Islam, M.M., Azad, A.K., Ara, M.H., Rahman, M., Hassan, N., Swarnokar, S.C. and Rabeya, I., “Environmental study on a coastal river of Bangladesh with reference to irrigation water quality assessment: A case study on Shailmari River, Khulna,” Journal of Geoscience and Environment Protection, 4(10). 41. 2016. | ||
| In article | View Article | ||
| [3] | Swarnokar, S.C., Hassan, N., Rahman, M., Islam, M.M. and Ara, M.H., “Assessment of groundwater quality in a Tidal River basin of the Ganges Delta in Bangladesh,” Journal of Geoscience and Environment Protection, 7(5). 131-151. 2019. | ||
| In article | View Article | ||
| [4] | Vijai, K., and SM Mazhar Nazeeb Khan. "Analysis of groundwater quality for irrigation purpose in Pennagaram block of Dharmapuri District, Tamilnadu, India." Materials Today: Proceedings 48: 527-534. 2022. | ||
| In article | View Article | ||
| [5] | Chinedu, S.N., Nwinyi, O., Oluwadamisi, A.Y. and Eze, V. N., “Assessment of water quality in Canaanland, Ota, southwest Nigeria,” Agriculture and Biology Journal of North America, 2(4). 577-583. 2011. | ||
| In article | View Article | ||
| [6] | Deo, Ravinesh C., Pijush Samui, Ozgur Kisi, and Zaher Mundher Yaseen, eds. Intelligent data analytics for decision-support systems in hazard mitigation: theory and practice of hazard mitigation. Springer, 2021. | ||
| In article | View Article | ||
| [7] | Bora, M. and Goswami, D.C., “Water quality assessment in terms of water quality index (WQI): case study of the Kolong River, Assam, India,” Applied Water Science, 7. 3125-3135. 2017.doi: 10.1007/s13201 -016-0451 -y. | ||
| In article | View Article | ||
| [8] | Mohammed, S.I. and Abdulrazzaq, K.A., “Developing water quality index to assess the quality of the drinking water,” Civil Engineering Journal, 4(10). 2345-2355. 2018. http://dx.doi.org/10.28991/cej-03091164 | ||
| In article | |||
| [9] | Holloway, J.M., Dahlgren, R.A., Hansen, B. and Casey, W.H., “Contribution of bedrock nitrogen to high nitrate concentrations in stream water,” Nature, 395(6704). 785-788. 1998. DOI: https://doi.org/10.1038/27410 10. | ||
| In article | |||
| [10] | Ji, X., Dahlgren, R.A.and Zhang, M., “Comparison of seven water quality assessment methods for the characterization and management of highly impaired river systems,” Environmental monitoring and assessment, 188. 1-16. 2016. DOI 10.1007/s10661-015-5016-2 | ||
| In article | View Article PubMed | ||
| [11] | Chen, K., Chen, H., Zhou, C., Huang, Y., Qi, X., Shen, R…… and Ren, H, “Comparative analysis of surface water quality prediction performance and identification of key water parameters using different machine learning models based on big data,” Water research, 171. 115454. 2020. https://doi.org/10.1016/j.watres.2019.115454 | ||
| In article | |||
| [12] | Angello, Z.A., Tränckner, J., Behailu, BM,. “Spatio-temporal evaluation and quantification of Pollutant source contribution in little Akaki River, Ethiopia: Conjunctive application of factor analysis and multivariate receptor model,” Polish Journal of Environmental Studies, 30(1). 23-34. 2021. | ||
| In article | View Article | ||
| [13] | Wu, D., Lu, J., Liu, Y., Zhang, Z. and Luo, L., “Positive effects of COVID-19 control measures on influenza prevention,” International Journal of Infectious Diseases, 95. 345-346.2020. | ||
| In article | View Article PubMed | ||
| [14] | World Health Organization. Guidelines for drinking-water quality. Vol. 1. world health organization, 2004. | ||
| In article | |||
| [15] | Bis, I. "10500 Indian standard drinking water–specification, second revision." Bureau of Indian Standards, New Delhi, 2012. | ||
| In article | |||
| [16] | EPA, U.S. Parameters of water quality: Analysis, interpretation and standards. A Publication of Environmental Protection Agency, Washington DC, USA, 2001. | ||
| In article | |||
| [17] | Muyen, Z., Rashedujjaman, M. and Rahman, M. S., “Assessment of water quality index: a case study in Old Brahmaputra river of Mymensingh District in Bangladesh,” Progressive Agriculture, 27(3). 355-361. 2016. DOI: https://doi.org/10.3329/pa.v27i3.30832 | ||
| In article | |||
| [18] | Katyal, D., “Water quality indices used for surface water vulnerability assessment,” International journal of environmental sciences, 2(1). 2011. | ||
| In article | |||
| [19] | Akoteyon, I.S., Omotayo, A.O., Soladoye, O. and Olaoye, H.O., “Determination of water quality index and suitability of urban river for municipal water supply in Lagos-Nigeria,” European Journal of Scientific Research, 54(2). 263-271. 2011. | ||
| In article | |||
| [20] | Islam, M. S., Azadi, M.A. and Nasiruddin, M., “Water quality of three ponds of Chittagong University campus using water quality index,” Global scientific journals, 7(12). 2019. | ||
| In article | |||
| [21] | Islam, M.S., Azadi, M.A., Nasiruddin, M. and Islam, M. S., “Water quality index of Halda River, Southeastern Bangladesh,” American Journal of Environmental Engineering, 10(3). 59-68. 2020. | ||
| In article | |||
| [22] | Islam, M.S., Azadi, M.A., Nasiruddin, M. and Islam, M.S., “Water Quality of Boalia Khal Tributary of Halda River by Weighted Arithmetic Index Method,” American Journal of Water Resources, 9(1). 15-22. 2021. | ||
| In article | |||
| [23] | Hossen, M.A., Rafiq, F., Kabir, M.A. and Morshed, M.G., Assessment of water quality scenario of Karnaphuli River in terms of water quality index, South-Eastern Bangladesh,” American Journal of Water Resources, 7(3). 106-110. 2019. DOI:10.12691/ajwr-7-3-3. | ||
| In article | |||
| [24] | Jhapjhapia, Khulna Division, Bangladesh. (n.d.). Retrieved June 30, 2022, from https://www.mindat.org/feature-1199975.html | ||
| In article | |||
| [25] | FAO. Irrigation in Southern and Eastern Asia in Figures. Rome, 2011. | ||
| In article | |||
| [26] | Alam, M., Bangladesh in World Regional Geology, Columbia University Press, New York, 1990. | ||
| In article | |||
| [27] | Roy, M.K., Datta, D.K., Adhikari, D.K., Chowdhury, B.K. and Roy, P.J., “Geology of the Khulna city corporation,” Journal of Life and Earth Science, 1. 57-63. 2005. | ||
| In article | |||
| [28] | APHA. Standard Methods for the Examination of Water and Waste Water. American Public Health Association, Washington DC, 2012. | ||
| In article | |||
| [29] | Horton, R.K., “An index number system for rating water quality,” Journal of Water Pollution Control Federation, 37(3). 300-306. 1965. | ||
| In article | |||
| [30] | Brown, E., Skougstad, M.W. and Fishman, M.J., Methods for collection and analysis of water samples for dissolved minerals and gases. Washington, D.C., 1970, 173. | ||
| In article | |||
| [31] | Cude, C.G., “Oregon water quality index a tool for evaluating water quality management effectiveness 1,” JAWRA Journal of the American Water Resources Association, 37(1). 125-137. 2001. | ||
| In article | |||
| [32] | Tyagi, S., Sharma, B., Singh, P. and Dobhal, R., “Water quality assessment in terms of water quality index,” American Journal of water resources, 1(3). 34-38. 2013. | ||
| In article | |||
| [33] | Chaterjee, C. and Raziuddin, M., “Determination of water quality index (WQI) of a degraded river in Asanol Industrial area, Raniganj, Burdwan, West Bengal,” Nature Environment and Pollution Technology, 2. 181-189. 2002. | ||
| In article | |||
| [34] | Majumder, M.S.I., Talukder, S., Hasan, I., Islam, M.S., Kabirul, M. and Islam, N.H., “Water Quality Assessment: A Case Study of the Jhenai River in Bangladesh,” J. Appl. Res, 4(7). 1884-1888. 2018. | ||
| In article | |||
| [35] | Alam, A.M.S., Islam, M.A., Rahman, M.A., Ahmed, A., Islam, S., Sultana, K. S. and Siddique M. N., “Transport of toxic metal through the major river system of Bangladesh,” Journal of Chemical Society in Pakistan, 26(3). 328-332. 2004. | ||
| In article | |||
| [36] | Islam M.S., Kabir, M.H., Sifat, S.A., Meghla, N.T. and. Tusher T.R., “Status of water quality from the padma river at bheramara point of kushtia in bangladesh,” Bangladesh J. Environ. Sci., 27. 110-115. 2014. | ||
| In article | |||
| [37] | Huet, Marcel, and Jozef A. Timmermans. Textbook of fish culture. Breeding and cultivation of fish. No. Ed. 2. Fishing News Books Ltd., 1986. | ||
| In article | |||
| [38] | Khan, M.A.I., Hossain, A. M. M Huda, M. E. Islam M.S. and Elahi. S. F., “Physicochemical and biological aspects of monsoon waters of Ashulia for economic and aesthetic applications: Preliminary studies,” Bangladesh Journal of Scientific and Industrial Research, 42(4). 377-396. 2007. | ||
| In article | |||
| [39] | Rahman, M.S., “Water quality management in Aquaculture,” BRAC Prakashan, Dhaka, Bangladesh, 84. 1992. | ||
| In article | |||
| [40] | ECR (The Environment Conservation Rules), Department of Environment, Ministry of Environment and Forest, Govt. of the People’s Republic of Bangladesh.1997. | ||
| In article | |||
| [41] | EQS (Environmental Quality Standard). Bangladesh Gazette, registered nr. DA-I. Ministry of Environment. Government of the People's Republic of Bangladesh.1997. | ||
| In article | |||
| [42] | ADB (Asian Development Bank). Training manual for environmental monitoring. Engineering Science Inc., USA.pp.2-16. 1994. | ||
| In article | |||
| [43] | Kawo, A.H., Abdullahi, B.A., Saminu, M.Y. and Abdul Hadi, S.K., “Seasonal and Spatial Variations in Water Quality and Its Ecological Implications on Challawa River, Nigeria,” Nigerian Journal of Basic and Applied Sciences, 16(2). 129-135. 2008. | ||
| In article | |||
| [44] | Hassan, M. and Salihu, N., “Assessing River Water Quality using Weighted Arithmetic Water Quality Index in River Gada, Katsina State, Nigeria,” Dutse Journal of Pure and Applied Sciences (DUJOPAS), 7(2b). June 2021. | ||
| In article | |||
| [45] | Huq, SM Imamul, and M. D. Alam. "A handbook on analyses of soil, plant and water." BACER-DU, University of Dhaka, Bangladesh, 246.2005. | ||
| In article | |||
| [46] | Jagadeeswari, P.B. and Ramesh, K., “Water quality index for assessment of water quality in South Chennai coastal aquifer, Tamil Nadu, India,” International Journal of Chem Tech Research, 4(4). 1582-1588. 2012. | ||
| In article | |||
Published with license by Science and Education Publishing, Copyright © 2023 Sadia Islam Mou, Md. Tamjidul Ridwan, Sadhon Chandra Swarnokar and Khandoker Faiaz Ishtiak
![]() This work is licensed under a Creative Commons Attribution 4.0 International License. To view a copy of this license, visit
http://creativecommons.org/licenses/by/4.0/
This work is licensed under a Creative Commons Attribution 4.0 International License. To view a copy of this license, visit
http://creativecommons.org/licenses/by/4.0/
| [1] | Igwe, O., Adepehin, E.J. and Adepehin, J.O., “Integrated geochemical and microbiological approach to water quality assessment: case study of the Enyigba metallogenic province, South-eastern Nigeria,” Environmental earth sciences, 74. 3251-3262. 2015. | ||
| In article | View Article | ||
| [2] | Islam, M.M., Azad, A.K., Ara, M.H., Rahman, M., Hassan, N., Swarnokar, S.C. and Rabeya, I., “Environmental study on a coastal river of Bangladesh with reference to irrigation water quality assessment: A case study on Shailmari River, Khulna,” Journal of Geoscience and Environment Protection, 4(10). 41. 2016. | ||
| In article | View Article | ||
| [3] | Swarnokar, S.C., Hassan, N., Rahman, M., Islam, M.M. and Ara, M.H., “Assessment of groundwater quality in a Tidal River basin of the Ganges Delta in Bangladesh,” Journal of Geoscience and Environment Protection, 7(5). 131-151. 2019. | ||
| In article | View Article | ||
| [4] | Vijai, K., and SM Mazhar Nazeeb Khan. "Analysis of groundwater quality for irrigation purpose in Pennagaram block of Dharmapuri District, Tamilnadu, India." Materials Today: Proceedings 48: 527-534. 2022. | ||
| In article | View Article | ||
| [5] | Chinedu, S.N., Nwinyi, O., Oluwadamisi, A.Y. and Eze, V. N., “Assessment of water quality in Canaanland, Ota, southwest Nigeria,” Agriculture and Biology Journal of North America, 2(4). 577-583. 2011. | ||
| In article | View Article | ||
| [6] | Deo, Ravinesh C., Pijush Samui, Ozgur Kisi, and Zaher Mundher Yaseen, eds. Intelligent data analytics for decision-support systems in hazard mitigation: theory and practice of hazard mitigation. Springer, 2021. | ||
| In article | View Article | ||
| [7] | Bora, M. and Goswami, D.C., “Water quality assessment in terms of water quality index (WQI): case study of the Kolong River, Assam, India,” Applied Water Science, 7. 3125-3135. 2017.doi: 10.1007/s13201 -016-0451 -y. | ||
| In article | View Article | ||
| [8] | Mohammed, S.I. and Abdulrazzaq, K.A., “Developing water quality index to assess the quality of the drinking water,” Civil Engineering Journal, 4(10). 2345-2355. 2018. http://dx.doi.org/10.28991/cej-03091164 | ||
| In article | |||
| [9] | Holloway, J.M., Dahlgren, R.A., Hansen, B. and Casey, W.H., “Contribution of bedrock nitrogen to high nitrate concentrations in stream water,” Nature, 395(6704). 785-788. 1998. DOI: https://doi.org/10.1038/27410 10. | ||
| In article | |||
| [10] | Ji, X., Dahlgren, R.A.and Zhang, M., “Comparison of seven water quality assessment methods for the characterization and management of highly impaired river systems,” Environmental monitoring and assessment, 188. 1-16. 2016. DOI 10.1007/s10661-015-5016-2 | ||
| In article | View Article PubMed | ||
| [11] | Chen, K., Chen, H., Zhou, C., Huang, Y., Qi, X., Shen, R…… and Ren, H, “Comparative analysis of surface water quality prediction performance and identification of key water parameters using different machine learning models based on big data,” Water research, 171. 115454. 2020. https://doi.org/10.1016/j.watres.2019.115454 | ||
| In article | |||
| [12] | Angello, Z.A., Tränckner, J., Behailu, BM,. “Spatio-temporal evaluation and quantification of Pollutant source contribution in little Akaki River, Ethiopia: Conjunctive application of factor analysis and multivariate receptor model,” Polish Journal of Environmental Studies, 30(1). 23-34. 2021. | ||
| In article | View Article | ||
| [13] | Wu, D., Lu, J., Liu, Y., Zhang, Z. and Luo, L., “Positive effects of COVID-19 control measures on influenza prevention,” International Journal of Infectious Diseases, 95. 345-346.2020. | ||
| In article | View Article PubMed | ||
| [14] | World Health Organization. Guidelines for drinking-water quality. Vol. 1. world health organization, 2004. | ||
| In article | |||
| [15] | Bis, I. "10500 Indian standard drinking water–specification, second revision." Bureau of Indian Standards, New Delhi, 2012. | ||
| In article | |||
| [16] | EPA, U.S. Parameters of water quality: Analysis, interpretation and standards. A Publication of Environmental Protection Agency, Washington DC, USA, 2001. | ||
| In article | |||
| [17] | Muyen, Z., Rashedujjaman, M. and Rahman, M. S., “Assessment of water quality index: a case study in Old Brahmaputra river of Mymensingh District in Bangladesh,” Progressive Agriculture, 27(3). 355-361. 2016. DOI: https://doi.org/10.3329/pa.v27i3.30832 | ||
| In article | |||
| [18] | Katyal, D., “Water quality indices used for surface water vulnerability assessment,” International journal of environmental sciences, 2(1). 2011. | ||
| In article | |||
| [19] | Akoteyon, I.S., Omotayo, A.O., Soladoye, O. and Olaoye, H.O., “Determination of water quality index and suitability of urban river for municipal water supply in Lagos-Nigeria,” European Journal of Scientific Research, 54(2). 263-271. 2011. | ||
| In article | |||
| [20] | Islam, M. S., Azadi, M.A. and Nasiruddin, M., “Water quality of three ponds of Chittagong University campus using water quality index,” Global scientific journals, 7(12). 2019. | ||
| In article | |||
| [21] | Islam, M.S., Azadi, M.A., Nasiruddin, M. and Islam, M. S., “Water quality index of Halda River, Southeastern Bangladesh,” American Journal of Environmental Engineering, 10(3). 59-68. 2020. | ||
| In article | |||
| [22] | Islam, M.S., Azadi, M.A., Nasiruddin, M. and Islam, M.S., “Water Quality of Boalia Khal Tributary of Halda River by Weighted Arithmetic Index Method,” American Journal of Water Resources, 9(1). 15-22. 2021. | ||
| In article | |||
| [23] | Hossen, M.A., Rafiq, F., Kabir, M.A. and Morshed, M.G., Assessment of water quality scenario of Karnaphuli River in terms of water quality index, South-Eastern Bangladesh,” American Journal of Water Resources, 7(3). 106-110. 2019. DOI:10.12691/ajwr-7-3-3. | ||
| In article | |||
| [24] | Jhapjhapia, Khulna Division, Bangladesh. (n.d.). Retrieved June 30, 2022, from https://www.mindat.org/feature-1199975.html | ||
| In article | |||
| [25] | FAO. Irrigation in Southern and Eastern Asia in Figures. Rome, 2011. | ||
| In article | |||
| [26] | Alam, M., Bangladesh in World Regional Geology, Columbia University Press, New York, 1990. | ||
| In article | |||
| [27] | Roy, M.K., Datta, D.K., Adhikari, D.K., Chowdhury, B.K. and Roy, P.J., “Geology of the Khulna city corporation,” Journal of Life and Earth Science, 1. 57-63. 2005. | ||
| In article | |||
| [28] | APHA. Standard Methods for the Examination of Water and Waste Water. American Public Health Association, Washington DC, 2012. | ||
| In article | |||
| [29] | Horton, R.K., “An index number system for rating water quality,” Journal of Water Pollution Control Federation, 37(3). 300-306. 1965. | ||
| In article | |||
| [30] | Brown, E., Skougstad, M.W. and Fishman, M.J., Methods for collection and analysis of water samples for dissolved minerals and gases. Washington, D.C., 1970, 173. | ||
| In article | |||
| [31] | Cude, C.G., “Oregon water quality index a tool for evaluating water quality management effectiveness 1,” JAWRA Journal of the American Water Resources Association, 37(1). 125-137. 2001. | ||
| In article | |||
| [32] | Tyagi, S., Sharma, B., Singh, P. and Dobhal, R., “Water quality assessment in terms of water quality index,” American Journal of water resources, 1(3). 34-38. 2013. | ||
| In article | |||
| [33] | Chaterjee, C. and Raziuddin, M., “Determination of water quality index (WQI) of a degraded river in Asanol Industrial area, Raniganj, Burdwan, West Bengal,” Nature Environment and Pollution Technology, 2. 181-189. 2002. | ||
| In article | |||
| [34] | Majumder, M.S.I., Talukder, S., Hasan, I., Islam, M.S., Kabirul, M. and Islam, N.H., “Water Quality Assessment: A Case Study of the Jhenai River in Bangladesh,” J. Appl. Res, 4(7). 1884-1888. 2018. | ||
| In article | |||
| [35] | Alam, A.M.S., Islam, M.A., Rahman, M.A., Ahmed, A., Islam, S., Sultana, K. S. and Siddique M. N., “Transport of toxic metal through the major river system of Bangladesh,” Journal of Chemical Society in Pakistan, 26(3). 328-332. 2004. | ||
| In article | |||
| [36] | Islam M.S., Kabir, M.H., Sifat, S.A., Meghla, N.T. and. Tusher T.R., “Status of water quality from the padma river at bheramara point of kushtia in bangladesh,” Bangladesh J. Environ. Sci., 27. 110-115. 2014. | ||
| In article | |||
| [37] | Huet, Marcel, and Jozef A. Timmermans. Textbook of fish culture. Breeding and cultivation of fish. No. Ed. 2. Fishing News Books Ltd., 1986. | ||
| In article | |||
| [38] | Khan, M.A.I., Hossain, A. M. M Huda, M. E. Islam M.S. and Elahi. S. F., “Physicochemical and biological aspects of monsoon waters of Ashulia for economic and aesthetic applications: Preliminary studies,” Bangladesh Journal of Scientific and Industrial Research, 42(4). 377-396. 2007. | ||
| In article | |||
| [39] | Rahman, M.S., “Water quality management in Aquaculture,” BRAC Prakashan, Dhaka, Bangladesh, 84. 1992. | ||
| In article | |||
| [40] | ECR (The Environment Conservation Rules), Department of Environment, Ministry of Environment and Forest, Govt. of the People’s Republic of Bangladesh.1997. | ||
| In article | |||
| [41] | EQS (Environmental Quality Standard). Bangladesh Gazette, registered nr. DA-I. Ministry of Environment. Government of the People's Republic of Bangladesh.1997. | ||
| In article | |||
| [42] | ADB (Asian Development Bank). Training manual for environmental monitoring. Engineering Science Inc., USA.pp.2-16. 1994. | ||
| In article | |||
| [43] | Kawo, A.H., Abdullahi, B.A., Saminu, M.Y. and Abdul Hadi, S.K., “Seasonal and Spatial Variations in Water Quality and Its Ecological Implications on Challawa River, Nigeria,” Nigerian Journal of Basic and Applied Sciences, 16(2). 129-135. 2008. | ||
| In article | |||
| [44] | Hassan, M. and Salihu, N., “Assessing River Water Quality using Weighted Arithmetic Water Quality Index in River Gada, Katsina State, Nigeria,” Dutse Journal of Pure and Applied Sciences (DUJOPAS), 7(2b). June 2021. | ||
| In article | |||
| [45] | Huq, SM Imamul, and M. D. Alam. "A handbook on analyses of soil, plant and water." BACER-DU, University of Dhaka, Bangladesh, 246.2005. | ||
| In article | |||
| [46] | Jagadeeswari, P.B. and Ramesh, K., “Water quality index for assessment of water quality in South Chennai coastal aquifer, Tamil Nadu, India,” International Journal of Chem Tech Research, 4(4). 1582-1588. 2012. | ||
| In article | |||


