 OPEN ACCESS
  PEER-REVIEWED
Application of Spatio-Temporal Clustering in Forecasting Optimization of Geo-Referenced Time Series
Sonja Pravilovic1, 2, , Annalisa Appice1
1Dipartimento di Informatica, Università degli Studi di Bari Aldo Moro via Orabona, Bari, Italy
2Faculty of Information Technology, Mediterranean University, Vaka Djurovica b.b. Podgorica, Montenegro
Abstract
A novel field of data mining has been spatio-temporal clustering focused on the new methods and techniques, which are able to adapt previous methods and solutions to the new problems. A set of geo-referenced time series are data generated by several devices like GPS, sensor station, cell phones and many other sensing device. This paper defines the the new K-means clustering grouping spatially and temporally correlated geo-referenced time series obtained from sensors in a specific geographic area. For all time series in the cluster, choosing the best forecasting parameters, we apply one of the most accurate and most efficient forecasting models of time series called ARIMA. This paper investigates a new mechanism to determine spatio-temporal distances measure between sensor stations in the same spatio-temporal neighborhood (cluster). By calculating, the best forecasting parameters applied for all time series in the same cluster proposed algorithm obtains more accurate and more efficient forecasting results, than forecasting time series independently one from other in space and time. We studied the accuracy of proposed model comparing it to the already known applied to compute prediction of time series and applying it to real life data.
At a glance: Figures
Keywords: spatio-temporal clustering, time-series, ARIMA model
American Journal of Modeling and Optimization, 2014 2 (1),
pp 8-15.
DOI: 10.12691/ajmo-2-1-2
Received January 20, 2014; Revised February 12, 2014; Accepted February 18, 2014
Copyright © 2013 Science and Education Publishing. All Rights Reserved.Cite this article:
- Pravilovic, Sonja, and Annalisa Appice. "Application of Spatio-Temporal Clustering in Forecasting Optimization of Geo-Referenced Time Series." American Journal of Modeling and Optimization 2.1 (2014): 8-15.
- Pravilovic, S. , & Appice, A. (2014). Application of Spatio-Temporal Clustering in Forecasting Optimization of Geo-Referenced Time Series. American Journal of Modeling and Optimization, 2(1), 8-15.
- Pravilovic, Sonja, and Annalisa Appice. "Application of Spatio-Temporal Clustering in Forecasting Optimization of Geo-Referenced Time Series." American Journal of Modeling and Optimization 2, no. 1 (2014): 8-15.
| Import into BibTeX | Import into EndNote | Import into RefMan | Import into RefWorks |
1. Introduction
Geo-statistical space-time models addressing environmental problems are increasingly used for environmental monitoring or global warming, but also for stream flow or forecasting precipitation. Given the undisputed ubiquity of data acquisition systems, it is necessary that the tools of data analysis are able to model behaviors that vary in time and space, specifically geographically distributed uni-variate or multivariate spatio-temporal time series. Geo-statistical space-time models applied for modeling spatio-temporal distributions in several scientific disciplines resulting from dynamic processes evolving in both space and time. It is critical in many scientific and engineering fields from environmental sciences, to climate prediction and meteorology, hydrology, engineering, but it is currently applied in diverse disciplines including petroleum geology, hydro-geology, hydrology, oceanography and meteorology, geography and geochemistry, environmental control, landscape ecology, soil science and agriculture (especially in precision farming).
Space-time data set traditionally analyzed across models completely developed for spatial or temporal distributions. The joint space-time reliance is often not fully modeled nor-improved in estimation or forecasting of the unknown value at an unmonitored position[1].
The goal of this paper is the use of spatio-temporal correlation among neighboring time series to reduce computational cost. Reduction of the computation cost in a spatio-temporal analysis is possible using a filtering and refining algorithm based on grouping the spatio-temporal correlated time series. This paper shows a new approach, which uses experimental Earth science data set to reduce run time computation costs and decrease the accuracy of proposed prediction algorithm.
When there are complex or/and large data set, a process of clustering (grouping similar spatio-temporal time series) and prediction of behavior of time series (regression analysis) can be good combination of interactive visual displays, but also a very powerful instrument of analysis.
Some of clustering methods and techniques require the data set represented as points in a multidimensional space of properties (or like a vectors feature).
In a part of prediction of behavior of geo-referenced time series the literature describes several techniques (ARMA, ARIMA, Exponential Smoothing, Regression, etc.) studying forecasting of time-series as well as regression of spatially distributed data. However, the majority of these techniques treat the space or time, rarely time and space simultaneously.
This paper seeks to explore and analyze geophysical distributed time-series data collected by sensors widespread on the Earth’s surface. Therefore, our proposal synthetically described technique to find accurate and adequate model of forecasting time series taking into consideration not only the dimension (space or time), but both, spatial and temporal information with the aim of improving the ability of prediction with respect to existing model avoiding such information.
The paper is composed as follows. Section 2 summaries the current spatio-temporal clustering and existing auto-regressive integrated moving average fore- casting algorithms applied to time-series analysis describing the obstacles and disadvantages of existing approaches and our efforts to overcome these problems. Section 3 explains our algorithm in particulars and presents the features of the algorithm. Section 4 presents the experimentation and applications, which are implemented to indicate the applicability to real problems, and experimental results. Finally, we summarize our work and discuss directions for future works in conclusion in Section 5.
2. Background
One of the most important problems computing spatio-temporal correlated phenomenon is the different framework act because of different spatial and temporal scales, therefore any averaging procedure, temporal and/or spatial, change the original spatio-temporal correlation of the process under study.
Specified problems referee to the characterization of aggregate variables, the temporal evolving of the temperature averaged across a geographic area. Inference in such events should account for the increased temporal or spatial continuity [2]. Geo-statistical space-time models have been also developed for emphasize the difference between scales with regard to the original and aggregate processes [3, 4].
The examination that follows is focused on stochastic models involving extension not only spatial (geo-statistical), but also temporal analysis tools to involve the additional time dimension. The objective is to build a thread linking the various stochastic models proposed, as well as to highlight their assumptions, benefits and restrictions.
In terms of spatio-temporal data dimension, this paper tries to use spatio-temporal correlation of the data, apply k-means clustering methods of data represented by spatio-temporal distance measure, and then for all time series in the same cluster compute the best forecasting parameters and produce more accurate and more efficient forecasting algorithm.
Some authors [5] perform spatio-temporal clustering on each time sequences separately. Some uses only spatial neighboring [6] or temporal correlation. Every strategy needs exploration bases of specific goal of analysis.
Geo referenced time series is a set of spatial collection of time series where each time series reference to a location in common spatial surfaces. To identify pairs of potentially interacting or correlation elements between two spatial time series is often used correlation analysis. In that case, the computational costs are very high, especially when the number of locations in the spatial surface and the dimension of the time series are large.
2.1. Spatio-Temporal K-means ClusteringSpatio-temporal k-means clustering is a method of vector quantization, originally from signal processing, that is popular for cluster analysis in data mining. K-means clustering aims to partition n observations into k spatio-temporal clusters in which each observation belongs to the cluster with the nearest mean, serving as a prototype of the cluster. The objective of clustering is to identify a structure of an unlabeled data set by organizing them into homogeneous groups where is minimized similarity within group object and is maximized the dissimilarity between group object.
Spatio-temporal clustering, just like general data clustering, requires a clustering algorithm to form clusters given a set of geo-referenced time series. There are several algorithms developed to cluster different types of time series data. Some of them account for spatial location and some only temporal dimension of time series. A classical approach of spatio-temporal correlation consists in detecting the spatio-temporal distance (correlations) between them.
In this paper we apply computation of spatio-temporal distance measure to cluster similar -geo-referenced time series.
2.2. ARIMA ModelARIMA model is one of the most popular and powerful forecasting technique [10] which is generalization of the model ARMA (autoregressive-moving-average) [10] that describes a (weakly) stationary stochastic process Z in terms of two polynomials, the first called auto-regression and the second called moving average. Formally, 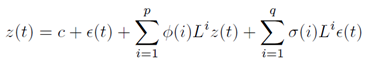 where Liz(t) = z(t − i), p is the auto-regression order, q is the moving average order, φ(i) and σ(i) are the model coefficients, c is a constant, and the random variable ε(·) is the white noise. L is the time lag operator, or backward shift. It permits to observe the same sequence, but from i positions shifted on the left.
ARMA models are fitted by least squares regression after choosing p and q in order to find the coefficients that minimize the error term. ARIMA model, as extension of ARMA uses combination of the differencing operation of order d, which permits to transform a non-stationary time series into stationary one. ARIMA model with parameter d = 0 is the same as ARMA model. Formally, ARIMA model can be defined as: 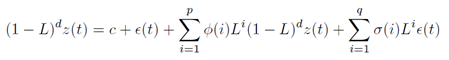 where 1 − L is the differencing operator.
The selection of the ARIMA parameters (p, d, q) which provide acceptable fit to the data is not trivial [7] and a good practice is to search for the smallest p, d and q. To choose best ARIMA parameters p and q, Brock-well and Davis [8] recommend using AICc (AIC with correction c).
Following the idea of Blockwell and Davis, Hyndman and Khandakar [9] propose a stepwise algorithm (called auto.ARIMA) implementing function auto.ARIMA (best.Arima) in the software R. Auto.ARIMA function conducts a search over all possible models beginning with selection of parameter d using unit-root (KPSS) test, and then p and q by minimizing the AICc.
Time series models typically capture a regular behavior over time, and a temporal lag operator is defined for modeling causality between current and previous remark along the time axis [8, 10].
In paper [6] we have investigated a mechanism to automatically determine spatial neighboring in a specific region, and then use the information obtained not only from specific station but also the measures of spatial neighboring sensor stations calculating more accurate forecasting parameters. Paper [6] described an inference procedure called sArima, which allows obtaining a robust and widely applicable intelligent forecasting algorithm. sArima optimizes the traditional model ARIMA jointly estimating the parameters of a forecasting model over spatial neighboring time series (lags).
As the difference of [6], which take into consideration time series belonging to the same spatial neighborhood of observed sensor station, in this paper we apply variation of sArima function, that we called STClu-Arima. The acronym STClu-Arima stands for Cluster based ARIMA function, which we implemented in the software R.
2.3. Paper ContributionThis paper proposes new two steps procedures. The first step calculates spatio-temporal distance measure necessary to apply k-means clustering algorithm grouping that way spatio-temporal correlated time series. This part of algorithm needs generation of new clustering algorithm with a specific spatio-temporal distance function, which properly takes into accounts relevant properties of data depending of the two dimensions: time and space.
The second step applies STClu-Arima function as many times as there are numbers of clusters, searching for best forecasting ARIMA (auto-regressive integrated moving average) parameters for all time series in the cluster, and then on the bases of STClu-Arima output parameters compute prediction. STClu-Arima optimized selection of the appropriate forecasting parameters for all time series in the cluster according to a formulation of the average Akaikes Information Criterion with correction (AICc). The forecasting methods produced the best model (with spatio-temporal optimized parameters) for as many steps ahead as required.
The innovative contribution of this paper is the definition of a new spatio-temporal distance matrix generated on bases of input spatial and temporal data set (geo-referenced time series). STClu-Arima uses a variation of the Hyndman and Khandakar algorithm [9], which processes single time series and combines unit root tests for all time series in the cluster, by minimizing average AICc to choose the best parameters for the model ARIMA. This means that all time series in the same cluster are spatially near and temporally measures similar values.
Formally, let Z be a geo-physical variable and K be a set of randomly sampled stations, which measure Z at successive space points at uniform intervals in time. Firstly, we calculated spatio-temporal distance measure, and then let be this measure input to apply k-means algorithm to determine as output k clusters or spatio-temporal correlated time series. After that, we applied our STClu-Arima algorithm k-times for all time series in the cluster, selecting the best triple (p,d,q) necessary to apply prediction. Let z(i) be the first and zN(i) the last time series in the cluster "C", where N is number of time series in the cluster, and i length of time series. For all stations (measuring time series), STClu-Arima will choose the best parameters model according to the minimal average Akaikes Information Criterion (AICc*) for all N z(i) in the cluster.
3. Spatio-Temporal Clustering and STClu-Arima Procedures
3.1. Spatio-Temporal Clustering ProceduresSpatio-temporal correlation (spatio-temporal distance measure) between geo-referenced time series, in this paper is computed separately for spatial and for temporal dimension. The spatial distance uses Euclidean distance between any two spatially installed stations (2d space). For temporal correlation, we calculate distance-smoothing data.
For example, if we have two sensor stations A and B that are installed at 2D spatial coordinates x and y, and measuring the specific phenomenon (for example temperatures) in 3 periods, A (x1, y1, t1', t2', t3'), B (x2, y2, t1", t2", t3"), for spatial distance we calculate S-dist, and temporal distance T-dist we calculate smoothing data as follow:
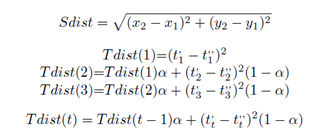 |
For our experimentation we take α = 0.5 giving that way the same importance to a values measured in recent and past interval of time, for all pair of stations. In calculating both, spatial and temporal distance matrix values were scaled. As the results of that distance matrix calculations, we had two quadratic distance matrix (of n dimension - number of stations) Sdist and Tdist, those we finally summaries and calculate:
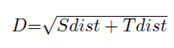 |
The second step of proposed algorithm called STClu-Arima needs more careful explanation. After determined spatio-temporal cluster, can be run STClu-Arima procedures. STClu-Arima optimized selection of the appropriate forecasting parameters valid for all time series in the cluster. The selection of the best forecasting parameters will be done according to a formulation of the Akaikes Information Criterion with correction (AICc). The forecasts produced the best model (with spatio-temporal optimized parameters), for as many steps ahead as required.
The function STClu-Arima inputs the values of all time series in the cluster. See Figure 1. For the primary z(i) until last time series zN(i) in the cluster "C", will be selected the best arima (p, d, q), which fits data of the primary z(i) until last time series zN(i) in the cluster. The triple (p, d, q), refers to parameters of ARIMA model, where p is order of auto-regressive (AR) part, d is differencing order (I), and q order of moving average (MA). The function includes the choice of the best parameters triple (p, d, q) of each time series in the cluster.
Let us consider the sensor stations and time series reported in Figure 1. The triangle, circle and diamond denotes spatially near sensor stations measuring also temporally similar time series. Applying k-means clustering these stations will be part of the same cluster. STClu-Arima algorithm for these time series will compute the selection of the best triple (p, d, q) forecasting parameters.
Every time series is expressed as, the sum of deterministic trend, random walk, and stationary error, and the test is the LM test of the hypothesis that the random walk has zero variance.
STClu-Arima algorithm is two stepped.


 PowerPoint Slide
 Larger image(png format)


Step 1: The differencing order d is chosen based on the successive KPSS unit-root tests [12] for the stationarity of the original data or seasonally differencing data for each time in the cluster. The null hypothesis is stationary time series around a deterministic trend, while the alternate hypothesis considers time series with difference values. The selection of the best parameters of ARIMA model for a single time series is described in [9]. By following the interpretation reported in [9], if a stable seasonal pattern is selected (i.e., the null hypothesis is not rejected) then d can be selected on the original data, otherwise d is determined on the seasonally differenced data. As a difference of [9], selection of parameter d is determined by using repeatedly KPSS tests for each time in the cluster. If only one of them is non-stationary d will be is increase for 1, and so one, until each time series in the cluster becomes stationary.
Step 2: The stepwise algorithm to traverse the model θ=(p, q) is described in [9]. It is three-stepped procedures. Similarly to [9], the algorithm uses a stepwise search to traverse the model space combining values of p and q,. In STClu-Arima this process will refer to all time series in the cluster. Step 21) The best initial model is selected by searching for smaller p and/or q parameters trying all possible combination of 0, 1 and 2 for each time series in the cluster. Similarly to [9], the best initial model for each time series can be selected via the AICc information criterion (the lower AICc, the best model). The AICc is defined as follows:
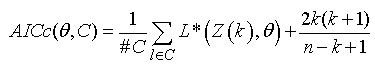 |
where k is the number of parameters in θ; n is the length of the time series in the cluster; L*(·) is the maximum likelihood estimate of θ on the initial states for each time series in the cluster; and l is the number of time series in the cluster "C". In STClu-Arima will be selected as the best model that provides minimal average AICc for each time series in the cluster. Step 22) Variations on the current model are considered by changing current parameters of model p and/or q by ±1. The new current model in STClu-Arima becomes new best model if has lower average AIC. Step 23) Repeat step 22) until cannot be found model with lower average AICc.
The model with the best estimated parameters p, d, q is fitted to all time series in the cluster by least square regression. The model coefficients φ and σ are output and permit to produce point forecasts for testing time series as many steps ahead as required.
4. Case Studies and Applications
The goal of our experimentation is to analyze accuracy and efficiency of proposed algorithm in case of massive data, and to find a real interest of application. The second is to test the hypotheses, which motivate this work:
• using a measure of spatio-temporal distance measure, we applied a traditional k-means clustering algorithm to find spatio-temporal correlation of clustered data;
• for all time series in the cluster, improve the predictive accuracy of regression models by forecasting the future data of a stations decreasing that the run time computation costs.
In order to collect experimental evidence to test defined hypothesis, we designed an experiment consists in two phases. The first step of our algorithm calculates spatio-temporal distance measure. On a base of data representing spatio-temporal distance matrix we then applied the well-known k-means clustering grouping that way the geo-referenced time series that are correlated in time and space.
As a second step of our algorithm, we then applied our STClu-Arima regression techniques for predicting future values of time series. Function STClu-Arima is implemented in software R and operates with vectors representing values of each time series in the cluster, as explained in section 3.2.
For the evaluation of second step of our algorithm, we compare the results (rmse and computation run time) of proposed model of predictions time-series without taking into account the spatio-temporal correlation (spatio-temporal distance measure), with the model that we created, that takes into account the spatio-temporal dependence.
Proposed model described application in modeling spatio-temporal distributions in several scientific disciplines for better forecasting in environmental sciences, climate prediction and meteorology. This paper shows a new approach, which uses experimental Earth science data set to reduce run time computation costs and decrease the accuracy of proposed prediction algorithm.
This paper also explored and analyzed geophysical distributed time-series data collected by sensors widespread on the Earth’s surface to find adequate and more accurate model of forecasting time series. It took into consideration not only the dimension (space or time), but both, spatial and temporal information with the aim of improving the ability of prediction with respect to existing model avoiding such information.
4.1. Data Description
 Spatial position of Eco-Texas sensor stations and respective time series representing: 2(b) Temperature, 2(c) Wind-Speed and 2(d) Ozone) PowerPoint Slide
PowerPoint Slide Larger image(png format)
For experimentation and evaluation of our algorithm, we considered five groups of data collected via three sensor networks: Eco-Texas, Eastern-Wind and SAC (South-American-Temperature).
The first Eco-Texas data set refers to measurement of Temperature, Wind-Speed and Ozone acquired from 26 the sensor stations installed in Texas, collected by the Texas Commission on Environment Quality (TCEQ) in the period May 5-19, 2009. This data set is collection of hourly measures (http://www.tceq. state.tx.us/) related to temperature (Temperature range [0,89], wind speed (Wind Speed range [0.3,29.5]) and ozone (Ozone range [48,105]). As training set, for this data set, we took period May 5-18, 2009, and 19 as testing data set.
The fourth data set consist of values of the wind speed (Wind Speed range [0.12,30.4]) from 1326 stations installed in Eastern-Wind measuring series at 80 meters above sea level in the eastern region of the United States. The values acquired every 30 minutes starting from January 1, 2004, 0:00 (www.ropbox.com). As training set, for this data set, we used measurements of wind speed for 144 periods (1-4 January), and last 48 (5 January) intervals as testing set. Figure 3 shows the spatial position of sensors and respective time series.
The fifth data set of our experimentation refers to 6477 sensors installed in South America, called South America Air Climate (SAC) collecting monthly-measures (144 snapshots - 12 years) - of air temperature. We applied our algorithm STClu-Arima for one part of these sensors (900 sensors). As training set, for this data set, we used measurements of temperatures from January 1999 - December 2010, and last 12 month (January - December 2011) for testing set.
4.2. Experimental MethodologyFor determination of the optimal number of the clusters, we used average silhouette width. Average silhouette width refers to a method of interpretation and validation of clustered data. The technique provides a concise graphical representation of how well each object lies within its cluster.
The average silhouette width measured how tightly are grouped all the data in the cluster are how appropriately has been clustered the data. If there are too many or too few clusters, as may occur when a poor choice of k is used in the k-means algorithm, some of the clusters will typically display much narrower silhouettes than the rest. Thus, silhouette plots and averages may be used to determine the natural number of clusters within a data set.
For Eco-Texas data set, on a bases of calculated spatio-temporal distance measure we applied k-means clustering method for all 26 sensors and tried all possible solutions begging with l=2, l=3, until l=25 clusters. Then, for all clusters, we calculated average silhouette width.
For Eastern-Wind and SAC data sets, selection of the optimal number of clusters was much more difficult because this two data sets have 1326 and 900 sensor stations, and we tried to choose the optimal number of cluster beginning with k=10 until k=100 with step 10.
We selected as the optimal number of clusters where average silhouette width obtained the local maximal values.

 PowerPoint Slide
 Larger image(png format)
 PowerPoint Slide
 Larger image(png format)
Second step of our algorithm, for all time series in the cluster applied STClu-Arima algorithm and calculating rmse. Then we compare rmse for STClu-Arima vs auto.ARIMA.
To estimate the accuracy of STClu-Arima vs auto.ARIMA (prediction and efficiency of proposed learning model), we applied Wilcoxon signed rank test for selected number of clusters for all five data set. We compared STClu-Arima models with ”auto.ARIMA”, that learns separate ARIMA models for each station choosing the best parameters according to minimal average AICc. For all data set, STClu-Arima used spatial positions of the transmitting sensor stations (the latitude and longitude), while auto.ARIMA do not.
4.3. Discussions of the ResultsIn the Table 1 we reported the result of our experiments. The first column shows the title of data set, while second column shows average silhouette width for selected number of clusters. The column 3-7 reports the results of comparative analysis STClu-Arima vs auto.ARIMA, for the testing data set. These columns show the results of analysis of statistical significance tests (pair wise Wilcoxon signed rank test) comparing squared residuals of the paired test time-series. The columns 3-7 reports the number of stations where STClu-Arima performs (statistically) better (columns 3-4), worse (columns 5-6), equal (column-7) than auto.ARIMA. (+) means how many times STClu-Arima performs better than auto.ARIMA (i.e. WT + $>$ WT-), (-) means that auto.ARIMA performs better than STClu-Arima (i.e. WT+ $<$ WT-), (=) means that both algorithms perform equally good (i.e. WT+ $=$ WT- ). (++) and (--) indicate results in case $H_0$ (hypothesis of equal performance) is rejected at the 0.05 significance level ARIMA (auto.ARIMA) against STClu-Arima (RMSE).
Figure 6(a) shows the results of rmse STClu-Arima versus auto.ARIMA for Eco-Texas(Wind), while the Figure 5(a) shows spatially location of clustered sensor station measuring similar spatio-temporal values.
The figures 6(b) and 6(c) reports the comparing results of rmse for Eco-Texas(Temperature) and Eco-Texas(Ozone) data set.
The fourth rows of the Table 1 indicates the results obtained for Eastern-Wind dataset for 30 clusters, while the Figure 7(a) shows the results of rmse STClu-Arima vs auto.ARIMA for the same data set. The Figure 5(b) shows spatially clustered Eastern-Wind sensor stations.
The fifth row of the Table 1, indicates the results of the pair wise Wilcoxon signed rank test, based on rmse for SAC dataset for SAC data set for 90 clusters. The Figure 7(b) shows the results of rmse STClu-Arima vs auto.ARIMA for the same data set, while the Figure 5(c) represents spatially clustered station.
This experimentation computed run time (in seconds) for both steps of our algorithm and for all five data set.

 PowerPoint Slide
 Larger image(png format)
 View current table in a new window
 PowerPoint Slide
 Larger image(png format)
 View current table in a new window
Table 2 reports run time for all performed operations:
run time to perform auto.ARIMA (column 2),
• the run time for computing spatio-temporal distance matrix (column 3);
• the run time for appling statio-temporal clustering (column 4);
• the run time for computation of STClu-Arima algorithm (column 5).
• We compare computation run time obtained from auto.ARIMA for the training time series that calculate the best forecasting parameters independently from spatio-temporal correlation of time series.
• The run time spent in learning the prediction model of the function auto.ARIMA and STClu-Arima are reported (for all dataset) in Table 2 - Eco-Texas (Wind) - row 2, Eco-Texas (Temperature) - row 3, Eco-Texas (Ozone) - row 4, Eastern-Wind - for 30 (rows 5), and SAC (row 6).
• The first column (AA-Tra) shows the computation run time for training set applying auto.ARIMA; second column column (STDist) shows the computation run time for calculating spatio-temporal matrix; the thirt column (STClu) shows the computation run time for applying k-means clustering, while last fourth column (STClu-Arima) account computation run time for applying STClu-Arima algorithm.
• Presented procedure shows that taking into account spatio-temporal distance measure by clustering stations that measured similar data in space and time; we obtained better results optimizing the choice of the forecasting parameters for the computation of the model ARIMA.
• Presented procedure shows that taking into account spatio-temporal distance matrix by clustering stations that measured similar data in space and time, we obtained better results optimizing the choice of the forecasting parameters for the computation of the model STClu-Arima. The number of stations where STClu-Arima performs better or equally than auto.ARIMA is always greater than the number of stations where auto. ARIMA overreach STClu-Arima.

 Spatially clustered sensor stations of Eco-Texas(Wind) in 7 clusters that measure similar spatio-temporal values. (b) Spatially clustered sensor stations of Eastern-Wind in 30 clusters (c) Spatially clustered sensor stations of SAC in 90 clusters) PowerPoint Slide
PowerPoint Slide Larger image(png format)
 RMSE for auto. ARIMA vs STClu-Arima for Eco-Texas (Temperature) for 5 clusters. (b) RMSE for auto.ARIMA vs STClu-Arima for Eco-Texas(Wind) for 7 cluster. (c) RMSE for auto.ARIMA vs STClu-Arima for Eco-Texas (Ozone) for 4 clusters) PowerPoint Slide
PowerPoint Slide Larger image(png format)
 RMSE auto.ARIMA vs STClu-Arima for Eastern-Wind data set for 30 cluster. (b) RMSE auto.ARIMA vs STClu-Arima for SAC data set for 90 clusters) PowerPoint Slide
PowerPoint Slide Larger image(png format)
5. Conclusions and Future Work
This paper described a two-stepped algorithm that accounted for the spatio-temporal correlation of geo-referenced time series. The first step proposed a new approach to compute spatio-temporal k-means cluster on a bases of the spatio-temporal distance measure STDist. STDist measure combined Euclidean distance for spatial distance and smoothing data for temporal dimensions. This way, k-means cluster method has taken into consideration both, spatially near and temporally similar time series.
Second step applied a new inference procedure called STClu-Arima, implemented in software R. STClu-Arima has computed the best forecasting parameters valid for each time series in the cluster, by applying the global triple (p, d, q) for all each time series in the cluster, to the testing set and obtained more efficient and more accurate prediction results.
For case studies, we took five real data set investigating the viability and accuracy of proposed algorithm in a real world forecasting application. We also compared obtained STClu-Arima forecasting results against results of function auto.ARIMA (already implemented in software R), that determined the best forecasting parameters for all time series, independently one from other in space and time. In general, our experiments proved that proposed model STClu-Arima, outperforms auto.ARIMA.
For future work, we are planning to investigate multivariate time series and to extend our analysis of hybrid forecasting methods.
References
| [1] | Guillermo, Q. D. J., Salas, T., A comparative analysis of techniques for spatial interpolation of precipitation. JAWRA Journal of the American Water Resources Association, Volume 21, Issue 3, pages 365-380, June 1985. | ||
 In article In article | |||
| [2] | Bacchi, B., Kottergoda, N.T., Identification and calibration of spatial correlations patterns of rainfall. Journal of Hydrology, 165: 311-348.1995. | ||
| In article | |||
| [3] | Rodriguez-Iturbe, I., Mejia, J. D., The design of rainfall networks in time and space. Water Resources Research, 10:713-728.1974. | ||
| In article | |||
| [4] | Solna, K., Switzer, P. Time trend estimation for a geographic region. Journal American Statistical Association, v. 91, no. 434, p. 577-589. 1996. | ||
| In article | |||
| [5] | Andrienko, G., Andrienko, N., Interactive cluster analysis of diverse types of spatiotemporal data. ACM SIGKDD Explorations. 2009. | ||
| In article | |||
| [6] | Pravilovic, S. Appice, A, Malerba, D., An Intelligent Technique for Forecasting Spatially Correlated Time Series. AI-IA, 2013. | ||
| In article | |||
| [7] | Sershenfeld, N. A., Weigend, A. S. G., The future of time series. In A. N. Gershenfeld and A. S.Weigen, editors, Time Series Prediction: Forecasting the Future and Understanding the Past, pages 1-70, 1993. | ||
| In article | |||
| [8] | Brockwell, P.,Davis, R., Time Series: Theory and Methods. Springer, 2nd edition, 2009. | ||
| In article | |||
| [9] | Hyndman, R., Khandakar Y., Automatic time series forecasting: The forecast package for r. Journal of Statistical Software, (26(3)), 2008. | ||
| In article | |||
| [10] | Box, G. E. P., Jenkins, G. M.. Time Series Analysis: Forecasting and Control. Prentice Hall PTR, Upper Saddle River, NJ, USA, 3rd edition, 1994. | ||
| In article | |||
| [11] | Canova, F., Hansen, B. Are seasonal patterns constant over time? a test for seasonal stability. Journal of Business and Economic Statistics, (13):237-252, 1995. | ||
| In article | |||
| [12] | Kwiatkowski, D., Phillips, P., Schmidt P., Shin, Y., Testing the null hypothesis of stationarity against the alternative of a unit root. Journal of Econometrics, (54):159-178, 1992. | ||
| In article | CrossRef | ||
| [13] | Kyriakidis, P. C., Journel, A. G., Geostatistical space-time models: A review. Mathematical Geology, 1999. 31: 651-684. | ||
| In article | CrossRef | ||
| [14] | Birant, D., Kut, A, .ST-DBSCAN: An algorithm for clustering spatial–temporal data, Data&Knowledge Engineering 60 (2007) 208-221. | ||
| In article | CrossRef | ||
| [15] | South American Air Climate Data. http://climate.geog.udel.edu/climate/html-pages/sa air clim.html | ||
| In article | |||

 CiteULike
 Delicious

