The aim of the study is to model pneumonia cases using Markov Chain. Secondary data on monthly pneumonia cases spanning January, 2015 to December, 2020 was obtained from Builsa North Municipal hospital. Descriptive statistics of the data revealed the minimum and maximum number of pneumonia cases were 9 and 370 respectively with an approximate mean of 121. The data was classified into Low, Moderate and High states based on quartiles of the dataset. The analysis with the aid of R software revealed that, the transition probability of remaining in the low, moderate and high states were 61.10%, 62.9% and 50% respectively, but the probability of transitioning from the low state to the moderate and high states were 33.30% and 5.60% respectively. Also, in the long-run there will be higher chances of recording moderate pneumonia cases with a probability of approximately 51% as compared to 26% and 23% for low and high states respectively. Again, the estimates for Mean Recurrence Time for the low, moderate and high states were 4, 2 and 4 months, respectively and their respective sojourn times were 3, 3 and 2 months. The estimated first passage time probabilities also revealed that when low pneumonia cases are observed in the first month, there is higher probability of low pneumonia cases being observed in the next month. The analysis also revealed that it will take the states twenty-eight (28) months to be in equilibrium and in the long-run the municipality will record, on average, approximately 117 pneumonia cases monthly.
Pneumonia is an infection of the lungs that causes inflammation in the alveoli making it fill with fluid resulting in difficulty in breathing and limits oxygen intake and affects one or both lungs 1. It is a contagious disease and a leading cause of death in the world among children below five years of age 2. It kills an approximated number of 1.4 million children below the age of five years, accounting for about 18% of all children’s deaths under five years old worldwide 3. According to 4 there are about 120 million cases of pneumonia in children below five years per year and about 14 million progresses to severe cases. Also, 5 states that pneumonia causes death of children and families everywhere, but it is most prevalent in sub-Saharan Africa and South Asia. Furthermore, 6 has indicated that older people have higher risk of getting pneumonia and are more likely to die from it. Ventola indicated further that in the United States, pneumonia is the most common cause of hospitalization in adults and that about one million adults seek care in hospitals every year and about 50,000 dies from this disease. According to 7, despite progress against pneumonia, over 800,000 children still die from it every year. However, by 2017, this number decreased by almost two-thirds due to enhancements in the major risk factors such as childhood wasting, falling global poverty, poor sanitation, air pollution and a better availability of health technology such as antibiotics and pneumococcal vaccines.
There are three types of pneumonia based on the causative pathogen which include; fungal pneumonia, bacterial pneumonia and viral pneumonia 8. It is transmitted when germs from infected person spread to another person either through inhaling infected particles from coughs and sneezes of an infected person, when a person touches an infected surface or when an infected person coughs into his or her hand and then shakes an uninfected person who touches the mouth or eyes without washing 9. Anyone can get pneumonia, however those with high risk of getting infected include; children less than 5 years of age, people 65 and above years of age and individuals with other medical conditions such as diabetes, respiratory diseases, malnourishment and immune deficiency disorders. Smoking and alcoholism which reduces amount of white blood cells count in the bloodstream are also factors 10. While most healthy children can fight the infection with their natural defenses, children with compromised immune systems as a result of malnutrition, especially due to insufficient breastfeeding and pre-existing illness such as measles increases a child’s risk of contracting pneumonia 1.
In Ghana, pneumonia is rated as the leading cause of morbidity and mortality with an annual death record of 16,200 children, accounting for 20% of deaths per year 11. The statistics is alarming and so there is the need for the reversal of the trend. This study therefore, seeks to model monthly pneumonia cases in Ghana using three-state discrete-time Markov chain, using Builsa North Municipality as a case study. Other authors such as 12, 13, 14, 15, 16 have also applied Markov chain in various disciplines of natural science, engineering, economics and management. The findings of this study can help policy makers institute appropriate intervention measures to minimize the prevalence of pneumonia in the Builsa North Municipality in particular and the country as a whole.
Secondary data on monthly pneumonia cases from January 2015 to December 2020 were obtained from the Builsa Municipal hospital.
2.2. Statistical Methods and Tools UsedDescriptive statistics of the data indicated the presence of over dispersion (where variance > mean) in the dataset, and so, the negative binomial (NB) regression was used, instead of the Poisson, to explore the effect of the months on the pneumonia cases since NB can directly estimate incidence rate ratios (IRR) from count data while accommodating over dispersion. If  is the monthly pneumonia cases at month t and the months are treated as categorical predictor with one month as reference (say January), then the Negative Binomial Regression model will be written with dispersion parameter
 as
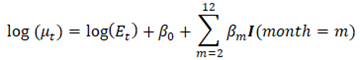
as 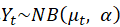 with the log-linear predictor written as
 | (1) |
Where  is the exposure at month t (population at risk
  duration of the time unit, 1 month);
  are
are
dummy indicators for months 2, 3, . . . , 12 (if month 1 is reference);  gives the log IRR of month m compared with the reference month;
  is the incidence rate ratio (IRR) for month m versus reference.
Time series plot was also employed to ascertain the trend of the pneumonia cases over the period of the study. The monthly pneumonia cases were modeled using the first discrete-time Markov chain analysis. R software and Excel were used for the analysis.
A Markov chain is a stochastic model describing a sequence of possible events in which the probability of each event depends on the state of the previous event. Markov chain can be of first, second or higher orders. This chain possesses the memory-less property, which states that the probability of the next state of a system is only dependent on the present state of the system and not on any prior states 17. A discrete-time process  is said to be a Markov chain if for all
  the following holds:
 | (2) |
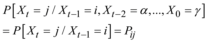
Where  is known as state transition probability, which is a conditional probability that the process will be in state j at time t given that the process is in state i at time t-1. Thus, the current
state is sufficient to determine the next state. A homogenous Markov chain is one in which the transition probabilities are independent of time and thus, its transition probability is defined as
 | (3) |
and  holds for all times. The homogeneous transition probability satisfies these conditions;
 and
and  . This follows that the states are mutually exclusive and exhaustive.
The MLE method was used to estimate the transition probabilities,  , which is, the conditional probability that a process will be in state j given that it is in state i. For a given initial state i and a number of trials
 , the sample of transition counts,
  can be considered as a sample of size
  from a trinomial distribution with probabilities
  and
and  such that
  18. The probability of this outcome can therefore be given as;
 | (4) |
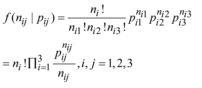
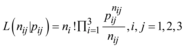
The likelihood of the transition Probabilities,  follows a trinomial distribution given by;
 |
and the loglikelihood will therefore be given by
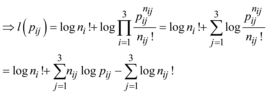 |
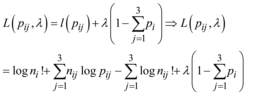
Maximizing  using Lagrange multiplier with the constraint
  then,
then,
 |
Taking partial derivative with respect to  and equating to zero,
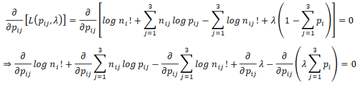 |
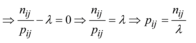 |
Now applying the constraint


Substituting back, we obtain: 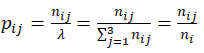 (5)
(5)
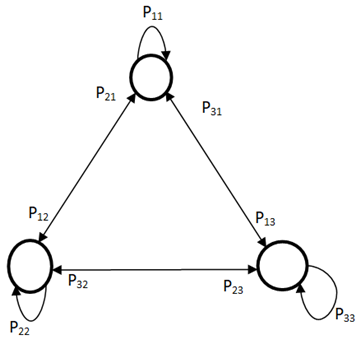
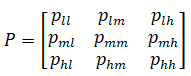
For a Markov chain of  states with transition probabilities
 ,then the transition probability matrix will be
 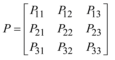 which must satisfy
  and
and  for
for  (Ibe, 2014). The corresponding transition diagram is shown in Figure 1 where the states are represented by circles and the transitions by arrows.
An n-step transition probability  is the conditional probability of a system moving to state j after n transitions given that it is currently in state i, is provided for by Chapman-Kolmogorov equations defined as follows;
 | (6) |
From the principle of total probability, for any
  and
and  (7)
(7)
Equation (6) implies that the probability of going to state j from state i after the  transition is the product of the probability of first going from state i to an intermediary state k after m transitions and from state k to state j after (n-m) transitions. The summing is done over all possible k states. For limiting state transition probability, if P is the transition probability matrix of a Markov chain,
  ,. Then, the nth transition probability matrix, is defined as
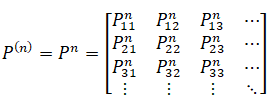 | (8) |
When  , the Markov chain becomes stationary where the state probabilities do not change with n any longer. If the limit of the chain exists, then the limiting state probability is given by;
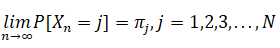 | (9) |
If the limiting state probabilities exists without depending on the initial state, then,
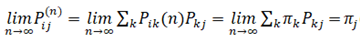 | (10) |
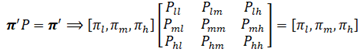
Equation (9) can be interpreted as the long-run probabilities that the process is in state j. If 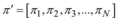 denotes the limiting-state probability vector, then the
 ;
;  and
and  holds.
The expected time of stay of a process in a given state is referred to as sojourn time. If for state i with  being the probability of the process remaining in the state for d time units and the random variable
  is the number of time units the process remains in state i before leaving it, given that the process enters the state, then the probability mass function of
  is defined as
 | (11) |
where  represents the probability that the sequence remains unchanged d-1 times before changing. Since the random variable
  is geometrically distributed, then the expected sojourn time of the process in state i is defined as
 | (12) |
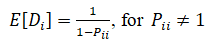
However, if the state i is an absorbing state, then  and
and  .
.
The FPT probability denoted by  is the conditional probability that, the first time a process enters state j occurs in just n transitions, given that the process is currently in state i. Thus, the probability of first passage from state i to state j is defined by 19 as
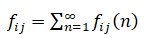 | (13) |
The MRT for a recurrence state i, is defined as the reciprocal of the stationary probability which can also be interpreted as the average time it takes for the chain to return to state i given that it was initially in state i and it is given by;
 | (14) |
where  is the stationary probability of being in state i. If i is transient,
  is considered infinite.
Consider a Markov chain with  states. If the limiting state probability vector and the mean values of the various states of the chain are, respectively,
  and
and 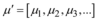 , then the long-run expected value of the chain is defined as
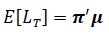 | (15) |
The monthly pneumonia data collected from the Builsa Municipal hospital were grouped into three states as low (L), moderate (M) and high (H) based on the computed values of the first quartile (Q1) and upper quartile (Q3) of the pneumonia dataset. Monthly recorded cases less than or equal to the Q1 were considered low, moderate for cases between the Q1 and Q3 and high for cases greater than or equal to the Q3.
The Chi square test of independence was used to verify whether the three states of the pneumonia cases satisfy the first-order Markov chain assumption before proceeding with the analysis. The assumption states that the future state of pneumonia cases depends only on its current state and that the transition probabilities are independent of time. The set hypothesis was;
 : the first order Markov chain assumption does not hold for the data on monthly pneumonia cases
 : the first-order Markov chain assumption holds for the data on monthly pneumonia cases
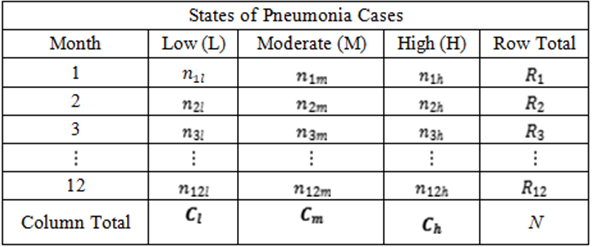
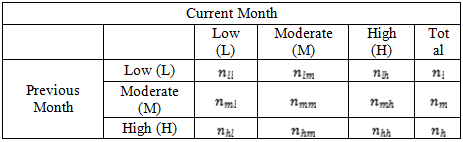
Table 1 below presents how the monthly pneumonia cases will be laid out. The entries  representing the number of pneumonia cases in the
  month belonging to the
  state. We compared the estimated p-value to the
  and reject
  if p-value <
 and accept
  if otherwise.
The state space for the Markov Chain is S = L, M, H with the assumption that the state of pneumonia cases for the next month is expected to depend only on the state of the pneumonia cases in the current month. The observed frequency of pneumonia cases  from state i to state j and
  are presented in Table 2.
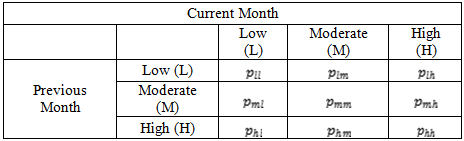
The transition probabilities,  for the various states were then estimated using (4) and the results will be displayed as in Table 3.
The transition probability matrix can therefore be written as below
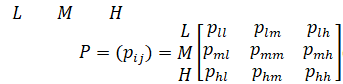 | (16) |
where and
and  is the probability of monthly pneumonia cases being in the
  state given that it was in
  state.
If the long-run probabilities of low, moderate and high pneumonia cases are  and
and , respectively, then (17) below holds;
 | (18) |
where  (Raheem et al, 2015).
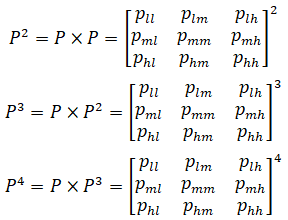
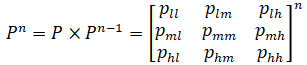
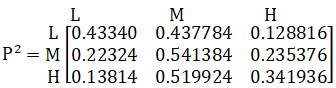
Let P be the transition probability matrix of the low, moderate and high states, then the matrix after the nth transition pn can be obtained by multiplication as follows;
 |
 |
 |
If after the nth transition, the rows of the matrix become the same and does not change with n anymore, then  is the stationary (equilibrium) transition probability matrix.
Let  and
and  represent the steady state probabilities and the expected values of the low, moderate and high states of the pneumonia cases. The average pneumonia cases in the long-run,
  will be estimated as
 (19)
(19)
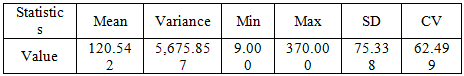
Table 4 displays the mean, variance, minimum, maximum, standard deviation (SD) and coefficient of variation (CV) of the pneumonia cases recorded in the Builsa North Municipality during the period under study. It can be seen that the minimum and maximum number of pneumonia cases are 9 recorded in August and 370 recorded in March, respectively, with an overall approximate mean and variance of 121 and 5,676, respectively. Since the variance is greater than the mean, it suggests the presence of over-dispersion in the monthly pneumonia dataset.
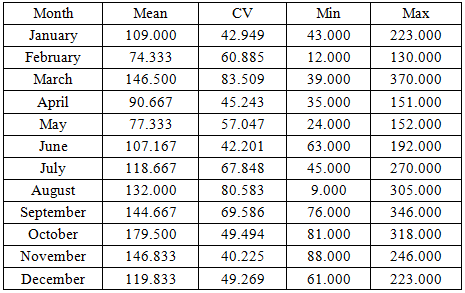
Table 5 displays the monthly descriptive statistics. Comparing the means of the monthly recorded cases from January to December, February recorded the least mean of approximately 75 and the month of October recorded the highest mean of 180 followed by the months of March and November each recording the mean of approximately 147. Also, March had the highest variability followed by August while November had the lowest variability of pneumonia cases as shown by their coefficient of variations.
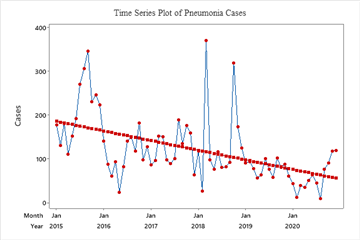
The time series plot of pneumonia cases is shown in Figure 2. It can be seen that pneumonia exhibited an increasing trend from May, 2015 to September, 2015 and thereafter, started to sharply decline to March, 2016. Again, there were fluctuations from April, 2016 till February, 2018. It increased in March, 2018 and dropped sharply in April, 2018. Fluctuations were then noticed thereafter but increased in October, 2018 and started to decline till January, 2019. It remained stable but fluctuates thereafter till December, 2020. Thus, the graph generally indicates a decreasing linear trend of the pneumonia cases over the period of study from 2015 to 2020.
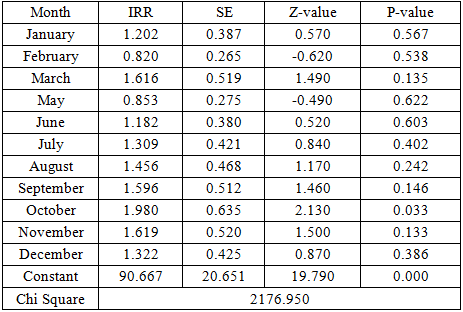
To explore the effect of the months on the pneumonia cases, the negative binomial regression model was fitted since the monthly pneumonia count dataset exhibited the presence of over dispersion. The results of the fitted negative binomial regression are displayed in Table 6 which presents the estimates of the effect of the months on the incidence rate ratios (IRR) of pneumonia cases with April as the reference month. April was used as the reference month because April marks the end of the dry season and as well the beginning of the rainy season in the Builsa North Municipality. The p-values revealed that only the month of October was significant with reference to the month of April. Also, when other months are held constant, the pneumonia cases incidence rates were expected to increase for all the Months with the exception of February and May as compared to the month of April. October had the highest expected incidence rate of pneumonia cases since it was expected to have 1.98 times greater pneumonia incidence rate compared to that of April. The overall goodness of fit test was tested using the likelihood ratio test which tests whether the months are really significant in explaining the IRR. We can conclude that the months collectively explain the variations in the rates since the likelihood ratio chi square test value of 2,176.950 (indicated at the bottom) is large.
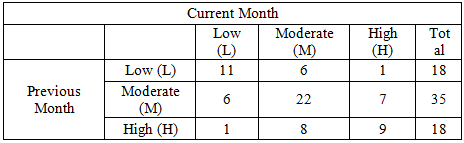
The Low (L), Moderate (M) and High (H) states were identified using the first and third quartiles of the pneumonia dataset. A low state was defined as a state of months of pneumonia cases less than or equal to the first quartile (approximately 76) whilst cases greater than or equal to the third quartile (approximately 152) were defined as high and finally, cases recorded between the 76 and 152 were defined as moderate. The transition frequencies from one state to another of pneumonia cases were observed and compiled.
The observed transition frequencies between the three states of the pneumonia cases are presented in Table 7. The entries in the table denote the number of pneumonia cases that are in a particular state in the current month given that the pneumonia cases were in a particular state in the previous month. For instance, it can be seen that, given that the pneumonia cases were in the low state in the previous month, the transition frequencies with which the cases will make to the current month in the low, moderate and high states were 11, 6 and 1, respectively. Other rows in the table can be interpreted appropriately in a similar fashion. It can therefore, be deduced from Table 7 that when low pneumonia cases are recorded in the previous month then, there is high possibility that low pneumonia cases will be recorded in the current month. Also, when moderate pneumonia cases are recorded in the previous month then there is a high likelihood that moderate pneumonia cases will be recorded in the current month and when high pneumonia cases are recorded in the previous month then, there is high likelihood that high pneumonia cases will be recorded in the current month. Therefore, when measures are put in place to reduce pneumonia cases to the low state then, there is high probability of recording low pneumonia cases.
The first-order Markov chain assumed that the state of pneumonia cases for the next month is expected to depend only on the state of the pneumonia cases in the current month. The pneumonia dataset was tested to investigate whether this assumption holds for the three states by performing chi square test of independence. Using the data in Table 7, the computed chi square test statistic yielded a value of 22.44 with p-value of 0.0000, indicating that the first-order Markov chain assumption holds for the states of the pneumonia cases.
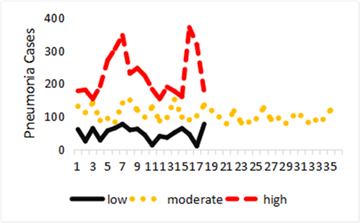
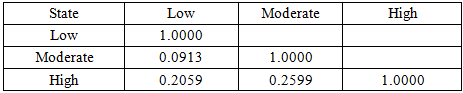
The correlation between the low, moderate and high states of the pneumonia cases was investigated using correlation coefficients as shown in Table 8 below. It can be seen that there exists positively weak correlation between the states since their correlation coefficients ranges from 0.1 to 0.3 approximately. This means that an increase in pneumonia cases in a state does not necessarily leads to an increment of pneumonia cases in another state.
The pattern of correlation between the low, moderate and high states of the monthly pneumonia cases is shown by Figure 3. It can be seen from the figure 3 that an increment or decrement in any of the states shows no significant change in the other states.
The transition probabilities,  were estimated using (4), where
  is the number of pneumonia cases in the
  state given that it was in state; and
  = total number of pneumonia cases in the
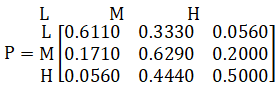
  state. Using the information in Table 7, the transition probability matrix P can be extracted from the calculated transition probabilities of the pneumonia cases from one state to another as follows:
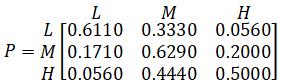 |
It can be seen for instance that the transition probability of remaining in the low, moderate and high state of pneumonia cases were 61.10%, 62.9% and 50% respectively. Also, the probability of transitioning from the low state to the moderate and high states were 33.30% and 5.60%, respectively. Similarly, it can be inferred that there is high probability of remaining in a particular state of the pneumonia cases than moving to a different state. This means that if preventive measures of pneumonia are adhered to reduce the prevalence of pneumonia cases, then the likelihood of pneumonia cases remaining low would be high. It is therefore prudent for stakeholders to create awareness of the lethal impact of pneumonia as well put in place appropriate preventive measures so as to reduce pneumonia cases in the Builsa North municipality.
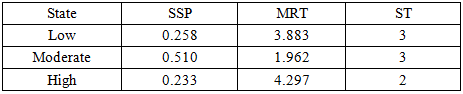
Table 9 shows the estimated values of the Steady State Probabilities (SSP), Mean Recurrence Time (MRT) and Sojourn Time (ST) for the three states. The SSP values indicate that in the long-run, there are higher chances of pneumonia cases to be in the moderate state than the low and high states. Also, the MRT values show that it takes approximately 4, 2 and 5 months for pneumonia cases to return to the low, moderate and high states after leaving those states. Furthermore, from the estimated ST values, the length of time pneumonia cases is expected to stay in the low and moderate states were estimated to be approximately 3 months each and 2 months for the high state. Hence the complete cycle of the pneumonia cases in the Builsa North municipality was estimated to be 8 months.
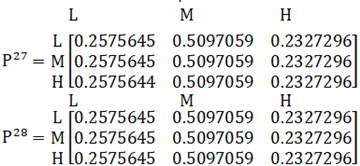
It was known from the estimation that it will take the states at least twenty-eight (28) months to be in equilibrium with estimated probabilities for the low, moderate and high states as 0.2575645, 0.5097059 and 0.2327296 respectively.
|
|
|
|
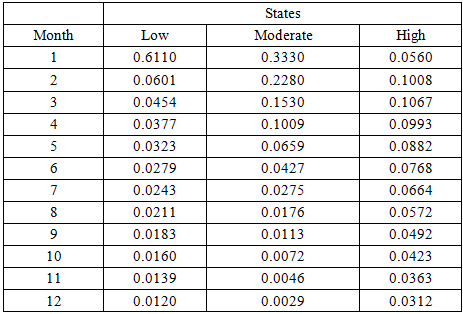
The FPT probabilities for the low, moderate and high states assuming the cases are in the low state were estimated and the results are displayed in Table 10. It can be observed for instance that if low pneumonia cases are observed in the first month, then the probability of observing low, moderate and high pneumonia cases in the next month will be 0.6110, 0.3330 and 0.0560, respectively. This implies that assuming low pneumonia cases are observed in the first month then, there is higher probability of low pneumonia cases being observed in the next month. It can generally be observed that from the first to the fourth months when low pneumonia cases are observed then there is high probability of observing moderate pneumonia cases in the next month than observing high pneumonia cases and from the fifth to the twelfth months there is high probability of observing high pneumonia cases than moderate pneumonia cases. This finding could be attributed to the fact that the first to fourth months constitutes the hot season and from fifth to the tenth month constitutes the rainy season and from the eleventh to twelfth months onward constitutes the harmattan season characterized by coldness and mosquito-borne infections in the municipality.
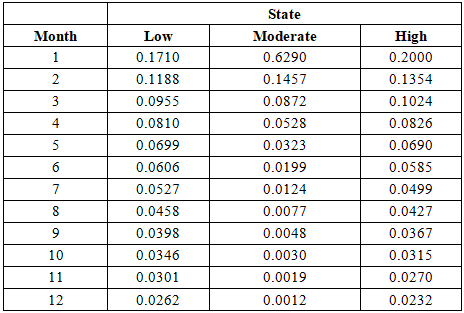
The FPT probabilities for the low, moderate and high states were also estimated assuming the cases are in the moderate state and the results are displayed in Table 11. It can be seen, for instance, that in the first month, given that the current pneumonia cases are in the moderate state, the probability of observing low, moderate and high pneumonia cases in the next month will be 0.1710, 0.6290 and 0.2000, respectively. This implies that when current pneumonia cases in the first month are moderate, then there is higher probability of having moderate pneumonia cases in the next month than low and high pneumonia cases in the municipality. It can generally be observed that when current pneumonia cases are moderate, then there is high probability of observing high pneumonia cases than low pneumonia cases in the next month from the first to the fourth months, whilst from the fifth to the twelfth months the likelihood of observing low pneumonia cases is higher than observing high pneumonia cases.
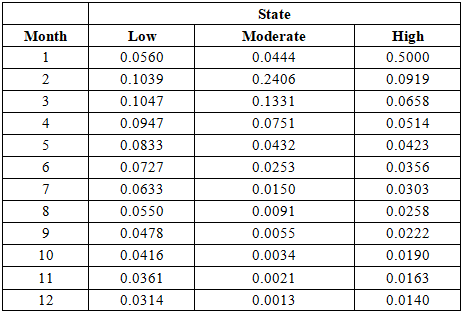
The FPT probabilities for the low, moderate and high states assuming the cases are in the high state were also estimated and the results are displayed in Table 12. It can, for instance, be seen that, given that the current pneumonia cases in the Builsa North Municipality are high, the probability of observing low, moderate and high pneumonia cases in the next month will be 0.0560, 0.04440 and 0.5000, respectively. This means that in the first month there is higher probability of recording high pneumonia cases in the municipality in the next month given that the municipal currently has high pneumonia cases. It can generally be observed in the Table 12 that, with the exception of the second and third months, there is high probability of observing low pneumonia cases than moderate pneumonia cases in the next month in the municipality when pneumonia cases are in the high state.
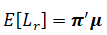
The estimated long-run (steady state) probabilities vector of the three states of the pneumonia cases is 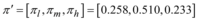 and that of the mean vector is
 . Therefore, the expected number of pneumonia cases in the municipality in the long-run was estimated as
 . This implies that the Builsa North Municipality in the long-run would record an average pneumonia case of approximately 117 monthly.
The main objective of the study was to model the pneumonia data using the first-order Markov chain modeling. Descriptive statistics of the data revealed that the minimum and maximum number of pneumonia cases were 9 and 370, respectively. The mean and variance were approximately 121 and 5,676, respectively, suggesting the presence of over-dispersion. As a result, the negative binomial regression model was fitted to explore the effect of the months on the incidence rate ratios (IRR) of pneumonia cases using April as the reference. The fitted model revealed that only the month of October was significant and when all other months are held constant. The pneumonia cases incidence rates were expected to increase for all the Months with the exception of February and May. Also, the time series plot of Malaria cases revealed a decreasing non-seasonal trend of the pneumonia cases over the period of study. The chi square test of independence confirmed that the pneumonia data satisfied the first-order Markov chain assumption.
The data was classified into Low (L), Moderate (M) and High (H) states based on quartiles of the dataset. The analysis revealed that, the transition probability of remaining in the low, moderate and high states were 61.10%, 62.9% and 50%, respectively. However, the probability of transitioning from the low state to the moderate and high states were 33.30% and 5.60% respectively. Also, the probabilities of moving from the moderate state to the low state and from the high state to the low state were 17.10% and 5.60% respectively. The study also discovered that in the long-run there will be higher chances of recording moderate pneumonia cases in the municipality with a probability of approximately 51% as compared to low and high pneumonia cases with probabilities of 26% and 23% respectively.
Furthermore, the Mean Recurrence Time revealed that it takes the pneumonia cases shorter time to return to the moderate state than to the low and high states. Also, the expected length of time pneumonia cases will stay in the low and moderate states were estimated to be approximately 3 months each and 2 months for the high state. The estimated first passage time probabilities also revealed that when low pneumonia cases are observed in the first month, there is higher probability of low pneumonia cases being observed in the next month. Moreover, it will take the states twenty-eight (28) months to be in equilibrium and in the long-run the municipality will record on average approximately 117 pneumonia cases monthly.
From the findings of the study, the following recommendations are made;
i. Since there is high probability of pneumonia cases being in the same state as its current state, it is recommended that adequate attention be given to pneumonia by the government and other agencies by putting in place more efficacious measures and ensuring their adherence to minimize pneumonia cases in the municipality and the country at large.
i i. Also, public health education be organized to create awareness of the lethal impact of pneumonia especially on children so as to intensify compliance in order to minimize the prevalence of pneumonia infections.
i i i. Women should be encouraged to practice exclusive breast feeding and reducing malnutrition, especially in under-5 children, which weakens immunity.
iv. Reducing overcrowding in rooms and improving ventilation indoors, especially during rainy or cold seasons.
v. Community health workers should be properly trained to identify and refer pneumonia cases early.
vi. Policy makers in the health sector should always work with routine data (e.g., monthly incidence, seasonal peaks) to anticipate outbreaks and allocate resources.
vii. Furthermore, future studies can consider other states such as susceptibility, infection and recovery states of pneumonia as well as gender in estimating the relevant metrics of pneumonia
viii. Future studies should consider other statistical models to estimate relevant epidemiological quantities of pneumonia and comparisons made to ascertain which one would be most appropriate.
The authors have no competing interests (financial or others) to disclose.
| [1] | World Health Organization, “Pneumonia”, 2019 . https:// www.who.int/ news-room/ fact-sheets/ detail/ pneumonia. [Accessed Dec. 6, 2020]. | ||
| In article | |||
| [2] | Le Roux, D. M., Zar, H. J “Community-acquired pneumonia in children—a changing spectrum of disease”, Pediatric radiology, 47, 1392-1398, 2017. | ||
| In article | View Article PubMed | ||
| [3] | Mhandu, E, Building a low-cost biomedical device to improve accuracy in pneumonia diagnosis in under five children. Dissertation, Ashesi University. 2019. | ||
| In article | |||
| [4] | Lassi, Z. S., Imdad, A. and Bhutta, Z. A, “Short‐course versus long‐course intravenous therapy with the same antibiotic for severe community‐acquired pneumonia in children aged two months to 59 months”, Cochrane Database of Systematic Reviews, 2017. | ||
| In article | View Article PubMed | ||
| [5] | Pant, A., Jain, A., Nayak, K.C., Gandhi, D. and Prasad, B.G “Pneumonia detection: An efficient approach using deep learning”, In 2020 11th International Conference on Computing, Communication and Networking Technologies (ICCCNT) IEEE - 49239. | ||
| In article | View Article PubMed | ||
| [6] | Ventola, C. L, “Immunization in the United States: recommendations, barriers, and measures to improve compliance”, Part 1: childhood vaccinations. Pharmacy and Therapeutics, 41:426-436, 2016. | ||
| In article | |||
| [7] | Swedberg E, Shah R, Sadruddin S, Soeripto J (2020) Saving young children from forgotten killer: pneumonia.Am J Physiol Lung Cell Mol Physiol. | ||
| In article | View Article PubMed | ||
| [8] | Jill, S.S. (2018). Why pneumonia can be deadly for some people. https://www.healthline.com/health/pneumonia/can-you-die-from-pneumonia#risk.[Accessed Dec. 10, 2020]. | ||
| In article | |||
| [9] | Zawn, V, (2017). “Is Pneumonia contagious? Causes and Transmission” MedicalRecords.com. [AccessedNovember 25, 2020]. | ||
| In article | |||
| [10] | Backhaus, E., Berg, S, Andersson, R., Ockborn, G., Malmström, P., Dahl, M., ....and Trollfors, B, “Epidemiology of invasive pneumococcal infections: manifestations, incidence and case fatality rate correlated to age, gender and risk factors”, BMC infectious diseases, 16,1-12, 2016. | ||
| In article | View Article PubMed | ||
| [11] | Iddrisu, A. K., Alhassan, A. and Amidu, N,“ Survival analysis of birth defect infants and children with pneumonia mortality in Ghana”, Hindawi Advances in Public Health, 1-7, 2019. | ||
| In article | View Article | ||
| [12] | Datong, G.M,“A Markov Chain Model Analysis of GSM Network Service Providers of Marketing Mix”, International Journal of Engineering & Technology IJET-IJENS, 11(04), 38 – 43, August 2011. | ||
| In article | |||
| [13] | Kassa, A.M., Abrham, E. and Seid, T.“Application of Markov Chain Analysis Model for Predicting Monthly Market Share of Restaurants”, International Journal of Recent Engineering Research and Development, 2, 48-55, 2017. | ||
| In article | |||
| [14] | Liu, X., Ren, L., Yuan, F., Yang, B. and Nanjing, P.R. (2009), “Meteorological drought Forecasting using Markov Chain model”In 11th International Conference on Environmental Science and Information Application Technology, Chania, Crete, Greece, pp 23–26 http://toc.proceedings.com/18229webtoc.pdf. [Accessed November 10, 2020]. | ||
| In article | View Article | ||
| [15] | Pobbi, M.A, A three-state Markov Chain Model of plasmodium falciparum parasitemia transmission in Ghana, Dissertation, Kwame Nkrumah University of Science and Technology, 2012. | ||
| In article | |||
| [16] | Twumasi, C. L, Markov Chain Modeling of HIV, Tuberculosis and Hepatitis-B Transmission: A Study of a Regional Hospital in Ghana. Dissertation, University of Ghana, 2018. | ||
| In article | View Article PubMed | ||
| [17] | Grimmett, G. R. and Stirzaker, D. R, Probability and Random Processes. Oxford University Press Inc., New York, 2001. | ||
| In article | View Article | ||
| [18] | Teodorescu, I, “Maximum likelihood estimation for Markov Chains”, 2009. | ||
| In article | |||
| [19] | Ibe, O. C, Fundamentals of Applied Probability and Random Processes. Elsevier Academic Press, Boston, 2005. | ||
| In article | |||
Published with license by Science and Education Publishing, Copyright © 2025 Abdulai Jafar and Alhassan Faisal
![]() This work is licensed under a Creative Commons Attribution 4.0 International License. To view a copy of this license, visit
http://creativecommons.org/licenses/by/4.0/
This work is licensed under a Creative Commons Attribution 4.0 International License. To view a copy of this license, visit
http://creativecommons.org/licenses/by/4.0/
| [1] | World Health Organization, “Pneumonia”, 2019 . https:// www.who.int/ news-room/ fact-sheets/ detail/ pneumonia. [Accessed Dec. 6, 2020]. | ||
| In article | |||
| [2] | Le Roux, D. M., Zar, H. J “Community-acquired pneumonia in children—a changing spectrum of disease”, Pediatric radiology, 47, 1392-1398, 2017. | ||
| In article | View Article PubMed | ||
| [3] | Mhandu, E, Building a low-cost biomedical device to improve accuracy in pneumonia diagnosis in under five children. Dissertation, Ashesi University. 2019. | ||
| In article | |||
| [4] | Lassi, Z. S., Imdad, A. and Bhutta, Z. A, “Short‐course versus long‐course intravenous therapy with the same antibiotic for severe community‐acquired pneumonia in children aged two months to 59 months”, Cochrane Database of Systematic Reviews, 2017. | ||
| In article | View Article PubMed | ||
| [5] | Pant, A., Jain, A., Nayak, K.C., Gandhi, D. and Prasad, B.G “Pneumonia detection: An efficient approach using deep learning”, In 2020 11th International Conference on Computing, Communication and Networking Technologies (ICCCNT) IEEE - 49239. | ||
| In article | View Article PubMed | ||
| [6] | Ventola, C. L, “Immunization in the United States: recommendations, barriers, and measures to improve compliance”, Part 1: childhood vaccinations. Pharmacy and Therapeutics, 41:426-436, 2016. | ||
| In article | |||
| [7] | Swedberg E, Shah R, Sadruddin S, Soeripto J (2020) Saving young children from forgotten killer: pneumonia.Am J Physiol Lung Cell Mol Physiol. | ||
| In article | View Article PubMed | ||
| [8] | Jill, S.S. (2018). Why pneumonia can be deadly for some people. https://www.healthline.com/health/pneumonia/can-you-die-from-pneumonia#risk.[Accessed Dec. 10, 2020]. | ||
| In article | |||
| [9] | Zawn, V, (2017). “Is Pneumonia contagious? Causes and Transmission” MedicalRecords.com. [AccessedNovember 25, 2020]. | ||
| In article | |||
| [10] | Backhaus, E., Berg, S, Andersson, R., Ockborn, G., Malmström, P., Dahl, M., ....and Trollfors, B, “Epidemiology of invasive pneumococcal infections: manifestations, incidence and case fatality rate correlated to age, gender and risk factors”, BMC infectious diseases, 16,1-12, 2016. | ||
| In article | View Article PubMed | ||
| [11] | Iddrisu, A. K., Alhassan, A. and Amidu, N,“ Survival analysis of birth defect infants and children with pneumonia mortality in Ghana”, Hindawi Advances in Public Health, 1-7, 2019. | ||
| In article | View Article | ||
| [12] | Datong, G.M,“A Markov Chain Model Analysis of GSM Network Service Providers of Marketing Mix”, International Journal of Engineering & Technology IJET-IJENS, 11(04), 38 – 43, August 2011. | ||
| In article | |||
| [13] | Kassa, A.M., Abrham, E. and Seid, T.“Application of Markov Chain Analysis Model for Predicting Monthly Market Share of Restaurants”, International Journal of Recent Engineering Research and Development, 2, 48-55, 2017. | ||
| In article | |||
| [14] | Liu, X., Ren, L., Yuan, F., Yang, B. and Nanjing, P.R. (2009), “Meteorological drought Forecasting using Markov Chain model”In 11th International Conference on Environmental Science and Information Application Technology, Chania, Crete, Greece, pp 23–26 http://toc.proceedings.com/18229webtoc.pdf. [Accessed November 10, 2020]. | ||
| In article | View Article | ||
| [15] | Pobbi, M.A, A three-state Markov Chain Model of plasmodium falciparum parasitemia transmission in Ghana, Dissertation, Kwame Nkrumah University of Science and Technology, 2012. | ||
| In article | |||
| [16] | Twumasi, C. L, Markov Chain Modeling of HIV, Tuberculosis and Hepatitis-B Transmission: A Study of a Regional Hospital in Ghana. Dissertation, University of Ghana, 2018. | ||
| In article | View Article PubMed | ||
| [17] | Grimmett, G. R. and Stirzaker, D. R, Probability and Random Processes. Oxford University Press Inc., New York, 2001. | ||
| In article | View Article | ||
| [18] | Teodorescu, I, “Maximum likelihood estimation for Markov Chains”, 2009. | ||
| In article | |||
| [19] | Ibe, O. C, Fundamentals of Applied Probability and Random Processes. Elsevier Academic Press, Boston, 2005. | ||
| In article | |||


