In this article a new control chart to monitor the compound fraction defectives is developed. The variability in the sample sizes and fraction defectives in the process are jointly monitored by using a single chart. The newly developed chart has good advantages over other charts by maintaining a single chart for two variable characteristics. This chart can monitor and control the fraction defectives in a process and at the same time will control the variability in the sample sizes. The ARL values are determined which is compared with other charts. It was found that the ARL of the proposed control chart better performed than the other control charts.
Statistical Process Control (SPC) is a powerful quality control technique used to monitor and control processes in various industries, ensuring they consistently meet predetermined quality standards. SPC tools and techniques are employed to monitor and examine the activities of quality control processes in industries. A Control chart is one of the primary tools for controlling product quality and improving the production process. The primary objective of process control is to distinguish between common cause variation and special cause variation within a process. Dr. Walter A. Shewhart developed the Process Control Chart in 1920. These control charts are graphical representations of process data over time, with a center line representing the process average and upper and lower control limits indicating the acceptable range of variations. Process data points are plotted on the control chart, and their distribution helps identify trends, shifts, or abnormal patterns in the production process.
Various types of attribute control charts are available for different applications, such as the c chart, np chart, p chart, q chart, and u chart, as found in the literature. Shewhart control charts are used to monitor shifts in the mean or variance of a single quality characteristic. In modern industries, it is necessary to monitor the fraction of defectives in the process while controlling variable sample sizes. However, there are no control charts available in the literature to monitor compound fraction defectives. Therefore, this paper proposes a new control chart based on the Compound Binomial Distribution to monitor both fraction defectives and sample sizes known to be compound fraction defectives. The compound fraction defectives chart is useful for monitoring process parameters, as it can control both the fraction of defectives and the variability of sample size in a single chart. This may provide an added advantage for both producers and consumers. The Average Run Length (ARL) is derived for this new chart. Illustration and comparison are given. The parameters, control charts and control limits are derived and provided.
The article is structured as follows: Section 2 provides a comprehensive review of the relevant literature on control charts. In section 3, the proposed methodology of the research is given. The findings are outlined in Section 4, which includes tables and graphs displaying the derived control limits and control charts and also ARL with illustration. Section 5 contains the derivation of ARL and a comparison of the proposed control chart with other charts. Section 6 gives the conclusion of the present research work.
Shewhart 1 introduced the concept of a control chart to monitor the quality of processes in the industry. 2 Page introduced a CUSUM chart an alternative to  and R chart which monitors the process mean in small shifts. S.W. Roberts introduced the control chart based on geometric moving averages to monitor the process mean of a normal distribution. This chart is more sensitive for detecting small shifts 3.
Edna and Roger 4 developed a Simultaneous control chart that controls the process level and variability and also supplies information about the process distribution and specifications in a single control chart. Kaminsky et al 5 proposed a control chart based on geometric distribution. Chao and Cheng 6 developed a semicircle control chart to plot a single plotting character to indicate the mean and standard deviation by plotting two parameters on each other. 7 Spring and Cheng designed a single control chart for multivariate processes which shows both process mean and standard deviation on the same chart. a-cuts fuzzy  – R and
  - S control charts are developed by Senturk and Erginel 8 together with the a-cuts fuzzy midrange techniques. Chan, Xie & Goh 9 proposed a Cumulative Quantity Control (CQC) chart to monitor the high-yield process. 10 Muhammad et al developed an attribute control chart based on Weibull distribution using accelerated hybrid censoring to show that this chart is better than the Shewhart np chart. Based on attribute inspection Roberto et al developed a new control chart to evaluate the stability of the process means 11. Shafqat et al proposed a control chart based on the time –truncated life test 12. Linda et al 13 said that depending on the data set it is essential to fit the distribution and then develop the control chart. Bhai and Choi designed a new method for constructing
  and R charts based on the WV method 14. Devaarul and Arunthadhi 15 designed a Truncated Poisson Exponentially Weighted Moving Average (TPEWMA) control chart for an un-stabilized production process.
The probability density function of the binomial distribution is
P(X=r) =  ; r= 0,1,2……...n (1)
But in industries n is considered as a random variable.
Let n follow the Poisson distribution.
P(n=k) =  ; k = 0,1,2,3…… (2)
The joint probability of X and n is given by, i.e. the joint probability of equations (1) and (2) is
P(X=r)  P(n=k) = P(n=k)P(X=r ǀ n=k)
P(X=r)  P(n=k) =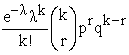
Here, X is said to be a compound binomial distribution. Since P(X=r ǀ n=k) is the probability of r successes in k trials. Such that r
P(X=r) = 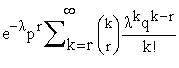 (3)
(3)
On solving the above equation we get,
P(X=r) =  (4)
(4)
Hence, the above equation is the probability density function of Compound Binomial distribution.
3.2. Moment Generating Function of Compound Binomial Distribution (t) = E(
 )
)
 (t)=
(t)=  (5)
(5)
Equation (5) shows the moment generating function of compound binomial distribution.
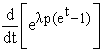
Now differentiate  (t) with respect to ‘t’
 =
= 
 = λp
= λp
Putting t = 0, we get
 = λp
= λp
Similarly, we get
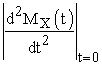 = (
= ( λp
λp
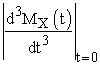 = (
= ( 3(
3( λp
λp
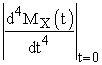 = (
= ( 6(
6( 7(
7( λp
λp
 (t) = E(
 )
)
 (t) =
(t) =  (6)
(6)
Equation (6) shows the characteristic function of the compound binomial distribution.
3.4. Moments of Compound Binomial DistributionHence the moments of the compound binomial distribution are,

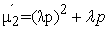
 = (
= ( 3(
3( λp
λp
 = (
= ( 6(
6( 7(
7( λp
λp

 =
= 
 = 3(
= 3( λp
λp
Hence,
Mean =  (7)
(7)
Variance =  (8)
(8)
The UCL (Upper Control Limit) for Compound fraction defective is  + 3
+ 3 .
.
Proof
Let X be the random variable that follows Binomial distribution. Then the probability density function is
P(X=r) = 
Then the mean and variance of the Binomial distribution is
E(X= r) = np and V(X= r) = npq
Now, n is the random variable that follows the Poisson distribution. Hence, the probability density function is
P(n=k) = 
Then the mean and variance of the Poisson distribution is
E(n= k) = λ and V(n=k) = λ
Then the probability density function of compound binomial distribution is derived from Binomial and Poisson distribution is
P(X=r) = 
 is the average of the Poisson which is equal to np in Compound Binomial distribution.
Then from (7) and (8) we get
Mean =  n
n
Variance =  n
n
Then, UCL = E(X) + 3 S.E(X)
E(X) = 
S.E(X) = 
Therefore, UCL is  + 3
+ 3 .
.
The LCL (Lower Control Limit) for Compound fraction defective is  - 3
- 3 .
.
Proof
Let X be the random variable that follows the Binomial distribution. Then the probability density function is
P(X=r) = 
Then the mean and variance of the Binomial distribution is
E(X= r) = np and V(X= r) = npq
Now, n is the random variable that follows the Poisson distribution. Hence, the probability density function is
P(n=k) = 
Then the mean and variance of Poisson distribution is
E(n= k) = λ and V(n=k) = λ
Then the probability density function of compound binomial distribution is derived from Binomial and Poisson distribution is
P(X=r) = 
 is the average of the Poisson which is approximately equal to np in Compound Binomial distribution. Then from (7) and (8) we get
Mean =  n
n
Variance =  n
n
Then, LCL = E(X) - 3 S.E(X)
E(X) = 
S.E(X) = 
Therefore, LCL is  - 3
- 3 .
.
The Control limits for Compound Fraction Defectives are as follows,
CL = 
UCL = + 3
+ 3
LCL =  - 3
- 3
To monitor the quality of the process, 20 subgroups are taken. The number of defects and sample size are given below.
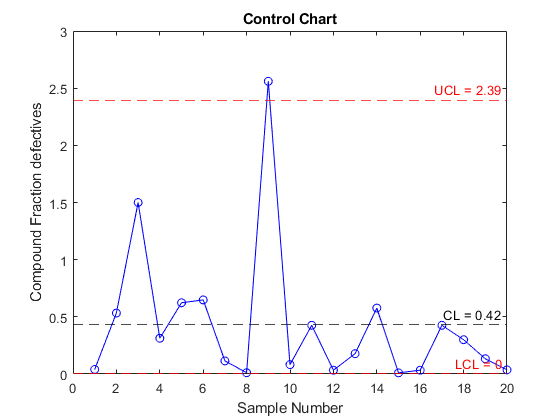
4.1. Control ChartThe control chart for the above data in Table 1 has been constructed using the Matlab program. Hence, the centre line, upper control limit and lower control limit for the data are as follows, CL = 0.42, UCL = 2.39, LCL = 0
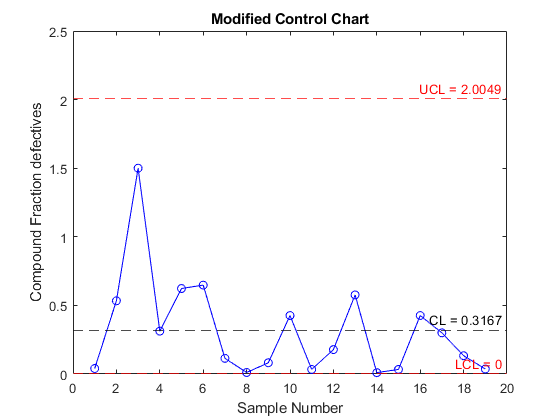
Figure 1 displays the control chart for compound fraction defectives, based on the data from Table 1. The compound fraction defective is calculated for the 20 samples. This control chart effectively manages both the fraction defectives and sample size in a single chart. As shown in Figure 1, the control chart indicates an out-of-control condition at sample number 9. Consequently, we exclude the sample that exhibits an out-of-control signal and create a modified compound fraction defectives control chart for the remaining data. The control limits for the modified compound fraction defectives control chart are as follows, CL = 0.3167, UCL = 2.0049, LCL = 0. Figure 2 shows the modified compound fraction defectives control chart.


The efficiency measure of a control chart is the average run length. The Average Run Length (ARL) can be calculated as follows:
ARL = 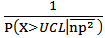
The Upper Control Limit (UCL) for the above data using compound binomial is 2.39 and the mean of the compound fraction defective  is 0.42.
ARL = 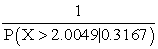
ARL = 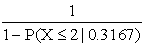
ARL = 239.073  239
239
Hence, the in-control ARL of compound fraction defectives for the given data from Table 1 is 239.
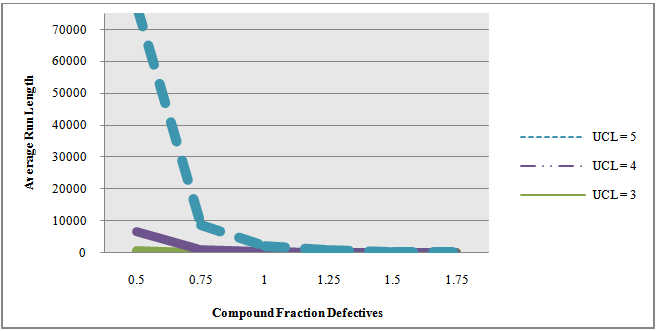
An investigation is carried out to assess the effectiveness of the newly designed control chart. The primary focus of the investigation is to analyze and compare the ARL of compound fraction defectives with fraction defective.
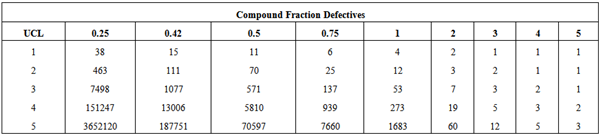
The Table 2 shows that for various values of UCL and compound fraction defectives, the ARL is determined and given in the body of the table. It shows that when the UCL gets increased and defective gets decreased the ARL gives a better run in the newly developed control chart.
The Table 3 the ARL is calculated for various values of UCL, sample size and fraction defectives. It shows that when the sample size gets increased the ARL gets increased and the fraction defective is decreased.
In this article, a new control chart is developed to monitor compound fraction defective with variability in the sample sizes. The compound control chart is designed for monitoring fraction defectives and to control variability in sample sizes during the production process. The control chart can control both the number of defectives and variability of sample size as compound fraction defectives in a single chart. The ARL for the newly developed control chart is derived and calculated. For various values of UCL, the ARL for compound fraction defectives is calculated and compared with the ARL of the control chart for fraction defectives. The ARL results indicate that in the control chart for fraction defectives, the ARL increases as the fraction defective decreases. However, when using the newly developed compound fraction defectives control chart, the ARL decreases as the compound fraction defectives increases. Therefore, there is an additional advantage when dealing with an Average Sample while the process is under control. Implementing this chart in the quality control section may lead to improved process control and a reduction in compound defectives while maintaining control over sample sizes.
| [1] | Shewhart, W. A, “Quality Control Charts”, Bell System Technical Journal, 5. 593-602. 1926. | ||
| In article | View Article | ||
| [2] | Page, E.S., “Continuous Inspection Schemes”, Biometrika, 41 100-115. Jun.1954. | ||
| In article | View Article | ||
| [3] | Roberts, S.W, “Control Chart Tests Based on Geometric Moving Averages”, Technometrics, 1 (3). 239-250. Aug. 1959. | ||
| In article | View Article | ||
| [4] | White, E. M and Schroeder, R, “A Simultaneous Control Chart”, Journal of Quality Technology, 19 (1). 1–10. Jan. 1987. | ||
| In article | View Article | ||
| [5] | Frank C. Kaminsky, James C. Benneyan, Robert D. Davis and Richard J. Burke, “Statistical Control Charts Based on a Geometric Distribution”, Journal of Quality Technology, 24(2). 63-69. Apr. 1992. | ||
| In article | View Article | ||
| [6] | Chao, M.T and Cheng, S.W, “Semicircle Control Chart for Variables Data”, Quality Engineering, 8. 441–446. Mar. 1996. | ||
| In article | View Article | ||
| [7] | Spiring, F.A and Cheng, S.W, “An Alternate Variables Control Chart: The Univariate and Multivariate Case”, Statistica Sinica, 8. 273–287. 1998. | ||
| In article | |||
| [8] | Sevil Senturk and Nihal Erginel, “Development of fuzzy  and and  Control Chart Using a – cuts”, Information Sciences, 79 (10). 1542-1551. 2009. Control Chart Using a – cuts”, Information Sciences, 79 (10). 1542-1551. 2009. | ||
| In article | View Article | ||
| [9] | Chan, L. Y., Xie, M. and Goh, T. N, “Cumulative Quantity Control Charts for Monitoring Production Processes”, International Journal of Production Research, 38 (2). 397- 408. Nov. 2010. | ||
| In article | View Article PubMed | ||
| [10] | Muhammad Aslam, Osama H. Arif and Chi-Hyuck, “An Attribute Control Chart for a Weibull Distribution under Accelerated Hybrid Censoring”, Plos One, 12 (3). 1-11. Mar. 2017. | ||
| In article | View Article | ||
| [11] | Quinino, R. C., Bessegato, L. F. and Cruz, F. R. B, “An Attribute Inspection Control Chart for Process Mean Monitoring”, The International Journal of Advanced Manufacturing Technology, 90 (9). 2991-2999. Jun.2017. | ||
| In article | View Article | ||
| [12] | Shafqat, A., Hussain, J., Amjad, D.Al-Nasser & Aslam, M, “Attribute Control Chart for Some Popular Distributions”, Communications in Statistics – Theory and Methods, 47 (8). 1978-1988, Oct. 2017. | ||
| In article | View Article | ||
| [13] | Bai, D.S and Choi, I.S, “X̄ and R Control Charts for Skewed Populations”, Journal of Quality Technology, 27 (2), 120-131. Feb 2018. | ||
| In article | View Article | ||
| [14] | Linda Lee Ho, Fidel Henrique Fernandes and Marcelo Bourguign, “Control Charts to Monitor Rates and Proportions”, Quality and Reliability Engineering, 35 (6). 1- 19. Sep. 2018. | ||
| In article | View Article | ||
| [15] | Devaarul, S and Arunthadhi, N, “Design of Geometric Moving Average Control Chart to Monitor Poisson Mean for an Unstabilized Production Process”, International Journal of Statistics and Applied Mathematics, 8 (3). 26-35. Apr. 2023. | ||
| In article | |||
| [16] | Devaarul, S and Arunthadhi, N, “A Study on Control of Fuzzy based Compound Fraction Defectives in a Production Process using Control Charts Technique”, International Journal of Natural Sciences, 2023, In press. | ||
| In article | |||
| [17] | Gupta, S.C and Kapoor, V.K, “Fundamentals of Applied Statistics”, Fourth Edition, Sultan Chand & Sons, New Delhi, 2007. | ||
| In article | |||
| [18] | Montgomery, D. C, Introduction to Statistical Quality Control, Sixth Edition, Wiley India, New Delhi, 2009. | ||
| In article | |||
Published with license by Science and Education Publishing, Copyright © 2023 DevaArul S and Arunthadhi N
 This work is licensed under a Creative Commons Attribution 4.0 International License. To view a copy of this license, visit
http://creativecommons.org/licenses/by/4.0/
This work is licensed under a Creative Commons Attribution 4.0 International License. To view a copy of this license, visit
http://creativecommons.org/licenses/by/4.0/
| [1] | Shewhart, W. A, “Quality Control Charts”, Bell System Technical Journal, 5. 593-602. 1926. | ||
| In article | View Article | ||
| [2] | Page, E.S., “Continuous Inspection Schemes”, Biometrika, 41 100-115. Jun.1954. | ||
| In article | View Article | ||
| [3] | Roberts, S.W, “Control Chart Tests Based on Geometric Moving Averages”, Technometrics, 1 (3). 239-250. Aug. 1959. | ||
| In article | View Article | ||
| [4] | White, E. M and Schroeder, R, “A Simultaneous Control Chart”, Journal of Quality Technology, 19 (1). 1–10. Jan. 1987. | ||
| In article | View Article | ||
| [5] | Frank C. Kaminsky, James C. Benneyan, Robert D. Davis and Richard J. Burke, “Statistical Control Charts Based on a Geometric Distribution”, Journal of Quality Technology, 24(2). 63-69. Apr. 1992. | ||
| In article | View Article | ||
| [6] | Chao, M.T and Cheng, S.W, “Semicircle Control Chart for Variables Data”, Quality Engineering, 8. 441–446. Mar. 1996. | ||
| In article | View Article | ||
| [7] | Spiring, F.A and Cheng, S.W, “An Alternate Variables Control Chart: The Univariate and Multivariate Case”, Statistica Sinica, 8. 273–287. 1998. | ||
| In article | |||
| [8] | Sevil Senturk and Nihal Erginel, “Development of fuzzy and Control Chart Using a – cuts”, Information Sciences, 79 (10). 1542-1551. 2009. | ||
| In article | View Article | ||
| [9] | Chan, L. Y., Xie, M. and Goh, T. N, “Cumulative Quantity Control Charts for Monitoring Production Processes”, International Journal of Production Research, 38 (2). 397- 408. Nov. 2010. | ||
| In article | View Article PubMed | ||
| [10] | Muhammad Aslam, Osama H. Arif and Chi-Hyuck, “An Attribute Control Chart for a Weibull Distribution under Accelerated Hybrid Censoring”, Plos One, 12 (3). 1-11. Mar. 2017. | ||
| In article | View Article | ||
| [11] | Quinino, R. C., Bessegato, L. F. and Cruz, F. R. B, “An Attribute Inspection Control Chart for Process Mean Monitoring”, The International Journal of Advanced Manufacturing Technology, 90 (9). 2991-2999. Jun.2017. | ||
| In article | View Article | ||
| [12] | Shafqat, A., Hussain, J., Amjad, D.Al-Nasser & Aslam, M, “Attribute Control Chart for Some Popular Distributions”, Communications in Statistics – Theory and Methods, 47 (8). 1978-1988, Oct. 2017. | ||
| In article | View Article | ||
| [13] | Bai, D.S and Choi, I.S, “X̄ and R Control Charts for Skewed Populations”, Journal of Quality Technology, 27 (2), 120-131. Feb 2018. | ||
| In article | View Article | ||
| [14] | Linda Lee Ho, Fidel Henrique Fernandes and Marcelo Bourguign, “Control Charts to Monitor Rates and Proportions”, Quality and Reliability Engineering, 35 (6). 1- 19. Sep. 2018. | ||
| In article | View Article | ||
| [15] | Devaarul, S and Arunthadhi, N, “Design of Geometric Moving Average Control Chart to Monitor Poisson Mean for an Unstabilized Production Process”, International Journal of Statistics and Applied Mathematics, 8 (3). 26-35. Apr. 2023. | ||
| In article | |||
| [16] | Devaarul, S and Arunthadhi, N, “A Study on Control of Fuzzy based Compound Fraction Defectives in a Production Process using Control Charts Technique”, International Journal of Natural Sciences, 2023, In press. | ||
| In article | |||
| [17] | Gupta, S.C and Kapoor, V.K, “Fundamentals of Applied Statistics”, Fourth Edition, Sultan Chand & Sons, New Delhi, 2007. | ||
| In article | |||
| [18] | Montgomery, D. C, Introduction to Statistical Quality Control, Sixth Edition, Wiley India, New Delhi, 2009. | ||
| In article | |||