 OPEN ACCESS
  PEER-REVIEWED
Robustness and Power of the Kornbrot Rank Difference, Signed Ranks, and Dependent Samples T-test
Norman N. Haidous1, , Shlomo S. Sawilowsky1
1Department of Evaluation and Research, Wayne State University, Detroit, USA
Abstract
The purpose of the study was to compare the power and accuracy of the Kornbrot rank difference test to classical parametric and nonparametric alternatives when the assumption of normality is not met, the data are ordinal, and the sample size is small. Although the procedure is robust, there was no evidence the rank difference test had power advantages over Wilcoxon Signed-Ranks test.
Keywords: nonparametric statistics, power, rank tests, Monte Carlo simulations
American Journal of Applied Mathematics and Statistics, 2013 1 (5),
pp 99-102.
DOI: 10.12691/ajams-1-5-4
Received September 27, 2013; Revised October 15, 2013; Accepted October 22, 2013
Copyright © 2013 Science and Education Publishing. All Rights Reserved.Cite this article:
- Haidous, Norman N., and Shlomo S. Sawilowsky. "Robustness and Power of the Kornbrot Rank Difference, Signed Ranks, and Dependent Samples T-test." American Journal of Applied Mathematics and Statistics 1.5 (2013): 99-102.
- Haidous, N. N. , & Sawilowsky, S. S. (2013). Robustness and Power of the Kornbrot Rank Difference, Signed Ranks, and Dependent Samples T-test. American Journal of Applied Mathematics and Statistics, 1(5), 99-102.
- Haidous, Norman N., and Shlomo S. Sawilowsky. "Robustness and Power of the Kornbrot Rank Difference, Signed Ranks, and Dependent Samples T-test." American Journal of Applied Mathematics and Statistics 1, no. 5 (2013): 99-102.
| Import into BibTeX | Import into EndNote | Import into RefMan | Import into RefWorks |
1. Introduction
The underlying assumptions of nonparametric, or distribution free tests, are “fewer and weaker than those associated with parametric tests” [1]. However, it is incorrect to assume that if the underlying assumptions are easier to meet, or are weaker, that the hypotheses are of less importance or that nonparametric tests are in any way less powerful than their parametric counterparts [2, 3, 4].
For example, the Wilcoxon Signed-Ranks test (WSR) is the nonparametric alternative to the parametric paired sample t-test when the assumption of normality is not met. The t-test is a test of the difference between the means of dependent samples (i.e., pretest – posttest), whereas the Wilcoxon Signed-Ranks test is a more generic test of f(x) = g(x), which pertains to all parameters including the mean. Prior research has demonstrated that the Wilcoxon Signed-Ranks test is more efficient than the paired samples t-test when data are sampled from nonnormally distributed populations [5]. Thus, this nonparametric test should be used in place of its parametric counterpart when the assumption of population normality has been violated, regardless of if the underlying assumption is easier to meet or is weaker.
In addition to this nonparametric test being robust with regard to Type I error and being more powerful than its parametric alternative when the data are sampled form non-normal populations, the same is true for many rank-based statistics as compared with their normal curve counterparts for treatment models of shift in location [2, 3, 6, 7].
2. Alternative to the WSR
A distribution free inferential procedure for comparing paired observations, called the rank difference test, was developed by Kornbrot for situations where the Wilcoxon Signed-Ranks test is applicable, meaning the data are ordinal and were not sampled from a normal distribution [8]. The test is conducted as follows: Assume there are n pairs of ordinal observations  [x(i), x(j)] with values x(i); i=1,2,…2n, and pair indices, a; a=1,2,…,n.
1. Rank all the 2n observations, so that r(i) is the rank of observation x(i)
2. Perform the Wilcoxon test in the normal way on the r(i) rather than the x(i).
For each pair of measures, define a rank difference measure  (i, j)=r(i)-r(j); The statistic, D, is obtained by finding the rank,
  (i, j) of
  for each pair of observations, and calculating:
R – = sum of all ranks corresponding to negative 
R + = sum of all ranks corresponding to positive 
1. D is then smaller of R + and R –
2. Tabulated values of the D statistic, or a normal approximation corrected for continuity may be used to calculate the probability that any given value of D would have occurred under the null hypothesis of no difference between the treatments.
The assumption of rankability of the differences is normally not met with operational measures. Kornbrot discussed this in detail with reference to operational measures of times, rates, and counts. These are common operational measures in psychology and education, such as, for example, time as an index of information processing or when counts are used to determine errors on tasks [8].
Both exact sampling distributions and large sample approximations for the sample statistic D were given by Kornbrot. Kornbrot claimed, “for non-normally distributed internal data the Wilcoxon Signed-Ranks test is a useful and legitimate procedure, although other, perhaps less familiar, robust procedures might have substantial advantages for small samples” [8]. Kornbrot argued that the Wilcoxon Signed-Ranks test is not meaningful in these situations because the procedure entails the subtraction of ordinal scale values. Hence, the rank difference test was proposed as a more suitable alternative to the Wilcoxon Signed-Ranks test, when dealing with ordinal data and small samples. It was claimed that “in all paired comparison designs where the data are not both of internal scale type and of known distribution time” [8].
3. The Current Study
The purpose of this study is to compare the robustness and power of rank difference test to the t-test and the Wilcoxon Signed-Ranks tests when the assumption of normality is not met, the data are ordinal, and the sample size is small.
4. Methodology
A Monte Carlo study was conducted using Compaq 6.6c Fortran to compare the comparative robustness (Type I error rate) and power of the three tests. Data were sampled form various theoretical distributions using IMSL (2007) and real data sets using the normb1 subroutine in Rangen 2.0 [7]. Sample sizes were (n1, n2) = (10,10), (15,15), (20,20). Nominal alpha was set at 0.01 and 0.05. One hundred thousand repetitions were conducting per experiment.
The robustness of each statistical test with respect to Type I error was addressed via the simulation. The Bradley liberal criterion test was used to assess the robustness with respect to Type I error. According to Bradley’s liberal criterion of robustness, a test can be considered robust if its empirical rate of Type I error,  , is within the interval 0.5
 <
<  < 1.5
< 1.5 . Thus, if the nominal level is
  = 0.05, the empirical Type I error rate should be within the interval .025 <
  < .075. Similarly, if the nominal level is
  = 0.01, the empirical Type I error rate should be within interval .005 <
  < .015 [9].
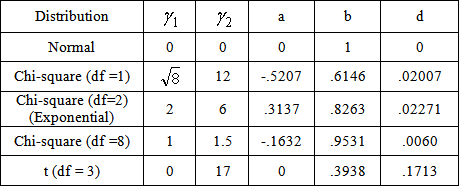
Five mathematical populations were selected: Gaussian (Normal), Chi-square, df = 1, 3, Chi-square, df = 2, Chi-square, df = 8, and t, df = 3. In determining the correlation between the pretest and posttest, algorithms presented by Headrick and Sawilowsky for creating correlated univariate and multivariate data for normal and nonnormal distributions were used [10]. This procedure is based on solving constants of the Fleishman power method [11]. The algorithms were used to populate matrices of correlated data for different types of distributions, presented in the Table 1 below (Normal, Chi-square df = 1, Chi-square df = 2, Chi-square df = 8, t (df = 3):


 PowerPoint Slide
 Larger image(png format)
 View current table in a new window
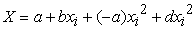
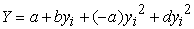
The Headrick and Sawilowsky method for creating correlated data preserve skew and kurtosis to match the originating population [10]. The first step is to solve the Fleishman equation for the constants a, b, -a, and d. After the constants are identified,  can be found using the formula:
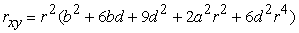 | (1) |
where  0, .70, .80, and .90. This equation was solved using the TI-83 calculator’s graphing functionality. The correlation of 0 was only considered for data sampled from the normal distribution for the purposing of verifying the veracity of the coding.
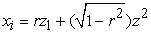
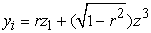
Next, the r values obtained are used to create intermediate standard normal variates, as shown in Table 2. Using three standard normal z scores ( ) from normb1.f90 in Rangen 2.0, the intermediate standard normal variates were computed using the formula below [7]:
 | (2) |
 | (3) |
After the  and
and  were found, they are inputted into the Fleishman equations, along with the constants
  and
and  [7].
[7].
 | (4) |
 | (5) |

 PowerPoint Slide
 Larger image(png format)
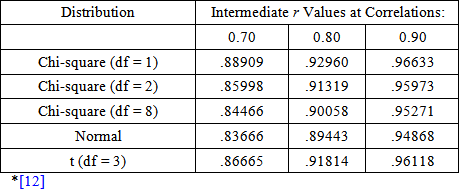 View current table in a new window
A shift in location was introduced to the scores in the intervention group, represented by, by adding a percentage of the mean which corresponds to the preferred effected size. The effect size for shift in location was conducted by using Cohen’s description of common effect sizes, which included small (0.2), medium (0.5), large (0.8). Sawilowsky added descriptors for very large (1.2), and huge (2.0). Nominal α was set at 0.05 and 0.01. For every instance, an effect size was added to the location of the intervention sample [13].
5. Results
Tables 3-7 are presented below to illustrate the results for data sampled from the Normal, Chi-squared df = 1, Chi-squared df = 2, Chi-squared df = 8 and, t (df = 3) distributions for various samples sizes and magnitudes of correlations of .7, .8, and .9. These results exemplify the results obtained across the results. A complete set of tabled results are available from the first author.

 = (15,15), Normal, rxy = .8) PowerPoint Slide
PowerPoint Slide Larger image(png format)
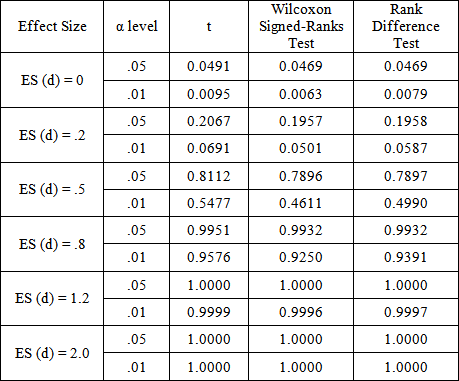 View current table in a new window
 = (10,10), Chi-squared df = 1, rxy = .7) PowerPoint Slide
PowerPoint Slide Larger image(png format)
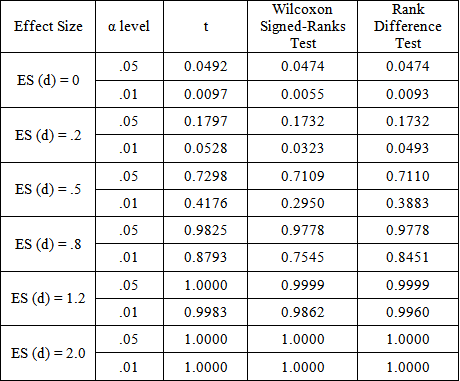 View current table in a new window
, Chi-squared df = 2, rxy = .8) PowerPoint Slide
PowerPoint Slide Larger image(png format)
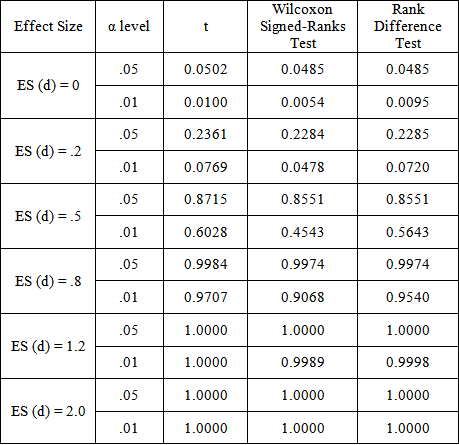 View current table in a new window
= (15,15), Chi-squared df = 8, rxy = .7) PowerPoint Slide
PowerPoint Slide Larger image(png format)
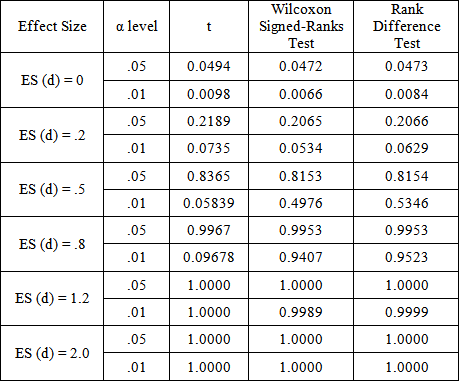 View current table in a new window
= (20,20), t (df = 3), rxy = .7) PowerPoint Slide
PowerPoint Slide Larger image(png format)
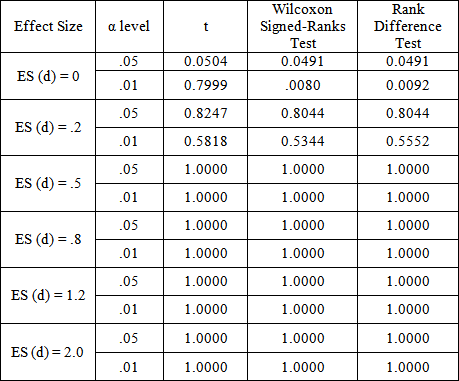 View current table in a new window
It is clear from these tables that the rank difference test is robust to departures from population normality. At first glance, the power results appear to favor the classical t-test over both the Wilcoxon Signed-Ranks and Kornbrot Rank Difference tests, even though it is known that t-test is uniformly less powerful that the Wilcoxon test for the two independent samples layout [5]. This is because the tests are not operating on data obtained from the non-normal distribution per se. Instead, it is applied to the difference distribution of the posttest and pretest score. Taking differences is a normalizing procedure, and the resulting distribution shape tends toward a uniform distribution, for which the t-test is known to be more competitive. It is more competitive because the uniform distribution is symmetric with light tails, just as is the normal curve.
Another explanation for the power results favoring the t-test is that it is being conducted at precisely the 0.05 and 0.01 alpha levels, whereas both of the non-parametric tests are conducted at slightly reduced alpha levels. As explained by Gibbons & Chakraborti, critical values for rank-based nonparametric tests are obtained from the sampling distribution of discrete variables, thus constraining the possible significance levels [14]. For example, a two tailed test with α = 0.05 for sample size n1 = n2 = 5 and n1 = n2 = 6 both have critical values of zero. Hence, the Wilcoxon Signed-Ranks test and the rank difference test, due to their discrete sampling distributions, have a disadvantage when samples are very small.
Gibbons & Chakraborti recommended setting the alpha level of the t-test to match the limitations of the nonparametric tests to obtain a fair comparison [14]. An argument could be raised against their approach, because in practice if a worker has selected α = 0.05 or 0.01 that standard should not be modified by this limitation of the statistical test. Whereas that argument was reasonable during the time period when statistical tests were conducted via obtaining critical values from tabled values, currently available statistical software makes it easy to compute statistical tests at any given nominal alpha level.
6. Discussion
The purpose of this study was investigate Kornbrot’s claim that the rank difference test was superior to the Wilcoxon Signed-Ranks test. Although the procedure was shown to be equally robust to departures from nonnormality, the results do not support Kornbrot’s claim the rank difference test is superior to the Wilcoxon Signed-Rank, although it is difficult to compare the two tests, because their nominal alpha levels are not able to be set to the same level. For example, for certain sample sizes, the closest nominal alpha to 0.05 for the Wilcoxon Signed-Ranks is 0.046, whereas the rank difference test’s sampling distribution permitted setting alpha at 0.048 for that sample size, placing the Wilcoxon Signed-Ranks test at a slight disadvantage. Nevertheless, based on this Monte Carlo study, there is no evidence Kornbrot’s rank difference test is more powerful than the Wilcoxon Signed-Ranks test.
Acknowledgement
We would like to thank our families and colleagues for their continued support.
References
| [1] | Siegel, S., & Castellan, N. J. (1988). Nonparametric statistics for the behavioral sciences (2nd ed.) New York: McGraw-Hill. | ||
 In article In article | |||
| [2] | Blair, R. C., & Higgins, J. J. (1985). Comparison of the power of the Paired Samples t test to that of Wilcoxon’s Signed-Ranks test under various population shapes. Psychological Bulletin, 97 (1), 119-128. | ||
| In article | CrossRef | ||
| [3] | Sawilowsky, S.S. (1990). Nonparametric test of interaction in experimental design. Review of Educational Research, 60(1), 91-126. | ||
| In article | CrossRef | ||
| [4] | Siegel, S., & Castellan, N. J. (1988). Nonparametric statistics for the behavioral sciences (2nd ed.) New York: McGraw-Hill. | ||
| In article | |||
| [5] | Sawilowsky, S. & Blair, R. C. (1992). A more realistic look at the robustness and Type II error properties of the t-test to departures from population normality. Psychological Bulletin, 111(2), 352-360. | ||
| In article | CrossRef | ||
| [6] | Hodges, J. L., & Lehman, E. L. (1956). The efficiency of some nonparametric competitors of the t-test. Annals of Mathematical Statistics, 27(2), 324-335. | ||
| In article | CrossRef | ||
| [7] | Sawilowsky, S. & Fahoome, G. (2003). Statistics Through Monte Carlo Simulation with Fortran. Oak Park: JMASM. | ||
| In article | |||
| [8] | Kornbrot, D. E. (1990). The rank difference test: A new and meaningful alternative to the Wilcoxon signed ranks test for ordinal data. British Journal of Mathematical and Statistical Psychology, 43, 241-264. | ||
| In article | CrossRef | ||
| [9] | Bradley, J. V. (1978). Robustness? British Journal of Mathematical & Statistical Psychology, 31, 144-152. | ||
| In article | CrossRef | ||
| [10] | Headrick, T. C., & Sawilowsky, S. S. (2000). Weighted simplex procedures for determining boundary points and constants for the univariate and multivariate power methods. Journal of Educational and Behavioral Statistics, 25, 417-436. | ||
| In article | |||
| [11] | Fleishman, A. I. (1978). A method for simulating non-normal distributions. Psychometrika, 43, 521-532. | ||
| In article | CrossRef | ||
| [12] | Smith, J. (2009). Intermediate r values for use in the Fleishman power method. Journal of Modern Applied Statistical Methods, 8(2), 610-612. | ||
| In article | |||
| [13] | Sawilowsky, S. (2009). New effect size rules of thumb. Theoretical and Behavioral Foundations, 8,2, 597-599. | ||
| In article | |||
| [14] | Gibbons, J., & Chakraborti, S. (1991). Comparisons of the Mann-Whitney, Student’s t, and Alternate t Tests for means of normal distribution. The Journal of Experimental Education 59(3), 258-267. | ||
| In article | |||

 CiteULike
 Delicious

