Water is a precious natural resource which made life possible on earth. Most of the human civilization occurred on the banks of rivers. Pollution is the major problem faced by rivers of the world. Rivers are mainly polluted due to anthropogenic activities like disposal of sewage and industrial effluents, excessive use of pesticides and chemical fertilizers, sand mining, construction activities, etc. Many of the major rivers of Kerala are on the brink of death due to the pollution crisis. Prevention of pollution and conservation of rivers is very important for the protection of the health of the ecosystem as well as our economy. Proper studies related to water quality index of rivers are necessary to understand the pollution rate of rivers. As a result of this assistance, a proper remedy to protect from pollution assures good water and their sustainability for our future generations. The present study focuses the comparison and analysis of the physico-chemical and entomological parameters of two lotic ecosystems. Neyyar river was taken as the reference site and downstream stretches of Karamana river was taken as the test site. Water samples and arthropods were collected from the selected sites of the study areas during the pre-monsoon period of 2020. The parameters analyzed for this study were temperature, pH, dissolved oxygen, dissolved carbon dioxide and productivity. Entomological parameters were also studied to compare the pollution rate of these sites. The correlation of these parameters were analyzed to prove its statistical significance. The downstream stretches of Karamana river seemed to be highly polluted while comparing with the upstream stretches of Neyyar river due to the increased human settlement and anthropogenic activities.
Approximately 70% of freshwater used by humans were utilized in agriculture. Fishing in natural aquatic fields are the major sources of food for many parts of the world. Freshwater can easily become polluted by human activities due to naturally occurring processes such as erosion. Changing landscape for the use of agriculture has a great effect on the flow of freshwater in the local environment and also affects the cycle of freshwater. Water pollution is the addition of hazardous wastes to water bodies such as lakes, rivers, seas and the ocean as well as ground water. It occurs when pollutants reaches water bodies prior to their treatment. Wastes from homes, factories and other buildings get into the water bodies and as a result water gets contaminated. Human activities like throwing sewage and industrial wastes into rivers and oceans using harmful fertilizers and even littering affect our water resources. Dumping of sewage wastes into water resources also pollutes the environment and causes health problems.
Impact of city sewage discharge and its industrial effluents can degrade the physicochemical composition of Ganga river water to a greater extent in Varanasi. Seasonal and temporal variation related to physicochemical and bacteriological characteristics of River Ganga were also studied 1. The physicochemical and microbiological studies of Karnaphuli estuary, various aspects of algal taxonomy, physiology and ecology, concentration problems of environment like pollutants and their effect on arthropods in reference to uptake and accumulation of waste and detoxification mechanism in aquatic food chain, bio-fouling and bio-corrosion were studied 2. The impact of sewage on phytoplankton communities reflected domestic and municipal waste water, sewage, industrial effluents and water materials have affected physicochemical parameters of the river water 3. In addition, waste water was portrayed by high temperature, high BOD, COD, high total solids, and low DO along with the various chemical constituents 4. The anthropogenic impacts of aquatic insects in six streams of south Western Ghats were primarily emphasized to expose the aquatic insects especially ‘pollution sensitive organisms’. The same research revealed the bio-monitoring in relation with the productivity 5.
Aquatic insects were interpreted as bio-indicator of water quality and their influence of environmental variables in the diversity of aquatic insects 9. The change in water quality was analyzed with the help of certain factors in the neural network model for discharge and its water level prediction at Ramganga River 7. These authors explored the concentration of dissolved oxygen, carbon dioxide and their metals decrease the aquatic communities of river water. In this the physicochemical and biological characteristics of river was found gradually changed due to drainage of various industrial effluents 7. A study on water quality analysis of various ponds connected to Neyyar river stated that the water is one of the most important factor of the newline ecosystem 6. Analysis of physicochemical parameters in Neyyar River with special reference to environmental pollution 8 suggested the need for periodic evaluation of water parameters as well as adoption of proper water quality management practices with a view to protect the riverine ecosystem from the influence of allochthonous and autochthonous materials. Different points of wular study report discussed the analysis and measurement of various physicochemical parameters like salinity, TSS, TDS, DO, BOD, turbidity, pH, temperature, alkalinity, hardness and dissolved nutrients of surface water and sediments 12.
Various factors like water temperature, turbidity, nutrients, hardness, alkalinity, dissolved oxygen are playing important role for the survival of plants and animals in water 10. On the other hand the Biological Oxygen Demand (BOD) and the Chemical Oxygen Demand (COD) indicate the level of pollution of a given water body. Each factor has a role in the aquatic ecosystem 14. The productivity depends on physicochemical characteristics of the water body. Most of the rivers of Kerala are polluted due to the indiscriminate dumping of sewage and other waste materials, rigorous sand mining, dumping of domestic and hotel waste and other anthropogenic activities. Unrestricted sand mining accelerate the erosion and destruction of river banks resulting in the low rate of flow especially in summer 11. At present, rivers of Kerala are facing chronic environmental degradation in the form of water pollution owing to over exploitation, over population and poor water management. To overcome this menace, good ecological, environmental and geomorphic knowledge of watershed regions is essential to utilize the existing resources in a sustainable way without disturbing the natural balance. To assess the real situation of the lotic water systems, the present study spotlight the comparison of physiochemical and entomological parameters of Karamana and Neyyar rivers.
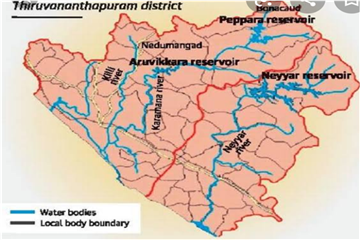
The Neyyar river is a river of South Western India in the Western Ghats. It lie between 18°15’N to 8°40’N latitudes and 77°00’E to77°20’E longitudes. Neyyar has a total basin area of 4835 sq km. The basin covers 24 grama panchayats in Thiruvananthapuram District. It flows from the Agastya Mala hills of Kanyakumari district of Tamil Nadu State. The river passes through Neyyatinkara taluk into the Lakshadweep Sea near Poovar. It has a total length of 56Km. Tributaries include the Kallar river, Mullayar river and the Karavaliyar river. It has several small canals along the river. The Neyyar irrigation project, “Neyyar Dam” is situated in this river. A Safari park is situated near the river. The Neyyar river is a highly vegetated area due to the south west and north west monsoon. The upstream side is rich in thick forest with valuable trees like Sanda, Venga, Teak, Mahagani, Mangium, etc. The downstream side has tapioca garden, coconut, plantain, rose wood and bamboo on either side of river bank. Accessibility to Neyyar upstream is possible by random walk and is very difficult to access because of thick jungles and steep gradient. Population density in highland is less compared to midland and lowland area. Neyyar irrigation project is one among the major irrigation project taken up in Kerala under the first five year plan. The scheme envisaged construction of dam across Neyyar river near Kattakkada in Thiruvananthapuram district. The project was completed in 1973. The scheme has now become an integral part of the lives of the people of Neyyatinkara Taluk and its surroundings, since it is the main source of water for agriculture and drinking purpose.
2.2. Karamana River (Test Site)Karamana river ranks 15th in the catchment area and 17th in the stream length. It is one of the major river flowing through Thiruvananthapuram district. This river originates from Western Ghats and falls into the Arabian Sea. It is located between North latitudes 8°05’ and 8°45’ and east longitudes 76°45’ and 77°15’ and covers an area of 702 sq km. The Karamana river is a small mountainous river with mainstream length of 68km, drains through highland, midland and low land physiographic zones. The river flows 66km westward and merges with the Arabian Sea at Panathura near Kovalam. The river gets its name from Karamana, a suburb of thiruvananthapuram city, Aryanad through which it flows. The catchment area is mostly forested; command area is under mixed dry land crops such as coconut, tapioca, pepper, plantain, rice, etc. The Karamana river rises in the vicinity of Agasthiarkoodam about 1600m above the sea level. The peaks of origin of river are today known as Chemmunji Motta and Athiramala. Its upper tributary rivers are the Kaaviyar, Attayar, Vaiyyappadyaar and Thodayaar. The river flows for 66km in south-west direction before flowing into the Arabian Sea. The largest tributary of the Karamana river is the Killiyar, which flows for a distance of 24 km. A part of the water is diverted into Kochar channel which in turn feeds the Padmateertham pond outside the Padmanabhaswamy temple. The Karamana river merges with the Arabian sea throughout the Pozhikkara estuary. In its final lap, the river runs parallel to the sea known as Edayar. Karamana river has two important dams on it. Aruvikkara dam, built in the 1930s and the Peppara dam which lies further upstream and was built in 1983. Aruvikkara dam was completed with the aim of providing piped drinking water to the city. The Peppara dam regulated the flow of water into the Aruvikkara dam by unifying all the upper tributaries of Karamana River. The Peppara dam has played a crucial role in eliminating the floods. There is also a 3MW hydro power station at Peppara. The Karamana River has several bridges across it. Karamana river supports a range of plants, typical to tropics. The Karamana river has been facing the problems of pollution, acidification and fish kill in recent years. The causes of deterioration in the river’s water quality include the discharge of untreated domestic sewage and industrial effluents into the river and the unregulated development of tourism in the river basin area.
In the present study, samples were collected from the Neyyar River (Station 1) near the Neyyar dam and from Karamana River (Station 2) near Meralanoor, Jagathy for the analysis of physicochemical parameters and biomonitoring. The study was carried out during pre-monsoon period (2020). Surface water samples and arthropods were collected from the respective stations. Aquatic insects were carefully collected using D-frame dipnet where water depth exceeded 1.0 meter. Using D-frame dipnet, a total of 6 sweeps, each of 0.5m length were collected within the sample zone on either side of the transects. A single sweep consisted of forcefully moving the dipnet into a productive habitat for a linear distance of 0.5m. Kick screen net was used to collect insect samples when the mid-stream depth was below 1.0 meter. Five kicks were sampled at various velocities in the water using D-frame dipnet. The net was placed at the downstream of sampling area with the opening facing upstream, so that the opening is perpendicular to the flow which allows the insects to flow into the net easily. In front of the D-frame net, the stones of the sampling area were gently rubbed with hand under the water. Once the larger stones were set aside, the stream bed was vigorously kicked and agitated using toe and heel of the foot for two minutes. The kick net was removed from the water using a forward scooping motion. Following this carefully submerged the net once again in the water for collecting the sample in the bottom corner of the net. The kick net was removed from water quickly pulling the screen straight up out of the water. The samples were evenly transferred to a white collection tray with clean water covering the bottom. The insects were collected into a separate collection tray using forceps, camel brush and eye dropper and they were combined to obtain a single homogenous sample and transferred to sample containers with 95% ethanol for preservation 10.
Taxonomic identification of all insects and larvae was performed with the help of hand lens, dissection microscope and binocular compound microscope. The insects were identified up to family level with the help of suitable key 9. All taxa are sorted and kept in separate vials with proper labeling. The identity and the number of organisms were documented on laboratory bench sheets ples were brought to laboratory for identification 19. For the analysis of physicochemical parameters, the surface water samples were collected in a new white colored 1L bottle using clean buckets. Preservation and transportation of the water samples to the laboratory were as per standard methods (APHA). The physicochemical properties of water such as temperature, pH, DO, CO2, rate of flow, GPP and NPP was determined.
1. Temperature: The temperature is measured with the help of mercury filled Celsius thermometer with an accuracy of 0.1°C 13.
2. pH: The pH is determined with the help of a portable pH Meter, which gives direct value of pH . It is done by placing the electrode into the sample and read out. Once the electrode is placed in sample, press the measure button and leave the electrode in the sample for approximately 1-2 minutes. Once the reading has stabilized, then press the measure button again. This gives the pH of the sample 12.
3. DO: The dissolved oxygen was calculated by Winkler method 15. Carefully filled a 300mL glass stoppered BOD bottle unto brim with sample water. Immediately 2mL of manganous sulphate was added to the collection bottle by inserting the calibrated pipette just below the surface of the liquid. The pipette was squeezed slowly to prevent bubbles. 2 mL of alkaline iodide reagent was added in the same manner. The bottle was closed without any air bubbles. Sample was inverted several times for gentle mixing. If oxygen is present, a brownish orange cloud of precipitate or floc will appear. When this floc has settled to the bottom, mixed the sample by turning it upside down several times and make it settle again. 2 mL of concentrated sulphuric acid was added via a pipette held just above the surface of the sample. Carefully stoppered and invert several times to dissolve the floc. At this point, the sample is "fixed" and can be stored for up to 8 hours, kept in a cool dark place. As an added precaution, squirt distilled water along the stopper and cap the bottle with aluminum foil and a rubber band during the storage period. In a glass flask, 20 mL of the sample with sodium thio sulphate was titrated to a pale straw colour. Slowly dropping titrant solution from a calibrated pipette into the flask and continually stirring or swirling the sample water the sample was titrated. 2 mL of starch solution was added, so a blue colour forms. Continued titration until the sample turns clear. Take care that each drop is fully mixed into the sample before adding the next. The concentration of dissolved oxygen in the sample is equivalent to the number of milliliters of titrant used. Each mL of sodium thio sulfate added equals 1 mg/L dissolved oxygen and then the concordant values of the titration were taken for calculating the dissolved oxygen.
4. CO2: The carbon dioxide in the water sample is estimated by Titration method 16. The graduated cylinder was filled with a precisely known volume of the water and poured into the beaker. Ten drops of phenolphthalein were added into the water using the dropper. The phenolphthalein turned pink since the solution is basic. Carbon dioxide lends a slight acidity to water; hence the water remained clear while adding phenolphthalein. Two drops of sodium hydroxide solution was added from the burette into the water and stir the mixture. The solution turned light pink and stays colour when all of the carbon dioxide has been consumed. If the solution remains clear, added more sodium hydroxide until the solution stays light pink. The molarity was listed on the container. This gave the number of moles of sodium hydroxide used in the titration. The number of moles of carbon dioxide was divided by the number of liters of water used. This gave the molarity of the carbon dioxide in the water and then the carbon dioxide level was calculated.
5. Rate of Flow: Rate of flow was calculated through Float Method 17. It was done by choosing a suitable channel section with minimum turbulence. The channel was marked with the beginning and end of the distance of floating object to travel. The faster the velocity, it is harder to travel over short distance. Throw the floating object (thermocol) into the upstream of the marker. Start the timer when the object crosses the upstream marker and stopped the timer when it crossed the downstream marker. It was repeated to get the measurement 3 times and calculated the rate of flow.
6. Productivity: The primary production in the aquatic ecosystem starts with the synthesis of organic compounds from the inorganic constituents of water by the activity of plants or phytoplankton in the presence of sunlight. The inorganic constituents which form the raw material for this synthesis are water, carbon dioxide, nitrate ions, phosphate ions and various other chemical substances. The products are mainly carbohydrates, proteins and fats in very small quantities. Organic production by plants is the first step in tapping energy by living beings from nonliving natural resources and hence called primary productivity. In this method, the water samples were incubated for a certain period in light and dark bottles which are then suspended at the same depths from where the samples were taken. In the light bottle, the oxygen is released as a result of community respiration. In the dark bottles, only oxygen consumption takes place as a result of respiration. In one of the transparent reagent bottle, the water was filled without air bubble. The bottle was labeled 1 and kept inside. The dark bottle and the light bottle were filled with sample water without air bubble. The dark bottle was labeled 2 and the light bottle was labeled 3. The dark bottle was placed in a dark area without the reach of sunlight and the light bottle was placed in response to the direct sunlight. The bottles were placed in the respective positions for about 5 hours. After 5 hours the bottles were taken and oxygen was fixed using the sample bottle 1. The oxygen content of all the samples were estimated by Winkler’s method and the GPP and NPP were calculated 18.
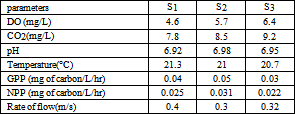
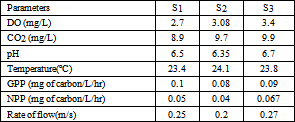
The samples collected from Neyyar River (Upstream) were clear and odorless whereas the samples collected from Karamana River (Downstream) were greenish and yellow colour with a foul smell, visible contamination was noticed. Monitoring water resources quantified water quality, physicochemical parameters and biomonitoring from both the sites. The fate and transport of many anthropogenic pollutants were determined not only by hydrological cycle, but also physicochemical processes. In order to the impacts of human society’s migration, it is becoming gradually more important to implement comprehensive monitoring regimes. The monitored values of physicochemical parameters of Neyyar river and Karamana river were presented in Table 1, Table 2.
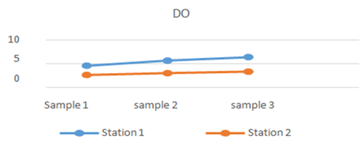
1. DO: DO refer to the level of free, non-compound oxygen present in water or liquid. The average DO was more in Neyyar River (5.6mg/L) than in Karamana river (3.08mg/L).This showed that more level of pollution is prevalent in site 2. Rapidly moving water tends to contain a lot of dissolved oxygen, whereas stagnant or polluted water contain less. Bacteria in water can consume oxygen when organic matter decays. Thus, excess organic matter in rivers can turn out eutrophication led to oxygen deficient situation 20.
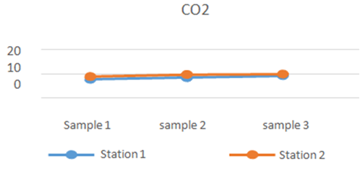
2. CO2: The amount of carbon dioxide was less in station 1(8.54mg/L) than station 2(9.76mg/L). The amount of increased level of carbon dioxide is a symptom of higher anthropogenic activities which results in inputs of nutrients have fuelled massive algal blooms, which release CO2 into the water. Thus the water contains high CO2 levels 18.
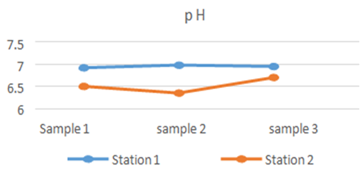
3. PH: Decrease in the average value of pH in Karamana river (6.96) shows high level of pollution. Due to the increase in the amount of CO2, pH values also decreased. Photosynthesis, respiration and decomposition contributed to pH fluctuations due to their influences on CO2 levels. The extremity of these changes depends on the alkalinity of the water, but there are often noticeable diurnal variations. Anthropogenic causes of pH fluctuations are usually related to pollution 21.
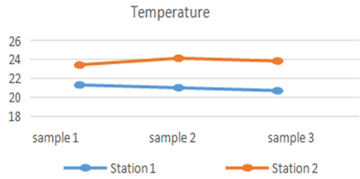
4. Temperature: There was an average increase in the value of temperature in station 2 (23.4°C) than in station 1 (21°C). An increase in the air temperature will cause water temperature to increase as well. As many aquatic habitats will be negatively affected due to water temperature increase. As temperature in water increases, DO level also decrease. Increase in algal blooms can also lead to an increase in temperature 14.
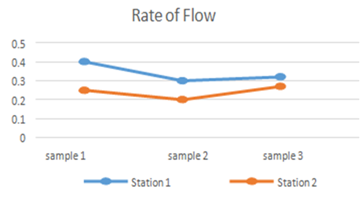
5. Flow Rate: The average velocity of water is more in Neyyar river (0.3m/s) than Karamana river (0.25m/s). This was mainly because of the lack of pollutants in water. In areas where the rate of flow related to pollution was due to dumping of wastes. Flow directly affects the dissolved oxygen in water. Low flow conditions are much less conductive to oxygenation during high temperature and DO levels can become critically low 17.
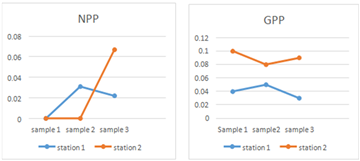
6. Productivity: Productivity is the rate of production of new biomass by a given habitat or area. Both GPP and NPP were found to be higher in Karamana River. This mainly occurred due to the high anthropogenic activity in that area, these results were due to the rich nutrients. Algal blooms are formed in water and results in creation of dense blooms of noxious, foul smelling phytoplankton that reduce water clarity and harm water quality. Algal blooms limit light penetration, reducing growth and causing die offs of plants in littoral zones, while also lowering the success of predators that need light to pursue prey 20.
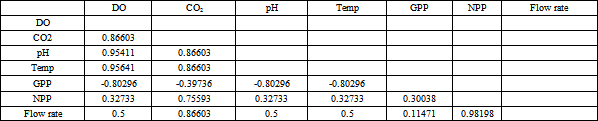
In Neyyar river (Reference site), DO showed positive correlation with CO2, pH, temperature and NPP. It showed negative correlation with GPP. CO2 showed positive correlation to pH, temperature NPP and rate of flow, it showed negative correlation with GPP. PH showed positive correlation with NPP and rate of flow, it showed negative correlation with GPP. Temperature showed positive correlation with NPP and rate of flow, it showed negative correlation with GPP. GPP showed positive correlation with NPP and rate of flow. NPP showed positive correlation with rate of flow.
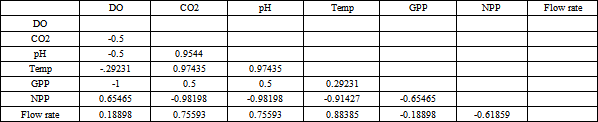
In Karamana river (Test site), DO showed positive correlation with NPP and rate of flow. It showed negative correlation with CO2, pH, temperature and GPP. CO2 showed positive correlation with pH, temperature, GPP and rate of flow and it showed negative correlation with NPP. PH showed positive correlation with temperature, GPP and rate of flow, it showed negative correlation with NPP. Temperature showed positive correlation with GPP, NPP and rate of flow. GPP showed positive correlation with NPP and rate of flow. NPP showed positive correlation with rate of flow [Table 3, Table 4].
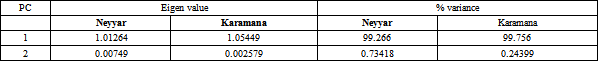
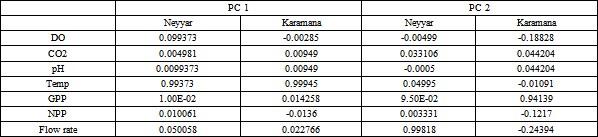
4.2. Principal Component AnalysisPrincipal component analysis (PCA) technique was a useful tool for water quality monitoring in aquatic ecosystems, as it helps to figure out the principal factors influencing water quality. PCA was carried out to extract the most important factors and physicochemical parameters affecting the water quality. Due to the complex relationships, it was difficult to draw clear conclusions. PCA was applied to decrease the dimension of a data set having large number of interrelated variables. This reduction is achieved by transforming data set into a new set of variables; the principal components (PCs), which are orthogonal and arranged in decreasing order of importance. Prior to modeling, all the nutrient concentrations were log transferred to make the distribution closer to the normal.
Statistical conclusions and tests were made on the basis of multi parametric model. In reference site based on the eigen values screen plot, the seven physicochemical parameters were reduced to two main factors (factor 1 and 2). The first factor corresponding to the highest eigen value (1.01264) accounts for 99.2% of the total variance. The second factor corresponding to the second highest eigen value (0.00749) accounts for approximately 0.73418% of total variance. The remaining 6 factors have eigen value of less than unity [Table 5]. In test site, the first factor corresponding to the largest eigen value (1.05449) accounts for approximately 99.756% of the total variance. The second factor corresponding to the second eigen value (0.002579) accounts for approximately 0.24399% of total variance. The remaining 6 factors have eigen value of less than unity. The analysis of factor loadings showed that temperature is the major principal components in the reference site and test site. As all the factors have a positive eigen value, these factors have a strong influence on the water chemistry. The factor loadings for PC1 and PC2 are represented in the Table 6.
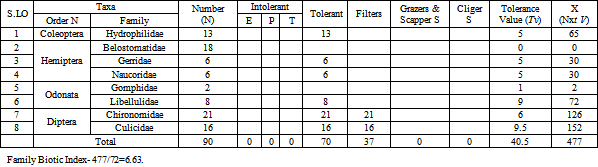
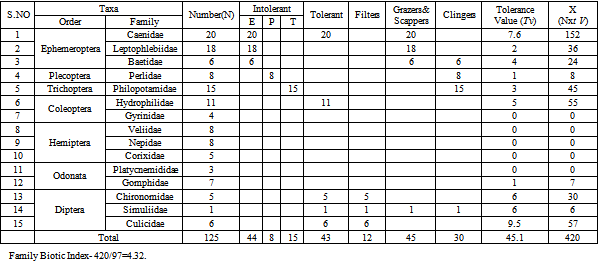
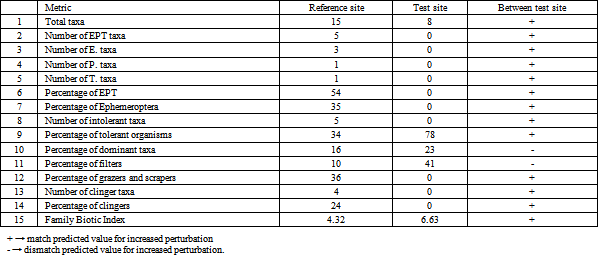
The data of insects collected from reference site and test site during pre-monsoon were shown in the Table 7 - Table 8. In this investigation, there was a significant variation in the taxa richness at reference site and test site during pre-monsoon. 15 taxa were recorded at reference site whereas only 8 taxa could be collected at test site. In reference site EPT taxa included 5 families while in test site there was a complete absence of EPT taxa. Leptophlebiidae and Caenidae were the dominant taxa in the reference site whereas Belostomatidae was the dominant taxa of test site. Percentage composition of EPT was only 0% at test site on comparison with 54% at reference site. Percentage of tolerant organism showed a hike of 78% at test site in comparison with 34% at reference site 19. This shows that Karamana River (Downstream) is more polluted than Neyyar River.
4.3. Feeding Measures, Habit Measures and Family Biotic IndexSite tests computed for comparative analysis of pollution for reference and test sites during pre-monsoon is given in the Table 9. It was observed that clingers contribute only 0% of the total insects in test site while in reference site it was 4%. The percentage of grazers and scrappers in the reference site and test site were 0% and 36% respectively. The family biotic index also showed significant difference and it was 4.32 at reference site and 6.63 at test site. Site tests computed for comparative analysis of pollution showed that out of 15 matrices 13 matrices matched with predicted values of contamination 22.
Increase in water pollution is a major problem in all the rivers. The present study revealed that while comparing to the Neyyar River, deterioration of water quality was elevated at downstream stretches of the Karamana river. All the physicochemical parameters and biomonitoring proved high rate of pollution in Karamana River. This was due to high anthropogenic disturbances associated with the region. Wild use of chemical fertilizers and pesticides, devious dumping of domestic wastes are also the major causes of deterioration of water 23. The quality of water is depleting rapidly with the change in human lifestyle which includes construction activities, utilization of agricultural land and forest land for other developmental purposes and poor waste management. It was evident that water quality problems prevalent in the region are due to improper disposal, contamination of water by sewage and surface runoff. In Neyyar river (Upstream), there was no anthropogenic activity nor rich nutrients. Due to this reason, the water was clear and was free from pollution.
To reduce the pollution level of downstream portion of Karamana river certain measures which reduce the degradation and pollution level of river should be taken. Public awareness is the best way to prohibit the public waste disposals and interference with the water quality at river banks. The high level of anthropogenic activity should be reduced to a greater extent. A programme must be devised to educate the general public on proper disposal, treatment of sewage for a broader perspective to sustain fresh water.
| [1] | Mishra A, tripathi B.D. (2007). Seasonal and Temporal variations in physico-chemical and bacteriological characteristic’s of river Ganga in Varanasi. Curr World Environ, 2(2): 149-154. | ||
| In article | View Article | ||
| [2] | Ripaj Uddin, Md. Moazzem Hossain, Shakila Akter, Muhammad Edris Ali & Md. Aminul Ahsan. (2020). Assessment of some physicochemical parameters and determining the corrosive characteristics of the Karnaphuli estuarine water, Chittagong, Bangladesh, Water Science, 34:1, 164-180. | ||
| In article | View Article | ||
| [3] | Jackson Adiyiah Nyantakyi, Bernard Fei-Baffoe, Osei Akoto. (2020). Seasonal Variations in Physicochemical and Nutrient Water Quality of River Tano in Ghana, International Journal of Environmental Chemistry. 4(1): 1-12. | ||
| In article | View Article | ||
| [4] | Aregbe, E.A., O. S. Olonitola, H.I. Inabo, E.E. Ella and Ameso, V.C. (2018). Temporal and Spatial Physico-Chemical Parameters of Kubanni Dam, Galma Dam and Shika Dam, Zaria, Kaduna State, Nigeria. Int.J.Curr.Microbiol.App.Sci. 7(08): 812-822. | ||
| In article | View Article | ||
| [5] | Thamarai and Nirmala. (2017). A Comparative Analysis of Physicochemical parameters of Vaiga Reservoir and Pickup Dam , Theni District, Tamil Nadu, India, International Journal of Recent Scientific Research. 8 (7): 18635-18643. | ||
| In article | |||
| [6] | Mallika et al. (2017). Physico chemical and Bacteriological study of Vaiga River, Madurai, Tamil Nadu. International Journal of Fisheries and Aquatic Studies, 5 (1): 42-45. | ||
| In article | |||
| [7] | Khan and Chakrapani. (2017). Spatial and Temporal variations of Physicochemical and pollution of Ramganga River. Environmental Earth Science 76 (56): 231. | ||
| In article | View Article | ||
| [8] | Badusha M and S Santhosh (2017) Seasonal Effects of Water Quality Changes in Neyyar River, Kerala, India; Int J Sci Res Publ 7(7). | ||
| In article | |||
| [9] | Barman and Gupta. (2015). Aquatic insects as bioindicator of water quality – A study on Bakuamari stream, Chakrashila Wildlife Sanctuary, Assam and North East India. Journal of Entomology and zoology studies. 3(3): 178-186. | ||
| In article | |||
| [10] | Nidhi and Shrivastava. (2014). Comparative Review of Physicochemical Assessment of Pavana River. Journal of Environmental Science, Toxicology and Food Technology (IOSR-JESTFT), 8 (6)25-30. | ||
| In article | View Article | ||
| [11] | Grace, B. L. (2014). Water and Sediment Quality Assesment of Poonthura Backwater in the Southwest Coast of India.” American Journal of Marine Science, 2(2): 43-46. | ||
| In article | |||
| [12] | Salim Aijaz Bhat, Gowhar Meraj, Sayar Yaseen, Ashok K. Pandit, (2014). Statistical Assessment of Water Quality Parameters for Pollution Source Identification in Sukhnag Stream: An Inflow Stream of Lake Wular (Ramsar Site), Kashmir Himalaya, Journal of Ecosystems, ID 898054. | ||
| In article | View Article | ||
| [13] | Grace, B. L. (2014). Correlation Study of Physico-chemical Parameters and Biodiversity of Poonthura Backwater (Kerala, India). Applied Ecology and Environmental Sciences, 3(2): 42-50. | ||
| In article | |||
| [14] | Manohar and Manisha. (2013). Physicochemical Analysis of Flowing water of two rivers of the Pune city, Maharashtra , India , IJCR, Volume 5, Issue 2, pp 232-235. | ||
| In article | |||
| [15] | Banerjee, R and Ghosh, A R. (2012). Industrial effluents and their impact on water quality of receiving river: a study on the Damodar River system in West Bengal. International Journal of Engineering and Science Research. 2(7):669-676. | ||
| In article | |||
| [16] | APHA. (2012). Standard methods for the examination of water and waste water. American Public Health Association. 22nd Edn . Washington Dc. pp948. | ||
| In article | |||
| [17] | Dhirendra and Namita Agarwal. (2009). Assessment of the irrigational water quality of river Ganga in Haridwar district. Rasayan J Chem. 2(2): 285-292. | ||
| In article | |||
| [18] | Grace, B. L. (2007). Physico-chemical features of Veli lake- Southwest coast of India – Journal of industrial pollution control, 23(2): 307-312. | ||
| In article | |||
| [19] | Dinakaraan and Anabalagan. (2007). Anthropogenic impacts on aquatic insects In six streams of south Western Ghats .Journal of Insect Science. 7(37): 1-9. | ||
| In article | View Article PubMed | ||
| [20] | Grace, B. L. (2006). Veli Lake's Hydro-Geo Dynamics (Southwest Coast of India). Pollution research, 25(3), 469. | ||
| In article | |||
| [21] | Grace, B. L. (2006). Environmental characteristics of Kadinamkulam backwater in the southwest coast of India – Ecology Environment &Conservation, 12(3): 491-494. | ||
| In article | |||
| [22] | Anbalagan, Kaleeswaren and Balasubramanian (2004). Diversity and Trophic categorisation of aquatic insects of Courtallam hills of Western Ghats. Entomon. 29: 1-16. | ||
| In article | |||
| [23] | Parasher and Pandey. (2003). Physico-chemical and Microbiological studies of Ganga canal at Hardwar, during Kumba Period -1998. Him .J. Env. 17(2): 167-171. | ||
| In article | |||
Published with license by Science and Education Publishing, Copyright © 2021 Santhosh S.K., Anuja S.S., Athira S., Aparna A.S., Athira B. and Leena Grace Beslin
![]() This work is licensed under a Creative Commons Attribution 4.0 International License. To view a copy of this license, visit
http://creativecommons.org/licenses/by/4.0/
This work is licensed under a Creative Commons Attribution 4.0 International License. To view a copy of this license, visit
http://creativecommons.org/licenses/by/4.0/
| [1] | Mishra A, tripathi B.D. (2007). Seasonal and Temporal variations in physico-chemical and bacteriological characteristic’s of river Ganga in Varanasi. Curr World Environ, 2(2): 149-154. | ||
| In article | View Article | ||
| [2] | Ripaj Uddin, Md. Moazzem Hossain, Shakila Akter, Muhammad Edris Ali & Md. Aminul Ahsan. (2020). Assessment of some physicochemical parameters and determining the corrosive characteristics of the Karnaphuli estuarine water, Chittagong, Bangladesh, Water Science, 34:1, 164-180. | ||
| In article | View Article | ||
| [3] | Jackson Adiyiah Nyantakyi, Bernard Fei-Baffoe, Osei Akoto. (2020). Seasonal Variations in Physicochemical and Nutrient Water Quality of River Tano in Ghana, International Journal of Environmental Chemistry. 4(1): 1-12. | ||
| In article | View Article | ||
| [4] | Aregbe, E.A., O. S. Olonitola, H.I. Inabo, E.E. Ella and Ameso, V.C. (2018). Temporal and Spatial Physico-Chemical Parameters of Kubanni Dam, Galma Dam and Shika Dam, Zaria, Kaduna State, Nigeria. Int.J.Curr.Microbiol.App.Sci. 7(08): 812-822. | ||
| In article | View Article | ||
| [5] | Thamarai and Nirmala. (2017). A Comparative Analysis of Physicochemical parameters of Vaiga Reservoir and Pickup Dam , Theni District, Tamil Nadu, India, International Journal of Recent Scientific Research. 8 (7): 18635-18643. | ||
| In article | |||
| [6] | Mallika et al. (2017). Physico chemical and Bacteriological study of Vaiga River, Madurai, Tamil Nadu. International Journal of Fisheries and Aquatic Studies, 5 (1): 42-45. | ||
| In article | |||
| [7] | Khan and Chakrapani. (2017). Spatial and Temporal variations of Physicochemical and pollution of Ramganga River. Environmental Earth Science 76 (56): 231. | ||
| In article | View Article | ||
| [8] | Badusha M and S Santhosh (2017) Seasonal Effects of Water Quality Changes in Neyyar River, Kerala, India; Int J Sci Res Publ 7(7). | ||
| In article | |||
| [9] | Barman and Gupta. (2015). Aquatic insects as bioindicator of water quality – A study on Bakuamari stream, Chakrashila Wildlife Sanctuary, Assam and North East India. Journal of Entomology and zoology studies. 3(3): 178-186. | ||
| In article | |||
| [10] | Nidhi and Shrivastava. (2014). Comparative Review of Physicochemical Assessment of Pavana River. Journal of Environmental Science, Toxicology and Food Technology (IOSR-JESTFT), 8 (6)25-30. | ||
| In article | View Article | ||
| [11] | Grace, B. L. (2014). Water and Sediment Quality Assesment of Poonthura Backwater in the Southwest Coast of India.” American Journal of Marine Science, 2(2): 43-46. | ||
| In article | |||
| [12] | Salim Aijaz Bhat, Gowhar Meraj, Sayar Yaseen, Ashok K. Pandit, (2014). Statistical Assessment of Water Quality Parameters for Pollution Source Identification in Sukhnag Stream: An Inflow Stream of Lake Wular (Ramsar Site), Kashmir Himalaya, Journal of Ecosystems, ID 898054. | ||
| In article | View Article | ||
| [13] | Grace, B. L. (2014). Correlation Study of Physico-chemical Parameters and Biodiversity of Poonthura Backwater (Kerala, India). Applied Ecology and Environmental Sciences, 3(2): 42-50. | ||
| In article | |||
| [14] | Manohar and Manisha. (2013). Physicochemical Analysis of Flowing water of two rivers of the Pune city, Maharashtra , India , IJCR, Volume 5, Issue 2, pp 232-235. | ||
| In article | |||
| [15] | Banerjee, R and Ghosh, A R. (2012). Industrial effluents and their impact on water quality of receiving river: a study on the Damodar River system in West Bengal. International Journal of Engineering and Science Research. 2(7):669-676. | ||
| In article | |||
| [16] | APHA. (2012). Standard methods for the examination of water and waste water. American Public Health Association. 22nd Edn . Washington Dc. pp948. | ||
| In article | |||
| [17] | Dhirendra and Namita Agarwal. (2009). Assessment of the irrigational water quality of river Ganga in Haridwar district. Rasayan J Chem. 2(2): 285-292. | ||
| In article | |||
| [18] | Grace, B. L. (2007). Physico-chemical features of Veli lake- Southwest coast of India – Journal of industrial pollution control, 23(2): 307-312. | ||
| In article | |||
| [19] | Dinakaraan and Anabalagan. (2007). Anthropogenic impacts on aquatic insects In six streams of south Western Ghats .Journal of Insect Science. 7(37): 1-9. | ||
| In article | View Article PubMed | ||
| [20] | Grace, B. L. (2006). Veli Lake's Hydro-Geo Dynamics (Southwest Coast of India). Pollution research, 25(3), 469. | ||
| In article | |||
| [21] | Grace, B. L. (2006). Environmental characteristics of Kadinamkulam backwater in the southwest coast of India – Ecology Environment &Conservation, 12(3): 491-494. | ||
| In article | |||
| [22] | Anbalagan, Kaleeswaren and Balasubramanian (2004). Diversity and Trophic categorisation of aquatic insects of Courtallam hills of Western Ghats. Entomon. 29: 1-16. | ||
| In article | |||
| [23] | Parasher and Pandey. (2003). Physico-chemical and Microbiological studies of Ganga canal at Hardwar, during Kumba Period -1998. Him .J. Env. 17(2): 167-171. | ||
| In article | |||


