Climate change is a very hot topic nowadays, the impact of climate change on precipitation has attracted most of the scholars everywhere in the world. In this study, an attempt has been made to detect District and tehsil wise trend and variability of rainfall in Udaipur district of Rajasthan state (India) for 60 Years (1957-2016). For detecting the rainfall trend, the widely used, modified Mann-Kendall test was run at 5% significance level on time series data. Sen’s slope and the Coefficient of Variation (CV) was used for detecting trend magnitude and variability analysis respectively. Udaipur is found with positive trend, which means that rainfall in Udaipur has increasing trends over the years. At tehsil level, both increasing and decreasing trends have been observed. According to variability coefficient, 31.1 percent rainfall variability has been found in Udaipur district, whileat tehsil level, it varies between 30-42 percent.
Precipitation variability and change in rainfall are two major environmental challenges in the 21st century. Considering temperature rise, rainfall is very much predicted to be varied. Thus, it is a phenomenon that affects climate and men in terms of the physical aspects and social-economic aspects. Reduced and increased variability in rainfall reduces crop yield and threatens food security in low-income and agriculture-based economies 1. India is an agricultural economy exaggerated with monsoonal rainfall. About 60 percent of the population in India indulges in the agriculture sector, which contribute 14 percent of GDP. Despite the significance of rainfall in the country each year rainfall predictions go wrong.
IPCC Fourth Assessment Report 2 suggested detail regional analysis of rainfall variability. Rainfall variability and trend analysis helps determine whether the trend is increasing or decreasing or stable. Which can further assist us to control natural calamities like drought and flood conditions. This study focuses on 60 years of rainfall data analysis, in which several quantitative techniques are being used to calculate the trend and variability in the Udaipur district of Rajasthan.
The study was carried out in Udaipur district of Rajasthan, India. Udaipur is located between latitude 24°35′N to 24°58′N and longitude 73°41′E to 73°68′E. It has an average elevation of 598.00 m (1,962 feet). Udaipur is situated inthe southeastern part of Rajasthan over the Aravali mountain chain. It is bounded by Rajsamand and Pali districts in the north, Dungarpur, Banswara and Sabarkantha (Gujarat) districts in the south, Chittorgarh and Pratapgarh districts in the east and Sirohi district in the west. Udaipur falls under sub-tropical monsoon macro-climatic region. The climate of Udaipur district is mild throughout the year. The maximum temperatures ranges between 35 °C to 42 °C on most of the day during the summer season. The district annually receives around 631 mm of rainfall.
1. To find out the trend in annual rainfall data of 13 tehsils of Udaipur for a period of 60 years (1957-2016).
2. To find out the variability in annual rainfall data of 13 tehsils of Udaipur for a period of 60 years (1957-2016).
The rainfall data were collected from District Collectorate, Revenue Department, Meteorological department, web portal and also from other relevant sources. Data from 1957 to 2016 of 13 tehsils namely; Girwa, Gogunda, Vallabhgar, Kotra, Mavli, Jhadol, Salumber, Kherwara, Sarara, Rishabdev, Badgaon, Lasadiya and Semari of the district were collected to draw inferences. 3 tehsils are newly made namely: Badgaon, lasadiya and Semari, they don’t have enough data but those are included in results so they can be justified. Various methods of data analysis were employed in the study. Rainfall data as received from meteorological and Revenue department were analyzed usingMicrosoft Office Excel 2016 and SPSS 20.0. Details of methods are given below.
1. Data homogeneity test
Annual rainfall Data was analyzed using “Pettit’s homogeneity test” where assumed
H0: Data are homogeneous
Ha: There is a change in the data
2. Mann-Kendall test (Non-parametric)
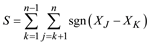 |
Where
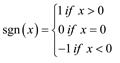 |
The mean of S is E(S)= 0 and the variance σ² is
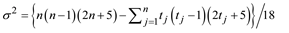 |
where p is the number of the tied groups in the data set and tj is the number of data points in the jth tied group. The statistic S is approximately normal distributed provided that the following Z-transformation is employed:
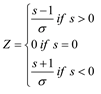 |
If ׀Zs׀is greater than Zα/2, where α represents the chosen significance level (E.g.: 5% with Z 0.025=1.96) then the Null hypothesis is invalid implying that the trend is significant 3.
3. Sen’s slope estimator
In addition to identify whether a trend exists, the magnitude of a trend was also estimated by a slope estimator β, which was extended by Hirsch et al. 4. β is the robust estimate of the trend magnitude. In other words, the slope estimator β is the median over all possible combinations of pairs for the whole data set 4. A positive value of β indicates an ‘upward trend’ (increasing values with time), while a negative value of β indicates a ‘downward trend’ 5, 6. This test computes both the slope (i.e. linear rate of change) and intercept according to Sen’s method. First, a set of linear slopes is calculated as follows:
 |
where d is the slope, X denotes the variable, n is the number of data, and I, j are indices. Sen’s slope is then calculated as the median from all slopes: b = Median dk. The intercepts are computed for each timestep t as given by and the corresponding intercept is as well the median of all intercepts.
 |
4. Coefficient of variance
The coefficient of variation (CV) is a measure of relative variability. It is the ratio of the standard deviation to the mean (average).
Coefficient of Variation = (Standard Deviation / Mean) * 100.In symbols:
 |
1. Data homogeneity test:
In Pettit’s test, it is clear that all the data series have the quality of homogeneity except one series of Mavli tehsil.
2. Analysis of annual rainfall:
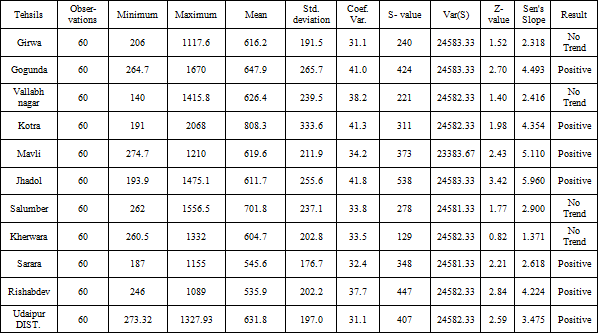
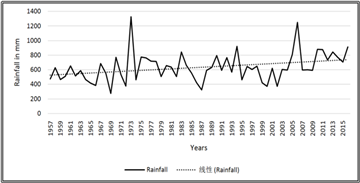
Rainfall is a vital factor, considering the fact that Udaipur is an important agricultural region. It also defines the cropping pattern, performance of various agricultural and cultural practices. The marked differences in its regional distribution have given rise to the disparity in the development of agriculture. Annual mean precipitation of the study region from 1957-2016 was found to be 631.79 mm. Table 1 depicts that the minimum and maximum recorded rainfall are 273.32 and 1327.93 mm during 1957-2016 in the district of Udaipur, respectively. A dramatic decreasing of precipitation was observed in 1984 and 1995 (Figure 1). However, an increasing of precipitation was observed at in 2003. At tehsil level, Kotra has the record of highest Rainfall (2068 mm) received in a year. Kotra tehsil also has highest annual mean rainfall (808.3mm) in Udaipur district. Rishabhdev tehsil on the other hand has lowest annual mean rainfall (535.9 mm).
3. Mann-Kendall test and Sen’s Slope Estimator:
In this particular study, Mann-Kendall’s test was used. Mann-Kendall’s test is a non-parametric test, which is less sensitive to outliers 7. This test computes the hypothesis of no trend versus the alternative hypothesis of the existence of increasing or decreasing trend. Table 1 shows stat behind the results, Z-value defines the trend as null hypothesis is invalid if the value of z is lower than 1.96. The results found for the rainfall data (1957-2016) designated that Udaipur as a whole district showed positive trends while tehsil wise results showed both “positive trend” and “no trend” results for different tehsils. Girwa, Vallabhnagar, Salumber and kherwara Tehsils reveals “No trend”. Other six tehsils Gogunda, Kotra, Mavli, Jhadol, Sarada and Rishabhdev found with “Positive trend”.
Table 1 is also showingthe Sen’s Slope, which is also indicating slope magnitude for each tehsil and the Udaipur district from 1957 to 2016 for 60 years. The Sen’s Slope value for Udaipur district is 3.475 which means Udaipur has increasing rainfall trend at 3.4 mm per year. All six tehsils Gogunda, Kotra, Mavli, Jhadol, Sarada and Rishabhdev found with “Positive trend” also has an increasing trend at 4.4mm, 4.3mm, 5.1mm, 5.9 mm, 2.6mm and 4.2mm per year respectively.
4. Coefficient of variation
Table 1. shows the coefficient of rainfall variation during the period of 1957 to 2016 in Udaipur district. The highest variation found inJhadol tehsil is 41.8 %, while Kotra tehsil has the coefficient of variation 41.3 %, which is the second highest in the district. Gogunda, Vallabhnagar, Mavli, Salumber, Kherwara, Sarada and have the coefficient of rainfall variation 41.0%, 38.2%, 34.2%, 33.8%, 33.5%, 32.4% and 37.7% respectively. The above table also indicates that Girwa tehsil has the lowest variationof 31.1%. Udaipur district on the other hand, has 31.1 percent variance.
Annual mean precipitation of the Udaipur district from 1957-2016 is 631.79 mm, where minimum and maximum recorded rainfall recorded as 273.32 and 1327.93 respectively. Both decreasing of precipitation and increasing of precipitation were observed in between the period. At tehsil level, Kotra has the record of highest Rainfall (2068 mm) received in a year. Kotra tehsil also has highest annual mean rainfall (808.3mm) in Udaipur district. Rishabhdev tehsil on the other hand has lowest annual mean rainfall (535.9 mm). The results found for the rainfall data (1957-2016) designated that Udaipur as a whole district showed positive trends while at tehsil level Girwa, Vallabhnagar, Salumber and kherwara Tehsils reveals “No trend”. Other six tehsils Gogunda, Kotra, Mavli, Jhadol, Sarada and Rishabhdev found with “Positive trend”. The Sen’s Slope value for Udaipur district is 3.475 which means Udaipur has increasing rainfall trend at 3.4 mm per year. All six tehsils Gogunda, Kotra, Mavli, Jhadol, Sarada and Rishabhdev found with “Positive trend” also has an increasing trend at 4.4mm, 4.3mm, 5.1mm, 5.9 mm, 2.6mm and 4.2mm per year respectively according to the Sen’s slope estimator. The highest variation found in Jhadol tehsil is 41.8 %, while Kotra tehsil has the coefficient of variation 41.3 %, which is the second highest in the district. Gogunda, Vallabhnagar, Mavli, Salumber, Kherwara, Sarada and have the coefficient of rainfall variation 41.0%, 38.2%, 34.2%, 33.8%, 33.5%, 32.4% and 37.7% respectively. Girwa tehsil has the lowest variation of 31.1%. Udaipur district on the other hand, has 31.1 percent variance.
| [1] | Meybeck, A. 2012. Risks, vulnerabilities and resilience in a context of climate change. In A. Meybeck, J., Lankoski, S., Redfern, N., Azzu& V., Gitz. Building resilience for adaptation to climate change in the agriculture sector. Proceedings of a joint FAO/OECD Workshop. Rome, FAO. | ||
| In article | |||
| [2] | IPCC (2007). Climate change 2007: climate change impacts, adaptation and vulnerability. Working Group II contribution to the Intergovernmental Panel on Climate Change Fourth Assessment Report. Summary for policymakers, 23 | ||
| In article | |||
| [3] | Kendall MG (1975). Rank Correlation Methods, 4th edition. Charles Griffin, London, U.K. | ||
| In article | |||
| [4] | Hirsch RM. Alexander RB. Smith RA (1991). Selection of methods for the detection and estimation of trends in water quality. Water Resources Research 27, 803-813. | ||
| In article | View Article | ||
| [5] | Xu ZX, Li JY, Liu CM (2007) Long term trend analysis for major climate variables in the Yellow River basin. Hydrol Process 21: 1935-1948. | ||
| In article | View Article | ||
| [6] | Karpouzos DK, Kavalieratou S, Babajimopoulos C (2010) Trend analysis of rainfall data in Pieria Region. European Water 30: 31-40 | ||
| In article | |||
| [7] | Mann HB, “Nonparametric tests against trend,” Econometrica, vol. 13, pp. 245-259, 1945. | ||
| In article | View Article | ||
| [8] | Ashok Salve (2008): A study of assured rainfall Characteristics in Pune District. The Deccan Geographers,vol.46.no 2, December 2008, pp 81-88. | ||
| In article | View Article | ||
| [9] | Ayalew D, Tesfaye K, Mamo G, Yitaferu B, Bayu W (2012). Variability of rainfall and its current trend in Amhara region, Ethiopia. Afr. J. Agric. Res. 7(10): 1475-1486. | ||
| In article | View Article | ||
| [10] | Das H.P. and Chaudhary A. (1992): Variability in rainfall Dispersion in Madhya Pradesh. Mausam, Vol. 43 No.1 pp. 29-36. | ||
| In article | |||
| [11] | Girma, E.; Tino, J.; Wayessa, G. Rainfall trend and variability analysis in Setema-Gatira area of Jimma, Southwestern Ethiopia. Afr. J. Agric. Res. 2016, 11, 3037-3045. | ||
| In article | View Article | ||
| [12] | Kumar, V., Singh, P. and Jain, S. K., Rainfall trends over Himachal Pradesh, Western Himalaya, India. Conference on Development of Hydro Power Projects-A Prospective Challenge, Shimla, 20-22 April 2005. | ||
| In article | |||
| [13] | Kundzewicz, Z. W. Change detection in hydrological records - a review of the methodology. Hydrol. Sci., J, 49(1), 2004, pp. 7-19. | ||
| In article | View Article | ||
| [14] | Pranuthi, G.,Dubey, S. K., Tripathi, S. K. and Chandniha, S.K. (2014). Trend and Change Point Detection of Precipitation in Urbanizing Districts of Uttarakhand. Indian J. Sci. Techn. | ||
| In article | |||
| [15] | Shamsudduha M., Chandler R.E., Taylor R.G. and Ahmed K.M., Recent trends in groundwater levels in a highly seasonal hydrological system: the Ganges-Brahmaputra- Meghna Delta, Hydrol. Earth Syst. Sci. Discuss., 13, 2373- 2385 (2009) | ||
| In article | View Article | ||
Published with license by Science and Education Publishing, Copyright © 2020 Dr. Manish Meena
![]() This work is licensed under a Creative Commons Attribution 4.0 International License. To view a copy of this license, visit
http://creativecommons.org/licenses/by/4.0/
This work is licensed under a Creative Commons Attribution 4.0 International License. To view a copy of this license, visit
http://creativecommons.org/licenses/by/4.0/
| [1] | Meybeck, A. 2012. Risks, vulnerabilities and resilience in a context of climate change. In A. Meybeck, J., Lankoski, S., Redfern, N., Azzu& V., Gitz. Building resilience for adaptation to climate change in the agriculture sector. Proceedings of a joint FAO/OECD Workshop. Rome, FAO. | ||
| In article | |||
| [2] | IPCC (2007). Climate change 2007: climate change impacts, adaptation and vulnerability. Working Group II contribution to the Intergovernmental Panel on Climate Change Fourth Assessment Report. Summary for policymakers, 23 | ||
| In article | |||
| [3] | Kendall MG (1975). Rank Correlation Methods, 4th edition. Charles Griffin, London, U.K. | ||
| In article | |||
| [4] | Hirsch RM. Alexander RB. Smith RA (1991). Selection of methods for the detection and estimation of trends in water quality. Water Resources Research 27, 803-813. | ||
| In article | View Article | ||
| [5] | Xu ZX, Li JY, Liu CM (2007) Long term trend analysis for major climate variables in the Yellow River basin. Hydrol Process 21: 1935-1948. | ||
| In article | View Article | ||
| [6] | Karpouzos DK, Kavalieratou S, Babajimopoulos C (2010) Trend analysis of rainfall data in Pieria Region. European Water 30: 31-40 | ||
| In article | |||
| [7] | Mann HB, “Nonparametric tests against trend,” Econometrica, vol. 13, pp. 245-259, 1945. | ||
| In article | View Article | ||
| [8] | Ashok Salve (2008): A study of assured rainfall Characteristics in Pune District. The Deccan Geographers,vol.46.no 2, December 2008, pp 81-88. | ||
| In article | View Article | ||
| [9] | Ayalew D, Tesfaye K, Mamo G, Yitaferu B, Bayu W (2012). Variability of rainfall and its current trend in Amhara region, Ethiopia. Afr. J. Agric. Res. 7(10): 1475-1486. | ||
| In article | View Article | ||
| [10] | Das H.P. and Chaudhary A. (1992): Variability in rainfall Dispersion in Madhya Pradesh. Mausam, Vol. 43 No.1 pp. 29-36. | ||
| In article | |||
| [11] | Girma, E.; Tino, J.; Wayessa, G. Rainfall trend and variability analysis in Setema-Gatira area of Jimma, Southwestern Ethiopia. Afr. J. Agric. Res. 2016, 11, 3037-3045. | ||
| In article | View Article | ||
| [12] | Kumar, V., Singh, P. and Jain, S. K., Rainfall trends over Himachal Pradesh, Western Himalaya, India. Conference on Development of Hydro Power Projects-A Prospective Challenge, Shimla, 20-22 April 2005. | ||
| In article | |||
| [13] | Kundzewicz, Z. W. Change detection in hydrological records - a review of the methodology. Hydrol. Sci., J, 49(1), 2004, pp. 7-19. | ||
| In article | View Article | ||
| [14] | Pranuthi, G.,Dubey, S. K., Tripathi, S. K. and Chandniha, S.K. (2014). Trend and Change Point Detection of Precipitation in Urbanizing Districts of Uttarakhand. Indian J. Sci. Techn. | ||
| In article | |||
| [15] | Shamsudduha M., Chandler R.E., Taylor R.G. and Ahmed K.M., Recent trends in groundwater levels in a highly seasonal hydrological system: the Ganges-Brahmaputra- Meghna Delta, Hydrol. Earth Syst. Sci. Discuss., 13, 2373- 2385 (2009) | ||
| In article | View Article | ||


