In modern chemistry education, interactive digital tools play a crucial role in enhancing student engagement and comprehension. This study presents pK explorer, an interactive online dashboard designed to facilitate the visualization and analysis of acid-base titration curves, as well as the pH-dependent behavior of key physicochemical parameters such as lipophilicity and solubility. Developed using R Shiny and Quarto, these dashboards provide a user-friendly interface where students can manipulate input variables and observe real-time graphical changes with ease, fostering a deeper understanding of complex chemical concepts. Traditional teaching methods often struggle to convey the dynamic nature of acid-base equilibria, particularly in relation to titration curve interpretation. By offering customizable inputs and interactive graphing, pK explorer allows students to explore the effects of dilution, ionic strength, and activity corrections on titration behavior. Furthermore, the dashboard extends beyond acid-base chemistry by integrating solubility and lipophilicity modeling, enabling students to examine how these properties vary with pH — a key concept in pharmaceutical and analytical chemistry. The combination of R Shiny’s computational power with Quarto’s flexible design framework results in an accessible and highly adaptable educational tool. This dashboard aligns with contemporary pedagogical approaches that emphasize interactive and student-driven learning experiences. By integrating technology into chemistry education, pK explorer serves as both a self-guided learning platform for students and a valuable teaching aid for instructors. The primary aim of this work is to promote the use of this open-access tool among educators and to encourage the development of more interactive, gamified educational resources that enhance learning experiences. The open-access nature of this tool ensures that it can be widely utilized and further developed by others to support diverse educational needs in chemistry, medicine, and related disciplines.
In the evolving landscape of chemistry education, the integration of technology into teaching methodologies has become increasingly crucial for enhancing student engagement and understanding at all levels of education. This article presents an online dashboard designed (primarily for undergraduate level) as an interactive tool for exploring the complexities of analytic chemistry, with a particular focus on acid-base titration curves. Through this platform, we aim to address the common challenges students face in grasping fundamental concepts and analyzing data representations, which often appear daunting due to their abstract nature.
Interactive online tools have become vital components in modern digital education, significantly enhancing student engagement, motivation, and comprehension across diverse disciplines. These tools — ranging from simulations, gamified platforms, and discussion forums to real-time quizzes and adaptive learning systems — cater to varied learning styles, promote active participation, and foster deeper conceptual understanding. Research highlights the efficacy of interactive elements in boosting learning outcomes; for example, in a network meta-analysis 1 results showed that interactive learning environments improved students’ problem-solving skills in science education compared to conventional teaching. Similarly, another study 2 demonstrated that real-time formative feedback tools enhanced student attention and retention, and they also highlight the need for interactive elements, gamified incentives, or embedded analytics that encourage consistent engagement. Moreover, adaptive learning platforms that adjust content based on learner performance, such as those studied recently 3, have been shown to improve learning outcome, motivation and cognitive engagement, particularly among students requiring personalized support. As digital education continues to expand, integrating well-designed interactive tools is essential for building responsive, inclusive, and effective learning environments.
Acid-base titrations are fundamental experiments in chemistry, yet many students struggle with visualizing and interpreting the resulting titration curves. Traditional pedagogical approaches may fall short in conveying the dynamic interplay of variables that govern these curves. In understanding these analytical and physical chemistry concepts many times students are not engaged well enough with the subjects matter and fail to critically analyze graphs because of their seeming complexity and abstract nature. Providing an online dashboard in which students can freely configure the display and play around with the graphs provides a much better understanding and builds intuition on how these physical concepts work. By providing this interactive dashboard, we empower students to customize numeric inputs and actively engage with real-time graph generation. This hands-on experience fosters a deeper understanding and builds intuition regarding the relationship between chemical properties and graphical representations.
Leveraging the capabilities of R Shiny for functionality, Quarto for responsive design, and the Plotly library for interactive graphing, this dashboard transforms the learning experience. Students can explore different titration scenarios, zoom in and out of graphs, pan across data, and directly interpret results within the interface. The presented tool not only demystifies the intricacies of acid-base titration curves but also aligns with contemporary educational practices that prioritize interactivity and personalized learning. By harnessing these technologies, we hope to enrich the educational journey for students at all levels, facilitating a robust comprehension of key concepts in analytical chemistry.
In this work, the structure of the interactive dashboard is presented, detailing its design and functionality while illustrating practical pedagogical examples that highlight its application in educational settings. The dashboard is meticulously crafted to be user-friendly, allowing students to seamlessly navigate through different titration scenarios while enriching their appreciation of acid-base chemistry. By incorporating diverse educational examples, we aim to demonstrate how this tool not only serves as a platform for interactive learning but also as a resource for instructors to facilitate deeper discussions around complex concepts.
Beyond acid-base titrations, the scope of this dashboard is further expanded to visualize pH-dependence curves relating to key physicochemical parameters like lipophilicity and solubility. Understanding these parameters is essential in several fields, including medicinal chemistry, pharmaceutical analysis, and chemical engineering. By allowing students to graph these pH-dependent relationships, the dashboard serves to bridge theoretical knowledge with practical applications in real-world scenarios. Students can investigate how changes in pH influence the solubility and lipophilicity of various compounds, fostering critical thinking and encouraging them to ponder the implications of their findings within the context of pharmaceutical research and development.
Through this innovative dashboard, we aim to cultivate a comprehensive learning environment that equips students with both the theoretical framework and practical skills necessary for success in their future careers. The integration of real-time interactivity combined with practical examples empowers learners to critically engage with the subject matter, encouraging a more profound and intuitive grasp of core chemical concepts that extend beyond traditional classroom boundaries.
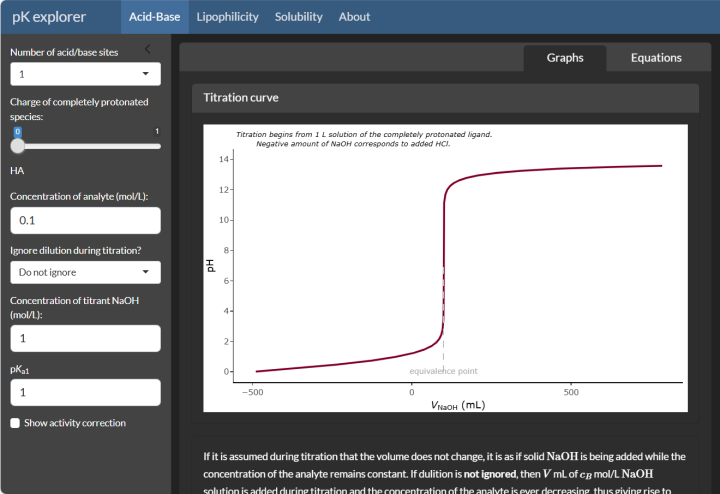
In Figure 1 the layout of the dashboard is presented. The top bar contains tabs for the various physicochemical parameters in consideration. One can navigate between the visualization of acid-base, lipophilicity, and solubility curves. Further tabs can be added according to the capabilities of Quarto. The last tab (“About”) contains references and the description of the dashboard itself. The left side panel contains primary numeric inputs that are needed for the curve generation: the number of acid-base sites, the charge of the completely protonated chemical species, and the pKa values themselves. This left side panel remains visible throughout the entire dashboard, as the pKa values are required for the lipophilicity and solubility calculations as well, however this panel can be minimized if necessary.

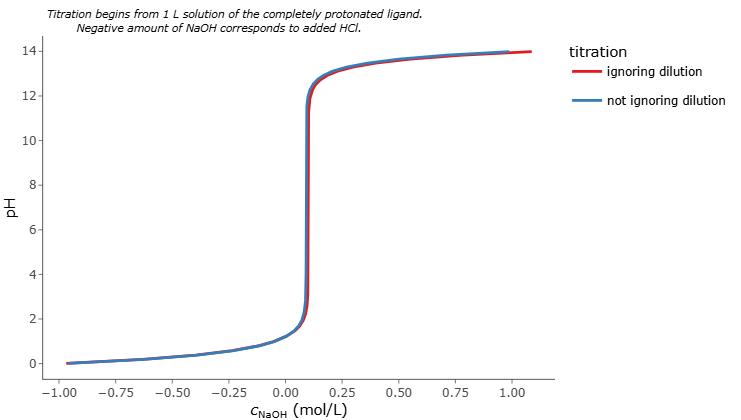
The left side panel also contains certain configurations pertaining to the acid-base titration curves. The concentration of the analyte (titrand) and that of the titrant can be chosen and these effects visualized on the titration curve. Adjusting a titrant concentration presumes that dilution during titration cannot be ignored. This configuration can be chosen and both curves visualized (with and without ignoring dilution). This provides a chance for students to see in which circumstances and at what concentrations can this effect be ignored (Figure 2).
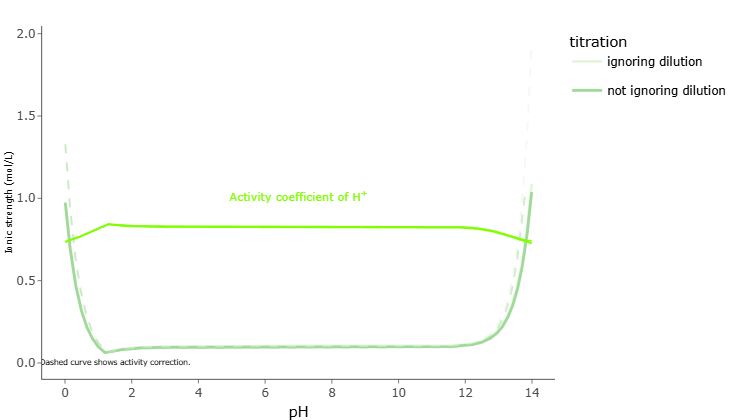
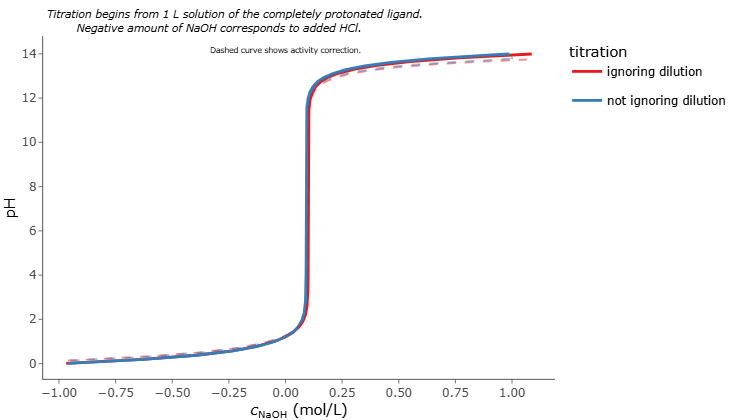
One other example of providing interactive learning opportunities is the option to visualize activity correction for the acid-base graphs. Oftentimes the discussion of activity coefficients further complicates matters of analytical chemistry understanding. The activity coefficient is not seriously discussed in relation to acid-base equilibria as it is assumed it can be ignored. This dashboard provides an opportunity to visualize why this is the case (Figure 3 and Figure 4) and the underlying equations are clearly and concisely presented in the subtab for “Equations”.


Further graphs that are presented in the “Acid-Base” tab are that of buffer intensity, distribution of different protonated species, and the average charge of the species.
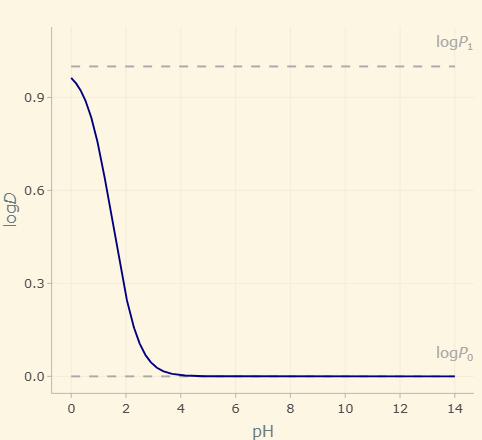
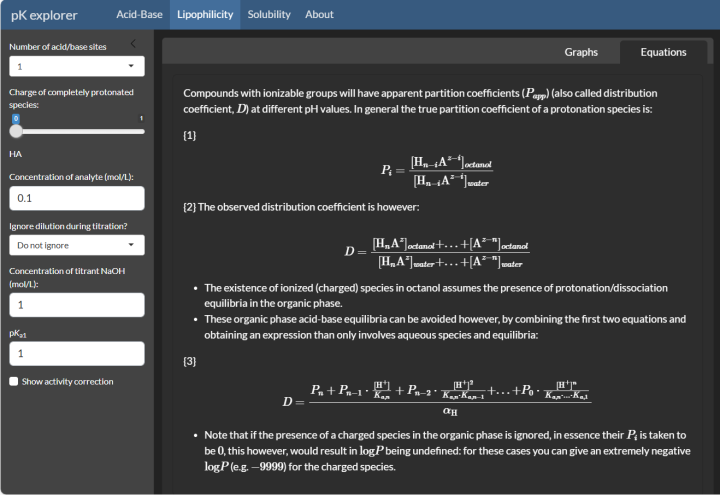
Switching to the “Lipophilicity” or “Solubility” tabs, the given pKa values are retained and new inputs are required. The intrinsic lipophilicity/solubility of the different protonated species can be adjusted and the effect on the pH-dependence curves can be inspected. In the example of Figure 5 the limiting logP values of the species can be seen and how the apparent logD will vary with pH. The actual lipophilicity values at different pH values can be read by hovering over with the cursor on the curve, therefore inferences can be made on drug absorption in various physiological conditions (e.g. acidic medium of the stomach, basic medium of the intestines, or near-neutral blood plasma). These tabs also contain subtabs presenting the underlying equations necessary for the calculation of the curves, together with pointers on how to input various values for the protonated species (Figure 6). Naturally, the interactive nature of the dashboard can only be appreciated by visiting the website, therefore in the next section the code and software tools are presented that were used during the creation of the website.

The R language and environment 4 was used to write the code for the dashboard in the R Studio 5 integrated development environment (Posit, Boston, MA, USA). Some knowledge of R programming is useful for creating online dashboards, however with a basic familiarity of R and the use of helpful vignettes created for Shiny Web Apps 6 and Quarto 7 documents, anyone can create interactive demonstrations with ease. The Shiny Web App 8 framework for R provides a very intuitive platform for creating interactive presentations with data. There are many helpful vignettes 9 that can be used as a step-by-step guide. The main structure of such an app is composed of (1) a user interface (ui), in which the layout and elements of the dashboard can be constructed using available elements (such as numeric inputs, action buttons, etc.), and (2) a server, which contains all the back end calculations necessary for the data generation, analysis and visualization. The Quarto environment is very similar to that of Shiny, however there are more possibilities in designing the layout of the dashboard. The general structure of containing a ui and a server is preserved, however the flow of user interface elements throughout the code provides much greater capabilities. Examples with helpful codes can be found on their website 10. The ui capabilities of Quarto make possible the creation of multiple layers (using tabs) on the dashboard. One other remarkable feature of the Quarto ui is the use of reactive objects, which means the layout or content of a certain ui element reacts to changes elsewhere on the dashboard. For example in this dashboard the numeric input for titrant concentration is only present on the left side panel if the option of ‘not ignoring dilution’ is chosen. It could be recommended to start with building a Shiny App first to become familiar with the basic structure of these web applications before one attempts to build a Quarto dashboard. The thorough study of the Quarto Guide 11 is highly recommended for best results. The Quarto environment is also available with the Python, Julia, and Observable languages as well.
The code architecture of pK explorer is an interactive, modular web-based application that adheres to a client–server paradigm, where the ui is declaratively defined using the quarto::dashboard layout in R Markdown, and the server logic is implemented reactively to support dynamic computation and rendering. An itemized overview is presented:
• User interface layer the ui is composed of sidebar inputs and tabbed visual panels:
○ Input controls: Widgets such as selectInput, sliderInput, and numericInput allow students to define chemical properties (e.g., number of acidic sites, total concentration, charge state, dissociation constants).
○ Dynamic ui generation: Inputs for pKa, logP, and solubility (S) values are generated using renderUI based on user-specified parameters, allowing tailored simulations of polyprotic acids and their derivatives.
○ Visualization panels: Each chemistry module (acid–base, lipophilicity, solubility) is organized into tabsets. Within each, plotlyOutput renders interactive plots of calculated properties across a pH range, enabling immediate visual feedback.
• Server layer the server-side logic uses R’s reactive programming paradigm:
○ Reactive expressions: Core chemical computations, including ionization equilibria, buffer intensity, and ionic strength (I), are handled by reactive functions. These computations rely on numerical solvers (nleqslv) for simultaneous nonlinear equations.
○ Plot rendering: The renderPlotly functions build plots with ggplot2, which are converted to interactive plots using plotly, allowing user exploration of theoretical outputs such as titration curves, charge distributions, and activity corrections.
○ Conditional logic: Observers (observeEvent) manage dynamic ui updates, such as showing additional inputs when dilution is considered, and toggling plots to reflect corrections due to ionic activity.
• Educational features the pedagogical strength lies in:
○ Model transparency: All core chemical equations, from ion balance to Debye-Hückel activity corrections, are embedded and explained directly in the dashboard, enhancing conceptual understanding.
○ Simulative power: Users can simulate different titration scenarios (e.g., with/without dilution), visualize species distribution, and explore non-ideal behavior by toggling activity corrections.
○ Multi-concept integration: The tool not only handles equilibrium chemistry but also connects it to biopharmaceutical properties (e.g., logD, solubility), making it versatile for pharmaceutical and general chemistry courses.
3.2. Derivation of Chemical EquationsThe chemistry calculations used in the server section of the dashboard were done based on the recommendations of Harald Kalka 12 with minor adjustments. The mathematical calculations pertaining to solutions gave rise to Aqion 13, an online service and software package that allows the comprehensive simulation and calculation of pH and hydrochemistry related quantities. For the calculation of lipophilicity and solubility curves the guidelines of Avdeef 14 were followed. After the code was assembled, publication was readily available via the R Studio IDE. The dashboard is hosted by the shinyapps.io 15 server, which provides a free plan option for maintaining web apps with certain limitations on data traffic. The dashboard is updated regularly on Quarto Pub 16 as well as GitHub 17, where the entire code and its supplementary documents are available. The dashboard can be accessed via https://pdujnv-mirzahosseini0arash0semmelweis.shinyapps.io/titr_quarto/, while the GitHub repository can be found at https://github.com/mirzahosseini-arash-semmelweis/pK-explorer.
A brief itemized description of the core equations used in pK explorer is depicted below:
1. Ion product of water
 |
2. Acid dissociation constant (stepwise)
 |
3. Ionization fractions
 |
where
 |
4. Ion charge balance (assuming titration with NaOH titrant)
 |
5. Unified titration equation (without dilution)
 |
6. Unified titration equation (with dilution, where V is the mL of added titrant)
 |
7. Buffer intensity
 |
8. Average charge
 |
9. Activity coefficient models
9.a. Debye-Hückel
 |
9.b. Extended Debye-Hückel
 |
9.c. Davies
 |
10. Activity definition
 |
11. Thermodynamic vs. conditional dissociation constants
 |
 |
12. Modified ionization fractions (with activity)
 |
 |
13. Modified unified titration equation (with activity)

14. Partition coefficient (logP)
 |
15. Distribution coefficient (logD)
 |
16. Thermodynamic solubility (logS)
 |
17. Solubility limitation condition
 |
The unified equation of titration can be derived from the definitions of water autoprotolysis and acid dissociation constants, and ultimately used to simulate titration curves for every known pH value, i.e. calculation of cB from  is an easier task than the numerically demanding reverse direction calculation. In aqueous solutions with charged species (ions) however, electromagnetic interaction causes the effective concentration of the species to be measured as smaller compared to their molar concentrations. This effective concentration is characterized with the dimensionless quantity called activity (ai), which can be calculated with the help of the activity coefficient
  . In this work the Extended Debye-Hückel model is applied (note that in this equation ai represents not activity, but the distance of closest approach of ions, or empirical ionic radius). In order to calculate the activity coefficient however, the ionic strength needs to be calculated, which in turn depends on the molar concentrations. Therefore, a Broyden Secant method or full Newton method, where the Jacobian matrix of derivatives is recalculated at each iteration, is used to solve the system of nonlinear equations 18 and arrive at the modified equations. Finally, the lipophilicity and solubility quantities can be calculated using the ionization fractions at every pH, provided the intrinsic lipophilicity and solubility values of the species in given. These values can be input by the students, however for better use these values are initialized.
The integration of interactive dashboards into analytical and physical chemistry education offers a powerful approach to enhancing student engagement and comprehension, especially augmenting the fields of pharmaceutical and medicinal chemistry. The pK explorer dashboard, developed using Quarto, provides an intuitive and dynamic platform for visualizing acid-base titration curves, lipophilicity, and solubility as functions of pH. By enabling real-time interaction with key physicochemical parameters, this tool allows students to actively explore and better understand complex concepts pertaining to molecular behavior that are often difficult to grasp through static representations alone.
The dashboard’s ability to illustrate critical effects — such as dilution during titration, activity corrections, and pH-dependent solubility — demonstrates the advantages of technology-driven learning. Through customizable inputs and interactive graphing, students can gain deeper insights into the relationships between chemical properties and experimental outcomes. Furthermore, this tool serves not only as a valuable educational resource for students but also as a teaching aid for instructors, supporting a more engaging, colorful and inquiry-driven learning experience.
Beyond its application in acid-base chemistry, the pK explorer can be expanded to incorporate additional functionalities, such as pharmacokinetic modeling, buffer capacity analysis, or other key concepts in medicinal and analytical chemistry. By leveraging modern web-based technologies, this platform aligns with contemporary educational trends that prioritize accessibility, interactivity, and personalized learning experiences.
At the present stage, the educational impact of pK explorer has been assessed primarily through its pedagogical design, classroom usability, and alignment with interactive learning principles, rather than through a formal controlled learning-efficacy study. During instructional use, the dashboard was intended to support exploratory, student-driven interpretation of acid–base, lipophilicity, and solubility curves by allowing learners to modify parameters and immediately observe the resulting graphical changes. This type of use was particularly valuable for guiding discussion around concepts that are often difficult to internalize from static textbook figures alone, such as dilution effects, activity corrections, species distribution, buffer intensity, and pH-dependent molecular properties. Nevertheless, systematic student evaluation data, quantitative engagement analytics, and direct comparison with conventional instruction remain important limitations of the present work. Future implementation will therefore include structured student feedback questionnaires, pre- and post-activity concept checks, usability assessment, and, where possible, comparison of learning outcomes between students using the dashboard and those receiving standard instruction. During real classroom use, students appeared to benefit substantially from the interactive format, as the dashboard performed reliably during live teaching sessions and supported active discussion, immediate visual feedback, and more confident interpretation of pH-dependent chemical behavior.
Future developments may include further refinement of the user interface, integration of additional chemical simulations, and broader adoption in chemistry curricula. In the future the dashboard could be augmented with a chemical structure drawing module, which can predict pKa values that are used as inputs for the curves. The protonated moieties on the various functional group of the molecule would lend themselves to depicting group-specific pKa values as well. Furthermore, the titration graphs could be extended to show conductometry or complexometry titrations as well. With continued enhancements, dashboards of this kind have the potential to become a cornerstone tool for chemistry education, helping students bridge the gap between theoretical knowledge and practical application in scientific research and industry. The key strength of this dashboard lies in its adaptability — any educator can design a similar interactive simulation tailored to their specific teaching objectives, fostering deeper student engagement and motivation.
The author declares no conflict of interest.
Ethics, Consent to Participate, and Consent to Publish declarations: not applicable.
This study was funded by the grant of the Higher Education Institutional Excellence Programme within the Framework of the Molecular Biology Thematic Programme of Semmelweis University (TKP2021-EGA-24), and the János Bolyai Research Scholarship of the Hungarian Academy of Sciences.
| [1] | Koç, A., Kanadlı, S, "Effect of interactive learning environments on learning outcomes in science education: A network meta-analysis," Journal of Science Education and Technology, 34, 681-703, Feb 2025. | ||
| In article | View Article | ||
| [2] | McKenna, B. A., Kopittke, P. M, "Engagement and performance in a first year natural resource science course," Journal of Computer Assisted Learning, 34, 233-242, Feb 2018. | ||
| In article | View Article | ||
| [3] | Honke, N., Becker-Genschow, S, "Adaptive learning in bionics: Transforming science education," Frontiers in Education, 10, 1427083, Feb 2025. | ||
| In article | View Article | ||
| [4] | R Core Team, "R: A language and environment for statistical computing, " R Foundation for Statistical Computing, Vienna, Austria, 2023. | ||
| In article | |||
| [5] | Posit, R studio IDE, https://posit.co/ accessed April 4, 2025. | ||
| In article | |||
| [6] | Posit, Shiny, https://shiny.posit.co/ accessed April 4, 2025. | ||
| In article | |||
| [7] | Posit, Quarto, https://quarto.org/ accessed April 4, 2025. | ||
| In article | |||
| [8] | Chang, W., Cheng J., Allaire J.J., Sievert C., Schloerke B., Xie Y., Allen J., McPherson J., Dipert A., Borges B, Shiny: Web application framework for R, R package version 1.10.0, 2024. | ||
| In article | |||
| [9] | Wildfire J, Intro to shiny app, https://cloud.r-project.org/ web/ packages/safetyGraphics/vignettes/Intro.html, 2022. | ||
| In article | |||
| [10] | Posit, Quarto gallery, https://quarto.org/docs/gallery/ accessed April 4, 2025. | ||
| In article | |||
| [11] | Posit, Quarto guide, https://quarto.org/docs/guide/ accessed April 4, 2025. | ||
| In article | |||
| [12] | Kalka, H, "Acid-base systems — math background," https:// www.aqion.de/file/acid-base-systems.pdf, 2023. | ||
| In article | |||
| [13] | Aqion, https://www.aqion.de/ accessed April 4, 2025. | ||
| In article | |||
| [14] | Avdeef, A, "Physicochemical profiling (solubility, permeability and charge state)," Current Topics in Medicinal Chemistry, 1 (4), 277-351, 2001. | ||
| In article | View Article PubMed | ||
| [15] | Posit, Shinyapps.io, https://www.shinyapps.io/ accessed April 4, 2025. | ||
| In article | |||
| [16] | Posit, Quarto pub, https://quartopub.com/ accessed April 4, 2025. | ||
| In article | |||
| [17] | GitHub, pK explorer repository, https://github.com/mirzahosseini-arash-semmelweis/pK-explorer accessed April 4, 2025. | ||
| In article | |||
| [18] | Hasselman, B, Nleqslv: Solve systems of nonlinear equations, R package version 3.3.5, 2023. | ||
| In article | |||
Published with license by Science and Education Publishing, Copyright © 2026 Arash Mirzahosseini
 This work is licensed under a Creative Commons Attribution 4.0 International License. To view a copy of this license, visit
http://creativecommons.org/licenses/by/4.0/
This work is licensed under a Creative Commons Attribution 4.0 International License. To view a copy of this license, visit
http://creativecommons.org/licenses/by/4.0/
| [1] | Koç, A., Kanadlı, S, "Effect of interactive learning environments on learning outcomes in science education: A network meta-analysis," Journal of Science Education and Technology, 34, 681-703, Feb 2025. | ||
| In article | View Article | ||
| [2] | McKenna, B. A., Kopittke, P. M, "Engagement and performance in a first year natural resource science course," Journal of Computer Assisted Learning, 34, 233-242, Feb 2018. | ||
| In article | View Article | ||
| [3] | Honke, N., Becker-Genschow, S, "Adaptive learning in bionics: Transforming science education," Frontiers in Education, 10, 1427083, Feb 2025. | ||
| In article | View Article | ||
| [4] | R Core Team, "R: A language and environment for statistical computing, " R Foundation for Statistical Computing, Vienna, Austria, 2023. | ||
| In article | |||
| [5] | Posit, R studio IDE, https://posit.co/ accessed April 4, 2025. | ||
| In article | |||
| [6] | Posit, Shiny, https://shiny.posit.co/ accessed April 4, 2025. | ||
| In article | |||
| [7] | Posit, Quarto, https://quarto.org/ accessed April 4, 2025. | ||
| In article | |||
| [8] | Chang, W., Cheng J., Allaire J.J., Sievert C., Schloerke B., Xie Y., Allen J., McPherson J., Dipert A., Borges B, Shiny: Web application framework for R, R package version 1.10.0, 2024. | ||
| In article | |||
| [9] | Wildfire J, Intro to shiny app, https://cloud.r-project.org/ web/ packages/safetyGraphics/vignettes/Intro.html, 2022. | ||
| In article | |||
| [10] | Posit, Quarto gallery, https://quarto.org/docs/gallery/ accessed April 4, 2025. | ||
| In article | |||
| [11] | Posit, Quarto guide, https://quarto.org/docs/guide/ accessed April 4, 2025. | ||
| In article | |||
| [12] | Kalka, H, "Acid-base systems — math background," https:// www.aqion.de/file/acid-base-systems.pdf, 2023. | ||
| In article | |||
| [13] | Aqion, https://www.aqion.de/ accessed April 4, 2025. | ||
| In article | |||
| [14] | Avdeef, A, "Physicochemical profiling (solubility, permeability and charge state)," Current Topics in Medicinal Chemistry, 1 (4), 277-351, 2001. | ||
| In article | View Article PubMed | ||
| [15] | Posit, Shinyapps.io, https://www.shinyapps.io/ accessed April 4, 2025. | ||
| In article | |||
| [16] | Posit, Quarto pub, https://quartopub.com/ accessed April 4, 2025. | ||
| In article | |||
| [17] | GitHub, pK explorer repository, https://github.com/mirzahosseini-arash-semmelweis/pK-explorer accessed April 4, 2025. | ||
| In article | |||
| [18] | Hasselman, B, Nleqslv: Solve systems of nonlinear equations, R package version 3.3.5, 2023. | ||
| In article | |||