Crosswind can displace agricultural spray droplets from their intended target and alter both ground deposition and the vertical distribution of airborne droplets. This study developed a transient computational fluid dynamics-discrete phase model (CFD-DPM) for a single ST110-03 flat-fan nozzle and evaluated its deposition trends against controlled indoor experiments. Two nozzle heights (0.875 and 1.25 m), three crosswind speeds (2, 3, and 4 m s⁻¹), and a spray pressure of 0.4 MPa were investigated. Ground collectors quantified downwind deposition, while five cotton strings placed 2 m downstream at heights of 0.40-0.80 m characterized vertical interception. Ground-collector trials were conducted for 10 min per run, whereas cotton-string sampling used 60 s exposures; each tested experimental condition was independently repeated three times. The CFD domain was 7 m × 2 m × 2 m and contained approximately 1.98 million tetrahedral cells. A realizable k-ε model described the continuous phase, and the measured spray was represented by nine fan directions and three droplet groups (75.29, 206.23, and 336.57 μm). Droplets were injected for 20 s and tracked to 22 s. At a nozzle height of 1.25 m, the measured ground drift fraction increased from 25.57% to 43.31% as crosswind speed increased, while the simulated fraction increased from 42.04% to 51.73%. Across five matched ground cases, experimental and simulated fractions were strongly correlated (r = 0.922), although the mean absolute error was 16.39 percentage points. The model reproduced several vertical-distribution tendencies but substantially overpredicted cotton-string capture in selected cases. The model is therefore suitable for qualitative interpretation and relative trend analysis, but its simplified angular injection and ideal trapping boundaries require refinement before quantitative prediction.
Agricultural spraying depends on the controlled delivery of droplets to a target surface. A fraction of the released liquid may be transported away from the intended area by ambient airflow, increasing chemical loss and potential exposure of non-target organisms. Wind speed, release height, nozzle type, operating pressure, and droplet-size distribution are among the principal factors governing this process 1, 2, 3, 4. Test-bench and field studies have shown that increased release height and the use of finer sprays generally increase drift potential, whereas drift-reducing nozzles and lower boom heights can reduce off-target transport 3, 4.
Experiments provide direct evidence of deposition but cannot readily resolve every droplet trajectory or isolate all coupled mechanisms. Mechanistic models have therefore been developed to complement measurements. Three-dimensional CFD has been used to describe the interaction between the carrier airflow and discrete spray droplets 5, while reduced-order diffusion-advection and real-time models have been proposed for operational drift assessment 6, 7, 8. More recent Lagrangian models incorporate atomization, turbulent dispersion, and evaporation 9, 10. These studies demonstrate that model output depends strongly on the representation of the source droplet spectrum, airflow, turbulence, and boundary interaction.
CFD-DPM is particularly useful when the goal is to compare droplet trajectories and deposition patterns under controlled boundary conditions. However, direct quantitative validation remains challenging because predictions can be sensitive to droplet-size and velocity representation, turbulent dispersion, evaporation, and source description 11, 12, 13. In the present configuration, additional uncertainties may arise from ideal wall trapping on the cotton strings, the use of three discrete droplet sizes and nine fixed directions, and the use of a nominal inlet wind speed. Consequently, agreement in trend and agreement in absolute deposition should be evaluated separately.
The objective of this study was to evaluate whether a transient CFD-DPM model could reproduce the effects of crosswind speed and nozzle height on spray deposition from a single standard flat-fan nozzle. Ground deposition and vertical cotton-string interception were measured in a controlled indoor crosswind platform and compared with six numerical conditions. The study focuses on (i) ground deposition within a matched monitoring area, (ii) the vertical distribution of droplets intercepted 2 m downstream, and (iii) the relationship between release height, crosswind speed, and simulated trajectories. Rather than treating the model as a calibrated absolute predictor, the analysis identifies where the simplified DPM representation captures experimental tendencies and where further model refinement is needed.
Experiments were conducted in an indoor agricultural spray facility at Jiangsu University. The platform consisted of a water-supply and pressure-regulation system, an adjustable nozzle support, a crosswind generator with a flow-straightening section, and ground and vertical sampling systems. Clean water was sprayed through an ST110-03 standard flat-fan nozzle with a nominal fan angle of 110°. Spray pressure was maintained at 0.4 MPa for all conditions used in the CFD comparison. The measured nozzle flow rate was 1.460 L min⁻¹ (0.024333 kg s⁻¹).
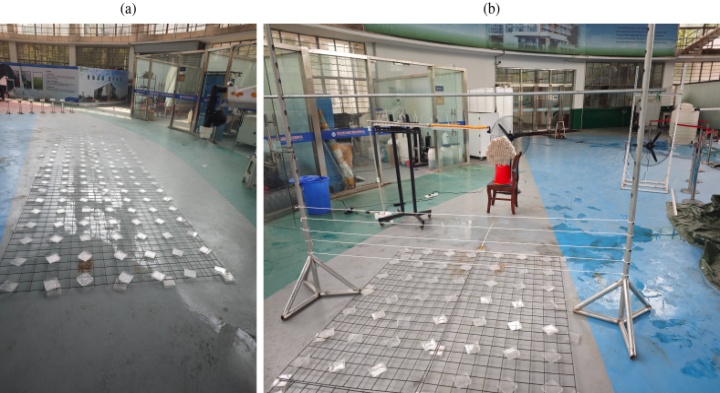
Six matched conditions were defined. G1-G3 used a nozzle height of 1.25 m and crosswind speeds of 2, 3, and 4 m s⁻¹, respectively. G4-G6 used a nozzle height of 0.875 m at the same three crosswind speeds. The six matched conditions therefore constituted a two-parameter investigation in which crosswind speed and nozzle release height were varied systematically, while nozzle type and spray pressure were held constant. Before spraying, wind speed was checked in a 2 m × 2 m plane using nine measurement points. Each point was measured three times, and the mean was used to assess the cross-section. Additional centerline measurements showed that the wind speed decreased with downstream distance; this spatial decay is considered when interpreting differences between the experiment and the idealized numerical inlet. The experimental setup and sampling arrangements are shown in Figure 1.

Ground collectors occupied a monitoring region corresponding to x = 2-7 m and z = -0.95 to 0.95 m in the CFD coordinate system, giving a plan area of 9.50 m². Collector masses were recorded before and after spraying, and negative net deposition after background subtraction was treated as zero. Each collector had a 0.01 m² opening; net masses were weighted using representative areas of 0.09 m² for internal collectors, 0.06 m² for edge collectors, and 0.04 m² for corner collectors. Each available ground condition was sprayed for 10 min and independently repeated three times. The ground drift fraction was calculated separately for each repeat as the deposited mass represented by the sampling grid divided by the total sprayed mass, and the fractions are reported as mean ± sample standard deviation (SD, n = 3).
A vertical sampling frame was positioned 2 m downstream of the nozzle. Five horizontal cotton strings (x1–x5), each 4.0 mm in diameter and 1.9 m in effective length, were placed at heights of 0.40, 0.50, 0.60, 0.70, and 0.80 m. Each cotton-string condition was sampled for 60 s and independently repeated three times, and the results are reported as mean ± standard deviation (SD, n = 3).
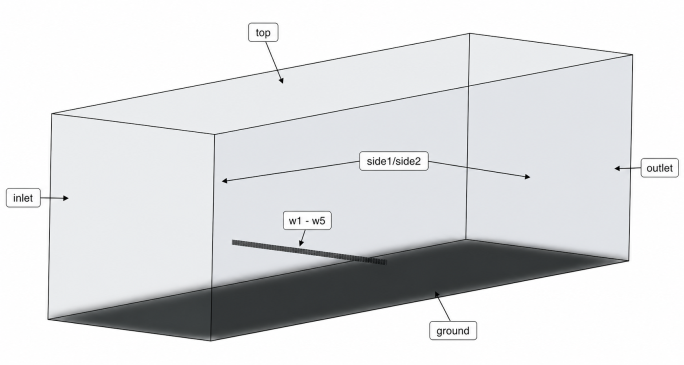
A three-dimensional computational domain measuring 7 m × 2 m × 2 m was constructed to reproduce the experimental layout. The nozzle was located 1 m downstream of the inlet at the experimental release height. The five cotton strings were represented as cylindrical internal wall surfaces with a nominal diameter of 4.0 mm, consistent with the experimental sampling strings. Their effective length was 1.9 m, and they were positioned 2 m downstream at the x1–x5 heights defined in Section 2.2. A velocity inlet prescribed the nominal crosswind, and a pressure outlet was used at the downstream boundary. The top and lateral boundaries were treated as open boundaries at zero gauge pressure. Ground and cotton-string walls used a trap condition for the discrete phase, whereas droplets reaching the outlet or open boundaries were allowed to escape.

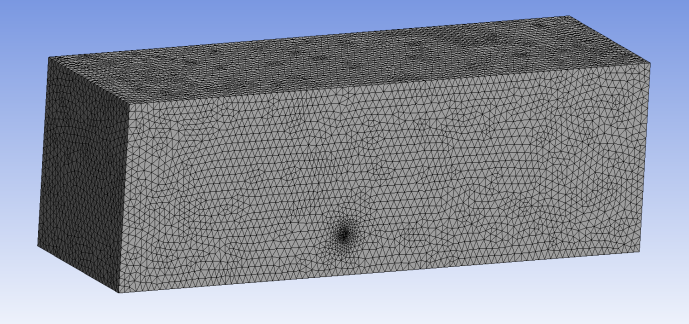
The computational grid was generated with the Patch Conforming algorithm using unstructured tetrahedral cells. Local refinement was applied near the nozzle and cotton strings. Five meshes containing approximately 1.0-3.0 million cells were assessed using the integrated DPM accretion on the ground monitoring region and the sum over the five strings. Beyond approximately 1.97 million cells, further refinement changed the ground result by less than 4% and the string total by less than 6%. The selected mesh contained 348,357 nodes and 1,975,303 cells, with an average cell quality of 0.83888 and a minimum quality of 0.16599. The global cell size was 0.08 m and the local cell size at the string surfaces was 0.002 m.

Air was solved with the pressure-based transient solver. Turbulence was described using the realizable k-ε model with standard wall functions. The near-wall resolution was evaluated using the ground-wall y+ values for all six CFD conditions. The area-weighted mean y+ ranged from 101.6 to 189.0, while the facet minimum and maximum values across all cases were 46.9 and 411.0, respectively. The ground-wall cells therefore remained predominantly in the logarithmic wall-function region, although localized higher y+ values occurred under the strongest crosswind conditions. Gravity was applied in the negative vertical direction at 9.81 m s⁻². Pressure-velocity coupling used SIMPLE; pressure used the Standard discretization, and momentum, turbulent kinetic energy, and dissipation used first-order upwind schemes. Hybrid initialization was applied before transient calculation. Two-way coupling between the discrete and continuous phases was enabled, and droplets were tracked transiently using the fluid-flow time step. Turbulent dispersion was represented using the discrete random walk (DRW) model with a time-scale constant of 0.15.
The spray liquid was water. The injected water droplets were treated as inert particles; evaporation and secondary breakup were not modeled. The initial liquid velocity was calculated from the measured volumetric flow rate and a nozzle outlet area of 1.137 mm², giving 21.40 m s⁻¹. The 110° flat-fan sheet was represented by nine directions at -55°, -41°, -27°, -14°, 0°, 14°, 27°, 41°, and 55°. For a fan angle β, the initial components were vₓ = 0, vᵧ = -v₀ cos β, and v_z = v₀ sin β.
The measured droplet distribution at 0.4 MPa was represented by three size groups: 75.29 μm (fine), 206.23 μm (middle/VMD), and 336.57 μm (coarse). Each fan direction contained one injection for each size group, giving 27 single injections. The corresponding mass flow rates per direction were 0.000811111, 0.001081481, and 0.000811111 kg s⁻¹; their sum over all directions equaled the measured nozzle mass flow. Droplets were injected from 0 to 20 s. The calculation continued without new injection to 22 s, using a time step of 0.01 s, so droplets released near the end of spraying could continue to settle, be trapped, or escape.
2.5. Data Normalization and Comparison MetricsBecause the cotton-string experimental exposure time was 60 s and the numerical injection time was 20 s, cumulative CFD string masses were multiplied by 60/20 = 3 for direct one-minute comparison. The linearity of simulated string deposition was checked for G1 using independent 20, 40, and 60 s calculations. The corresponding total rates were 4.757 × 10⁻⁴, 4.861 × 10⁻⁴, and 4.845 × 10⁻⁴ kg s⁻¹, supporting time normalization over this interval.
Ground comparison used the fraction of total released spray mass entering the matched monitoring area. Absolute agreement was summarized by mean absolute error (MAE), and association between experimental and simulated fractions was described by the Pearson correlation coefficient. Because only five matched ground cases were available, correlation was interpreted descriptively. Vertical string distributions were normalized separately within each experimental replicate as pᵢ = mᵢ/Σmᵢ. The three normalized replicate profiles were then summarized as mean ± sample SD (n = 3), whereas each CFD-DPM profile was normalized once within its condition. This separated the predicted vertical pattern from the absolute capture efficiency.
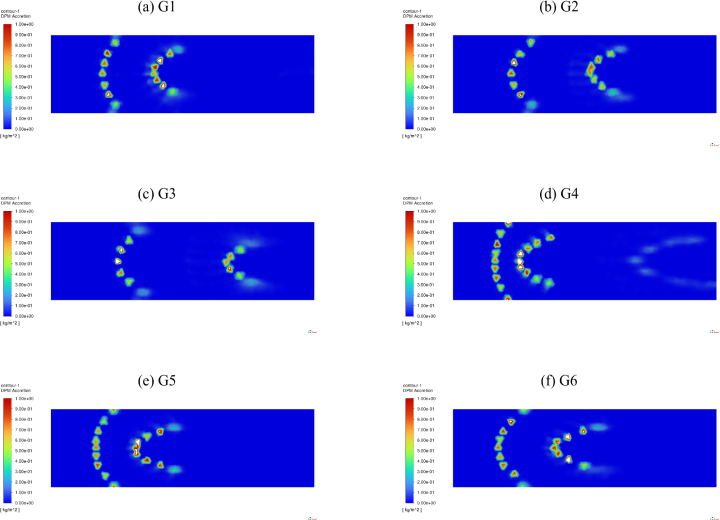
The ground-monitoring average accretion increased from 0.021539 to 0.026501 kg m⁻² across G1-G3 as crosswind speed rose from 2 to 4 m s⁻¹ at a nozzle height of 1.25 m. In contrast, the values for G4-G6 at 0.875 m were 0.021223, 0.021116, and 0.020747 kg m⁻², indicating little response within the monitoring window. The whole-ground average was highest in G4 (0.031692 kg m⁻²), consistent with more rapid sedimentation from the lower release height at the lowest crosswind speed.
The spatial maps contained curved bands and localized deposition spots (Figure 4). These structures arose from the combination of nine discrete fan directions and three representative droplet diameters. Increasing crosswind displaced the plume downwind, but the finite monitoring window caused the response to depend on both release height and the location at which each discrete droplet stream intersected the ground.

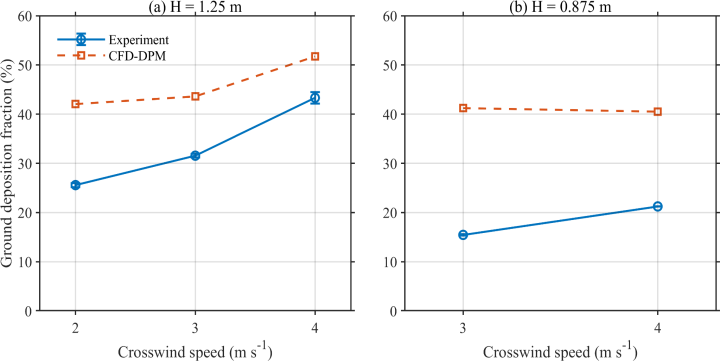
At 1.25 m, the experimental ground drift fraction increased from 25.575 ± 0.407% in G1 to 43.313 ± 1.170% in G3, with G2 yielding 31.554 ± 0.379%. At 0.875 m, the measured fraction increased from 15.452 ± 0.152% in G5 to 21.239 ± 0.013% in G6. The simulation reproduced the direction of the 1.25 m response, increasing from 42.04% in G1 to 51.73% in G3 (Figure 5a). At 0.875 m, the simulated fraction remained nearly constant at 41.22% in G5 and 40.50% in G6 (Figure 5b).
Across the five cases with matching ground measurements, the Pearson correlation between experimental and simulated fractions was 0.922. However, the MAE was 16.39 percentage points and the simulation showed a persistent positive bias. Thus, the high correlation mainly reflects the correct ranking of several conditions, especially the 1.25 m group, and should not be interpreted as quantitative agreement.

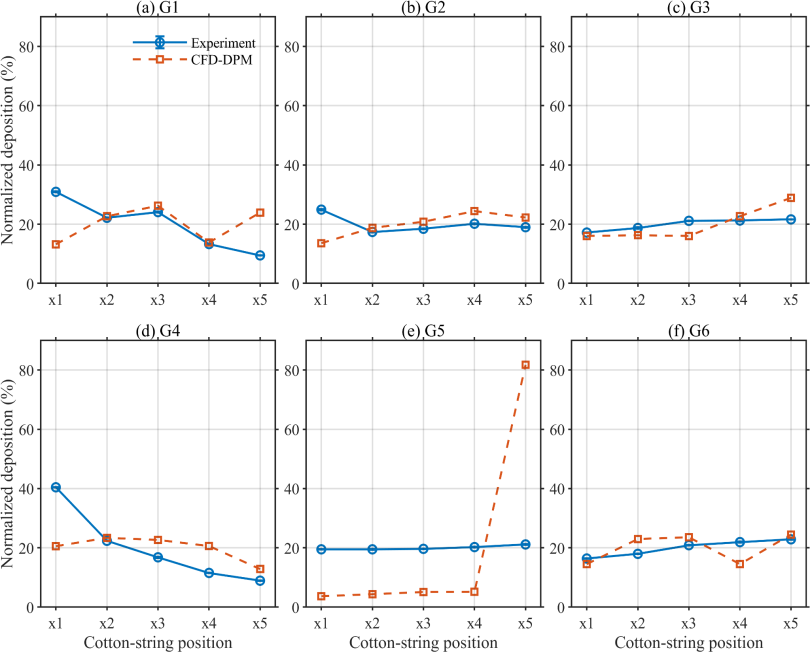
The experimental string total increased from 4.8658 ± 0.1396 g in G1 to 6.3569 ± 0.1479 g in G3, indicating greater passage of droplets through the vertical sampling plane as crosswind speed increased at 1.25 m. Totals for G4–G6 were lower (1.0517 ± 0.0306 to 1.4833 ± 0.0388 g). The small between-repeat variation indicated good repeatability across the six conditions. The CFD one-minute equivalents varied non-monotonically and were particularly high in G2, G4, and G5. The CFD/experiment ratios ranged from 0.56 to 39.31 (Table 3), confirming that the ideal trap boundary did not provide a reliable estimate of absolute cotton-string capture for every condition.
Normalization revealed where the CFD model captured the vertical pattern independently of total capture (Figure 6). G3 and G6 showed the closest overall normalized distributions, with greater relative deposition at the upper strings under stronger crosswind. G2 also reproduced the tendency for the upper-middle strings to receive more deposition, although the experimental profile was comparatively uniform. G4 captured the reduction at x5 but underpredicted the relative dominance of x1. In G5, both experiment and simulation placed the maximum at x5, but the simulated result was unrealistically concentrated: x5 contained approximately 81.7% of the simulated string total compared with 21.1% experimentally.


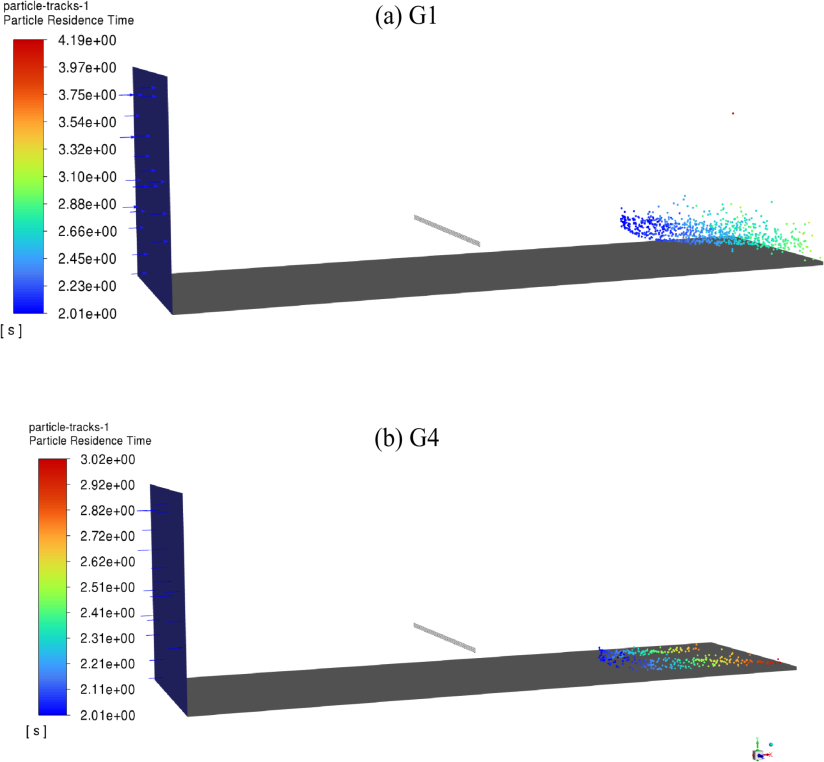
Typical trajectories at 2 m s⁻¹ showed the expected influence of release height (Figure 7). Droplets released at 1.25 m remained airborne longer and experienced greater horizontal transport before reaching the ground. At 0.875 m, the shorter settling distance increased whole-ground deposition within the computational domain. The trajectory plots also show narrow stream-like structures, consistent with the deterministic angular and diameter discretization used for injection.
The experimental increase in ground drift fraction with crosswind speed at 1.25 m is consistent with previous experimental and modelling evidence that spray drift is sensitive to wind conditions and release height 1, 2, 3, 4, 5, 16. Wind-tunnel measurements and mechanistic models have also been used to evaluate spray-drift behavior under ground-boom conditions 14, 17. A higher release position extends the time available for horizontal transport. The simulation reproduced this trend because droplets at 1.25 m were displaced further into the monitoring region as wind speed increased. The response at 0.875 m was less well represented. Experimentally, drift fraction still increased between 3 and 4 m s⁻¹, but the numerical monitoring-area fraction changed little. At the lower height, many droplets sedimented rapidly and the result became sensitive to the precise boundary of the monitoring area and to how the inlet wind field developed through the domain.
The measured centerline wind field decreased substantially with downstream distance, whereas the numerical model prescribed the nominal value at the inlet. Although the CFD solution developed within the domain, the current study did not validate the simulated air-speed profile against all measured downstream positions. This difference is a plausible contributor to the positive ground-deposition bias. Future work should impose or validate the measured wind profile before adjusting DPM parameters.
4.2. Interpretation of Cotton-string DiscrepanciesThe string comparison exposed limitations that were less apparent in the ground results. In the model, every droplet touching a string wall was trapped. Real cotton-string capture depends on aerodynamic interception, droplet inertia, surface wetting, splashing, coalescence, and possible re-entrainment. Treating a thin porous collector as a perfectly absorbing wall can therefore overpredict capture. The extreme G5 x5 value further indicates sensitivity to the intersection of discrete particle streams with a small sampling surface.
Representing the spray with only three diameters and nine fixed directions reduces computational cost, but it does not preserve the continuous measured size spectrum or the stochastic spatial distribution of a real flat-fan sheet. Previous studies show that droplet size, velocity, atomization or source representation, and spray properties can influence droplet transport and deposition 9, 11, 12, 15. Turbulent dispersion and evaporation can further affect predicted drift and deposition distances in Lagrangian models 10, 13. A Rosin-Rammler or measured tabulated size distribution, stochastic angular sampling, and a particle-number independence test would likely reduce artificial arcs and hotspots. Because evaporation was not included in the present model, its potential influence on the fine 75.29 μm droplets should be assessed in future work.
Despite the large absolute errors, normalized profiles retained useful qualitative information. G3 and G6 reproduced the upward shift of the intercepted distribution at high crosswind, and G5 identified the uppermost string as the maximum. These results support using the present model as a mechanism-oriented tool. They do not support using it to predict cotton-string mass without calibration or a physically based capture-efficiency model.
4.3. Scope and LimitationsThis study considered one nozzle, one spray pressure, two heights, and three crosswind speeds, and the number of validation cases was small. Although the available ground-collector conditions and the cotton-string experiments were independently repeated three times and repeat-level variability is reported, the range of operating conditions used for CFD validation remained limited. The continuous droplet spectrum was simplified to three discrete sizes and nine fixed injection directions. Uncertainty associated with the turbulence model, time step, particle parcel number, and string capture efficiency was not systematically quantified. Consequently, the ground correlation should be regarded primarily as a descriptive association rather than quantitative validation. The strengths of the work are the matched geometry, independent ground and vertical samplers, measured droplet-size inputs, and explicit reporting of both successful trends and substantial model deviations.
1. A transient CFD-DPM model reproduced the increase in monitored ground deposition with crosswind speed at a nozzle height of 1.25 m. Across five matched ground conditions, the experimental and simulated fractions were correlated (r = 0.922), but the model overpredicted deposition by an average of 16.39 percentage points.
2. Lowering the nozzle from 1.25 to 0.875 m shortened the simulated airborne trajectory and increased whole-ground sedimentation at low crosswind. However, the numerical monitoring-area fraction was insensitive to the experimental increase observed between 3 and 4 m s⁻¹ at the lower height.
3. The model reproduced several vertical-distribution tendencies, including upper-level enhancement in G3, G5, and G6, but absolute cotton-string mass was unreliable. CFD/experiment ratios ranged from 0.56 to 39.31, and G5 contained an artificial concentration at the uppermost string.
4. The current model should be used for qualitative trend interpretation rather than quantitative prediction. Future refinement should use the measured continuous droplet spectrum, stochastic fan injection, particle-number and time-step independence tests, downstream airflow validation, and a physically based string-capture treatment.
The author declares that there are no competing interests.
The data supporting the findings of this study are available from the corresponding author upon reasonable request.
| [1] | Pan, X., Yang, S., Gao, Y., et al., “Evaluation of Spray Drift from an Electric Boom Sprayer: Impact of Boom Height and Nozzle Type,” Agronomy, 15(1), 160, January 2025. | ||
| In article | View Article | ||
| [2] | Gil, E., Gallart, M., Balsari, P., et al., “Influence of wind velocity and wind direction on measurements of spray drift potential of boom sprayers using drift test bench,” Agricultural and Forest Meteorology, 202, 94-101, March 2015. | ||
| In article | View Article | ||
| [3] | Balsari, P., Gil, E., Marucco, P., van de Zande, J.C., Nuyttens, D., Herbst, A. and Gallart, M., “Field-crop-sprayer potential drift measured using test bench: Effects of boom height and nozzle type,” Biosystems Engineering, 154, 3-13, February 2017. | ||
| In article | View Article | ||
| [4] | Nuyttens, D., De Schampheleire, M., Baetens, K. and Sonck, B., “The influence of operator-controlled variables on spray drift from field crop sprayers,” Transactions of the ASABE, 50(4), 1129-1140, 2007. | ||
| In article | View Article | ||
| [5] | Baetens, K., Nuyttens, D., Verboven, P., De Schampheleire, M., Nicolaï, B. and Ramon, H., “Predicting drift from field spraying by means of a 3D computational fluid dynamics model,” Computers and Electronics in Agriculture, 56(2), 161-173, 2007. | ||
| In article | View Article | ||
| [6] | Baetens, K., Ho, Q.T., Nuyttens, D., De Schampheleire, M., Endalew, A.M., Hertog, M.L.A.T.M., Nicolai, B., Ramon, H. and Verboven, P., “A validated 2-D diffusion-advection model for prediction of drift from ground boom sprayers,” Atmospheric Environment, 43(9), 1674-1682, March 2009. | ||
| In article | View Article | ||
| [7] | Lebeau, F., Verstraete, A., Stainier, C. and Destain, M.F., “RTDrift: A real time model for estimating spray drift from ground applications,” Computers and Electronics in Agriculture, 77(2), 161-174, 2011. | ||
| In article | View Article | ||
| [8] | Løfstrøm, P., Bruus, M., Andersen, H.V., Kjær, C., Nuyttens, D. and Astrup, P., “The OML-SprayDrift model for predicting pesticide drift and deposition from ground boom sprayers,” Journal of Pesticide Science, 38(3), 129-138, 2013. | ||
| In article | View Article | ||
| [9] | Renaudo, C.A., Bertin, D.E. and Bucalá, V., “A coupled atomization-spray drift model as online support tool for boom spray applications,” Precision Agriculture, 23(6), 2345-2371, 2022. | ||
| In article | View Article | ||
| [10] | Renaudo, C.A., Bertin, D.E. and Bucalá, V., “A hybrid Lagrangian-dispersion model for spray drift prediction applied to horizontal boom sprayers,” Journal of Aerosol Science, 173, 106210, 2023. | ||
| In article | View Article | ||
| [11] | Cerruto, E., Manetto, G., Papa, R. and Longo, D., “Modelling Spray Pressure Effects on Droplet Size Distribution from Agricultural Nozzles,” Applied Sciences, 11(19), 9283, October 2021. | ||
| In article | View Article | ||
| [12] | Musiu, E.M., Qi, L. and Wu, Y., “Evaluation of droplets size distribution and velocity pattern using Computational Fluid Dynamics modelling,” Computers and Electronics in Agriculture, 164, 104886, 2019. | ||
| In article | View Article | ||
| [13] | Renaudo, C.A., Bucalá, V. and Bertin, D.E., “Droplet deposition of agrochemical spraying: Comparison of results from a random-walk model and CFD simulations,” The Canadian Journal of Chemical Engineering, 102(8), 2682-2694, 2024. | ||
| In article | View Article | ||
| [14] | Butler Ellis, M.C., Alanis, R., Lane, A.G., Tuck, C.R., Nuyttens, D. and van de Zande, J.C., “Wind tunnel measurements and model predictions for estimating spray drift reduction under field conditions,” Biosystems Engineering, 154, 25-34, February 2017. | ||
| In article | View Article | ||
| [15] | De Cock, N., Massinon, M., Salah, S.O.T. and Lebeau, F., “Investigation on optimal spray properties for ground based agricultural applications using deposition and retention models,” Biosystems Engineering, 162, 99-111, 2017. | ||
| In article | View Article | ||
| [16] | Zhu, H., Reichard, D.L., Fox, R.D., Ozkan, H.E. and Brazee, R.D., “DRIFTSIM, A Program to Estimate Drift Distances of Spray Droplets,” Applied Engineering in Agriculture, 11(3), 365-369, 1995. | ||
| In article | View Article | ||
| [17] | Teske, M.E., Miller, P.C.H., Thistle, H.W. and Birchfield, N.B., “Initial development and validation of a mechanistic spray drift model for ground boom sprayers,” Transactions of the ASABE, 52(4), 1089-1097, 2009. | ||
| In article | View Article | ||
Published with license by Science and Education Publishing, Copyright © 2026 Zhang Huang
 This work is licensed under a Creative Commons Attribution 4.0 International License. To view a copy of this license, visit
http://creativecommons.org/licenses/by/4.0/
| [1] | Pan, X., Yang, S., Gao, Y., et al., “Evaluation of Spray Drift from an Electric Boom Sprayer: Impact of Boom Height and Nozzle Type,” Agronomy, 15(1), 160, January 2025. | ||
| In article | View Article | ||
| [2] | Gil, E., Gallart, M., Balsari, P., et al., “Influence of wind velocity and wind direction on measurements of spray drift potential of boom sprayers using drift test bench,” Agricultural and Forest Meteorology, 202, 94-101, March 2015. | ||
| In article | View Article | ||
| [3] | Balsari, P., Gil, E., Marucco, P., van de Zande, J.C., Nuyttens, D., Herbst, A. and Gallart, M., “Field-crop-sprayer potential drift measured using test bench: Effects of boom height and nozzle type,” Biosystems Engineering, 154, 3-13, February 2017. | ||
| In article | View Article | ||
| [4] | Nuyttens, D., De Schampheleire, M., Baetens, K. and Sonck, B., “The influence of operator-controlled variables on spray drift from field crop sprayers,” Transactions of the ASABE, 50(4), 1129-1140, 2007. | ||
| In article | View Article | ||
| [5] | Baetens, K., Nuyttens, D., Verboven, P., De Schampheleire, M., Nicolaï, B. and Ramon, H., “Predicting drift from field spraying by means of a 3D computational fluid dynamics model,” Computers and Electronics in Agriculture, 56(2), 161-173, 2007. | ||
| In article | View Article | ||
| [6] | Baetens, K., Ho, Q.T., Nuyttens, D., De Schampheleire, M., Endalew, A.M., Hertog, M.L.A.T.M., Nicolai, B., Ramon, H. and Verboven, P., “A validated 2-D diffusion-advection model for prediction of drift from ground boom sprayers,” Atmospheric Environment, 43(9), 1674-1682, March 2009. | ||
| In article | View Article | ||
| [7] | Lebeau, F., Verstraete, A., Stainier, C. and Destain, M.F., “RTDrift: A real time model for estimating spray drift from ground applications,” Computers and Electronics in Agriculture, 77(2), 161-174, 2011. | ||
| In article | View Article | ||
| [8] | Løfstrøm, P., Bruus, M., Andersen, H.V., Kjær, C., Nuyttens, D. and Astrup, P., “The OML-SprayDrift model for predicting pesticide drift and deposition from ground boom sprayers,” Journal of Pesticide Science, 38(3), 129-138, 2013. | ||
| In article | View Article | ||
| [9] | Renaudo, C.A., Bertin, D.E. and Bucalá, V., “A coupled atomization-spray drift model as online support tool for boom spray applications,” Precision Agriculture, 23(6), 2345-2371, 2022. | ||
| In article | View Article | ||
| [10] | Renaudo, C.A., Bertin, D.E. and Bucalá, V., “A hybrid Lagrangian-dispersion model for spray drift prediction applied to horizontal boom sprayers,” Journal of Aerosol Science, 173, 106210, 2023. | ||
| In article | View Article | ||
| [11] | Cerruto, E., Manetto, G., Papa, R. and Longo, D., “Modelling Spray Pressure Effects on Droplet Size Distribution from Agricultural Nozzles,” Applied Sciences, 11(19), 9283, October 2021. | ||
| In article | View Article | ||
| [12] | Musiu, E.M., Qi, L. and Wu, Y., “Evaluation of droplets size distribution and velocity pattern using Computational Fluid Dynamics modelling,” Computers and Electronics in Agriculture, 164, 104886, 2019. | ||
| In article | View Article | ||
| [13] | Renaudo, C.A., Bucalá, V. and Bertin, D.E., “Droplet deposition of agrochemical spraying: Comparison of results from a random-walk model and CFD simulations,” The Canadian Journal of Chemical Engineering, 102(8), 2682-2694, 2024. | ||
| In article | View Article | ||
| [14] | Butler Ellis, M.C., Alanis, R., Lane, A.G., Tuck, C.R., Nuyttens, D. and van de Zande, J.C., “Wind tunnel measurements and model predictions for estimating spray drift reduction under field conditions,” Biosystems Engineering, 154, 25-34, February 2017. | ||
| In article | View Article | ||
| [15] | De Cock, N., Massinon, M., Salah, S.O.T. and Lebeau, F., “Investigation on optimal spray properties for ground based agricultural applications using deposition and retention models,” Biosystems Engineering, 162, 99-111, 2017. | ||
| In article | View Article | ||
| [16] | Zhu, H., Reichard, D.L., Fox, R.D., Ozkan, H.E. and Brazee, R.D., “DRIFTSIM, A Program to Estimate Drift Distances of Spray Droplets,” Applied Engineering in Agriculture, 11(3), 365-369, 1995. | ||
| In article | View Article | ||
| [17] | Teske, M.E., Miller, P.C.H., Thistle, H.W. and Birchfield, N.B., “Initial development and validation of a mechanistic spray drift model for ground boom sprayers,” Transactions of the ASABE, 52(4), 1089-1097, 2009. | ||
| In article | View Article | ||