 OPEN ACCESS
  PEER-REVIEWED
Application of Remote Sensing for the Mapping of Geological Structures in Rainforest Area: A Case Study at the Matomb-Makak Area, Center-South Cameroon
Metang Victor1, , Nkoumbou Charles1, Tchakounté Numbem Jacqueline1, Njopwouo Daniel2
1University of Yaoundé 1, Faculty of Science, Department of Earth Sciences. P.O. Box 812 Yaoundé-Cameroon
2University of Yaoundé 1, Faculty of Science, Department of Inorganic Chemistry. P.O. Box 812 Yaoundé-Cameroon
Abstract
In the areas with rainforest vegetation, the use of SRTM (Shuttle Radar topography Mission) data because of their penetrative characters, high quality and availability, offers a new approach for the detection and interpretation of the geological structures. This paper presents the new structural mapping results of the Matomb-Makak area (western part of the Pan-African Yaoundé series), based on the combined field survey and satellite image processing methods. The study area is characterized by dense forest vegetation with difficult access, scarcity and discontinuity of the available outcrops. As a consequence, geological mapping in this type of environment is difficult, time-consuming, expensive, and even dangerous and not accurate. During the field work, 280 outcrops have been investigated in which five main lithological units have been distinguished. In order to identify the foliation trajectories and the fractures network of kilometric scale, the techniques of remote sensing were used. The processing of SRTM data led to the detection of linear anomalies. These anomalies have been verified and validated to structural map on the basis of field data. The analysis of the structural map indicates: (1) two directions of S2 foliation (NE-SW major direction, locally folded and NW-SE secondary direction), (2) one family of faults trending NW-SE which locally displace the foliation, (3) a ductile shear zone with NNE-SSW trends which deflects the S2 foliation. The two directions of foliation observed in the Matomb-Makak area as well as the NW-SE direction of fault are similar to those observed in the Yaoundé series by other authors. However, the structural map obtained from the interpretation of field data is quite different to that obtained from remote sensing. We have noticed that the folding structures resulting from the interpretation of the field data are not observed on the structural map obtained from the interpretation of satellite image processing. Thus, the mapping of foliation trajectories in the rainforest area on the solely basis of the field measurements, is most of the time, an extrapolation which does not represent the structural architecture at regional scale. It is concluded that the combination of field-based mapping and remote sensing methods are useful tool for the mapping of geological structures within the densely vegetated regions of southern Cameroun.
At a glance: Figures
Keywords: remote sensing, geological structures, foliation trajectories, rain forest area, cameroon
Journal of Geosciences and Geomatics, 2014 2 (5),
pp 196-207.
DOI: 10.12691/jgg-2-5-3
Received August 12, 2014; Revised September 25, 2014; Accepted October 07, 2014
Copyright © 2013 Science and Education Publishing. All Rights Reserved.Cite this article:
- Victor, Metang, et al. "Application of Remote Sensing for the Mapping of Geological Structures in Rainforest Area: A Case Study at the Matomb-Makak Area, Center-South Cameroon." Journal of Geosciences and Geomatics 2.5 (2014): 196-207.
- Victor, M. , Charles, N. , Jacqueline, T. N. , & Daniel, N. (2014). Application of Remote Sensing for the Mapping of Geological Structures in Rainforest Area: A Case Study at the Matomb-Makak Area, Center-South Cameroon. Journal of Geosciences and Geomatics, 2(5), 196-207.
- Victor, Metang, Nkoumbou Charles, Tchakounté Numbem Jacqueline, and Njopwouo Daniel. "Application of Remote Sensing for the Mapping of Geological Structures in Rainforest Area: A Case Study at the Matomb-Makak Area, Center-South Cameroon." Journal of Geosciences and Geomatics 2, no. 5 (2014): 196-207.
| Import into BibTeX | Import into EndNote | Import into RefMan | Import into RefWorks |
1. Introduction
During the last two decades, many works have been carried out with the aims to better constrain the tectonic evolution of the Pan-African Central Africa fold belt (CAFB). For example, Nzenti et al. [1] and Toteu et al. [2] have subdivided the CAFB in Cameroon into three main litho-tectonical domains namely: (i) the northern domain, (ii) the central domain; and (iii) the southern domain. The southern domain covers the center-south of the country and is located in equatorial rain forest zone. This domain is made up of several lithological units which formed the Yaoundé group. The Yaoundé group is made up of three series: the Yokadouma series [3], the Ayos-Mbalmayo-Bengbis series [4, 5] and the Yaoundé series [5, 6]. Till date, these w orks were restricted to the areas with easier access and therefore could not provide a satisfactory explanation of the evolution of the Pan-African fold belt in Cameroon at large scale. Concerning the western part of the Yaoundé series, some mapping works using field-based method have been carried out recently [6, 7], but no accurate structural map was made.
The Matom-Makak area belongs to the western part of Pan-African Yaoundé series (Figure 1b). This area is characterized by densely vegetation and the scarcity of the outcrops. The access to the site is difficult and even dangerous. As a consequence, geological mapping in this type of environment is difficult, time-consuming, expensive, and when possible, not accurate. Moreover, the available outcrops are most of the time discontinuous and unexploitable due to the strong degree of weathering. All these factors constitute a major problem for the accurate geological mapping in the rain forest area. Recently, remote sensing has been largely used for geological mapping around the world (e.g: Southern Madagascar [9]; Central Eastern Desert of Egypt [10] ; Mayo Kebbi in the SW of Chad [11]; Centre-South of Ivory Coast [12]).
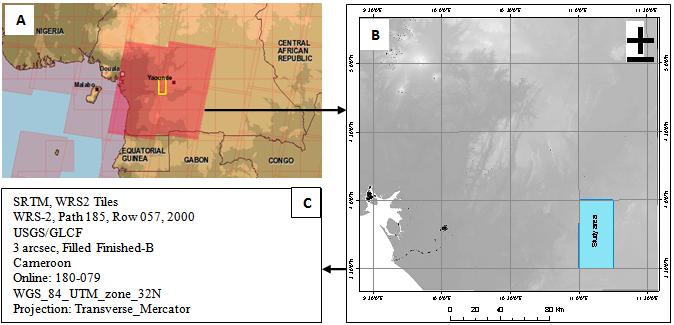

 Location map of the center-south Cameroon rain forest domain showing the area covers by the satellite image use in this study; B) Raw SRTM image showing the location of the study area (blue box); C) Main characteristics of SRTM data used in this work) PowerPoint Slide
PowerPoint Slide Larger image(png format)


In this paper, a combination of SRTM (Shuttle Radar topography Mission) data processing and field-based survey methods have been used for the mapping of geological structures at Matomb-Makak area. The objective of this research was to show how the mapping method integrating remote sensing is useful for accurate interpretation of geological structures. This new mapping approach has enabled us to improve the mapping of lithological units and geological structures and therefore, has led to constraint the tectonic evolution of the Pan-African Yaoundé group in Cameroon.
2. Geological Setting
The Yaoundé series is mainly made up of granulites, migmatites and schists. These rocks are organized into two lithological units: (i) the metasedimentary unit is composed of kyanite-garnet gneiss, garnet-plagioclase gneiss and garnet micaschist with intercalation of calc-silicate rocks, quartzite and talcschist. Their protolith corresponds to the sedimentary rock with clay-carbonate composition (sequence rich in shale, greywacke, dolomite and evaporite) with interstratified basic volcanic layers [5-7,13]; (ii) the meta-igneous unit is formed by pyriclasites, pyroxenites and talcschists [8, 14]. The talcschist rocks are interbeded with the metasedimentary unit in some parts of the series [8].
On the structural point of view, the rocks of the Yaoundé series are characterized by a polyphase deformation with monocyclic tectonic evolution [5]. Four phases of deformation have been distinguished [15]: the D1 and D2 phases are two major events of ductile deformation. The D1 phase is prior to the emplacement the dioritic calc-alkaline rocks and is responsible for the emplacement of nappes which have lead to high pressure metamorphism, in granulite facies metamorphic conditions, of soft sediments. The D2 phase is representative of a symmetric extension probably associated to boudinage of the foliation at large scale and (or) plate. The D1 and D2 deformational phases have been affected by D3 and D4 folding phases. The conditions of paroxysmal metamorphism are evaluated at 650-800°C and 9.5-12 Kb [4, 8, 13, 16].
The age of the granulite facies metamorphism as well as the calc-alkaline plutonism is 620 Ma [13, 17, 18]. Sm-Nd isotopic data indicate that the protolith of the rocks from the Yaoundé series is composed of a mixture of Neoproterozoic and Paleoproterozoic sources [17, 19, 20, 21].
3. Results
3.1. Field SurveyThe Matomb-Makak area covers a surface of about 1512 km2 in which 280 rock exposures have been discovered and investigated during the field work. RRocks crop in the form of blocks, domes, road-cuts and flagstones. Field investigations have consisted of exploring the outcrops, measuring the geological structures such as foliation, lineament, folds, boudins, and fractures, and collecting representative sample of each rock types. Geometric analysis has consisted to describe and define the different deformational phases as suggested by Hobbs et al. [22].
The lithology of the Matom-Makak area consists principally of metamorphic rocks. Five main rock types namely garnet-chlorite schists, garnet amphibolite, garnet micaschists, talcschists and garnet-kyanite migmatite, have been distinguished. Based on the relative chronology of the different structural elements observed on the outcrop and the geometric relationship between these structural features, four main phases of deformation have been defined. The D1 phase is related to lithostatic pressure due to the weight of the sediments and to the tectonic compressional forces caused by the closure of the basin, and it is associated with the development of composite S0/S1/S2 fabrics (Figure 2a). The D2 tangential phase [5], responsible for the thrusting of the Pan-African nappes onto the Congo craton, is the major deformational event in the study area. This phase is characterized by a structural diversity and at cartographic scale, by a late-D2 symmetric extension probably associated to the boudinage of the S1 foliation at large scale, similar to that observed in the Yaoundé city [23]. During D2 phase, the following structural elements have been developed:
- the S2 foliation is outlined by a lithological banding (Figure 2a) and by a compositional banding (Figure 2a). S2 foliation is locally folded, boudinated or sheared. In general, two main orientations of S2 foliation have been identified: (i) a major NE-SW direction with average dips of 30 SE, 28 SE or NW and 15 SE or NW, recorded respectively in garnet amphibolite, garnet micaschist and garnet-kyanite migmatite; (ii) a less representative E-W to NW-SE direction observed in garnet-chlorite schist has an average dips of 28° towards the N, NE or SW;
- the B2 boudins are developed in garnet-kyanite migmatite, garnet-chlorite schist and garnet micaschist. They are underlined by quartzofeldspathic layers, sheared quartzites (Figure 2b) and amphibolite lenses respectively. They trend NNE-SSE to NE-SW;
- the L2 lineation is mainly a mineral lineation formed by alignment of kyanite crystals in garnet-kyanite migmatite, muscovite and biotite lamellas in micaschist, chlorite flakes in the garnet-chlorite schist, and amphibole rods in garnet amphibolite (Figure 2c). It is sub-horizontal (3 to 20°) with NE-SW trends. The NW-SE trending L2 lineations were also observed with a gentle plunge (0 to 20°) towards the NW;
- the P2 folds have variable morphologies. They are either kink folds, either dissymmetric upright folds with sheared limbs (Figure 2d) or recumbent folds. The attitude of the P2 folds axes is variable, and lies between N090E 10W and N180E03N;
- C2 shear zones are rare. They are observed in garnet-kyanite migmatite where they are marked by quartzofeldspathic veins which transposed S1 foliation with either dextral or sinistral shear movement;
The D3 phase is mainly a shearing phase. It is composed of S3 schistosity, L3 lineation and C3shear zones (Figure 2d). The brittle D4 phase is characterized by various orientated joints and veins.

 S0/S1/S2 foliation in the garnet-kyanite migmatites of Nkenglikok; (b) quartzitic boudin structures in the garnet-chlorite schist of Makak, (c) L2 mineral lineations in the garnet-kyanite migmatite of Hegba, (d) P2 folding structures and C3 shear planes at Hegba) PowerPoint Slide
PowerPoint Slide Larger image(png format)
SRTM images (scene 189-079; 185/057 Path/ Row; date of acquisition: 2000) of the center-South Cameroon area, were used for this work (Figure 1a). This scene is freely provided by USGS/GLCF (United States Geological Survey/Global Land Cover Facility) and directly downloadable in Geotiff format. The SRTM data have been imported into the ArcGis software where the study area has been delineated between the latitudes 3°30'N and 4°00'N and the longitudes l1°00' E and 11°15' E (Figure 1b). This particular area was selected for two main reasons: (i) no detailed structural map is available till date, and (ii) the area is characterized by a diversity of petrographic units and structural elements which can provide insight for better understanding of the tectonic evolution of the CAFB in the Yaoundé series.
In this study, a series of image processing methods were used with the help of ArcGis software. The SRTM-DEM technique for structural interpretation is on the basis of shade relief image with various elevations [24]. In addition, the enhance techniques such as different vertical exaggeration with varying sun azimuths and angles can improve elevation image for interpretation. In order to achieve the objectives, the following steps were undertaken: First, the raw SRTM images were classified and resampled using the cubic convolution method. Second, we proceed with a symmetrical inversion of the relief. The aim of this method is to determine surface linear anomalies. Third, shade relief images were created for various sun azimuths and angles. For this study, sun azimuths of 315°, 45°, 135° and 225° were used. The different sun angle is able to map out the structures with various orientations (Figures 3a, 3b, 3c, 3d). Areas perpendicular to the sun angle are illuminated the most while the area with high angle or greater than 90° are shaded. This image enhancement method enables us to precisely map out the linear pattern. Figure 4 is the synthetic lineament map of the Matom-Makak area obtained from the different sun illumination azimuths. However, all the penetrative lineaments (fault) are not visible with this method.
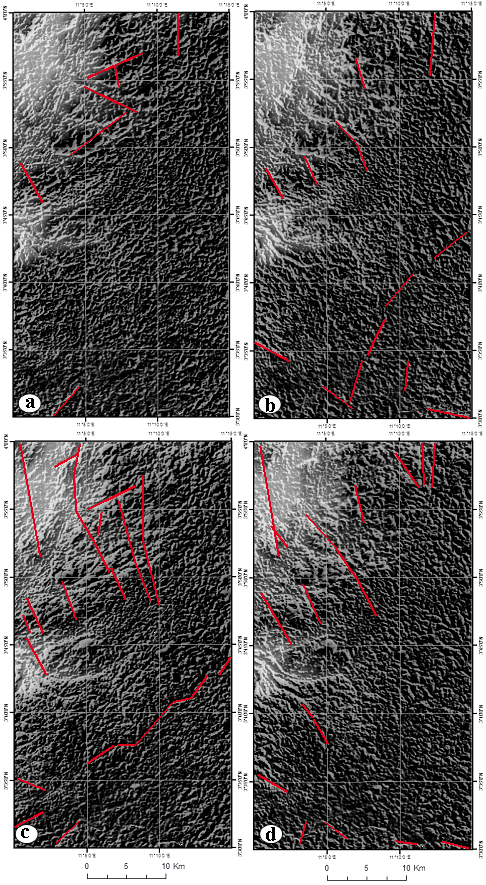
 sun illumination azimuth at 315°; b) sun illumination azimuth at 45°; c) sun illumination azimuth at 135°; d) sun illumination azimuth at 225°) PowerPoint Slide
PowerPoint Slide Larger image(png format)
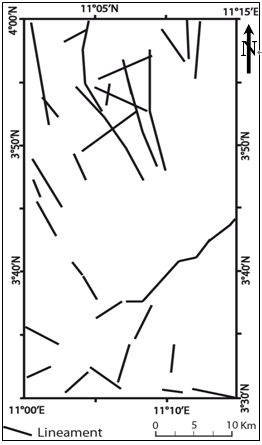
 PowerPoint Slide
 Larger image(png format)
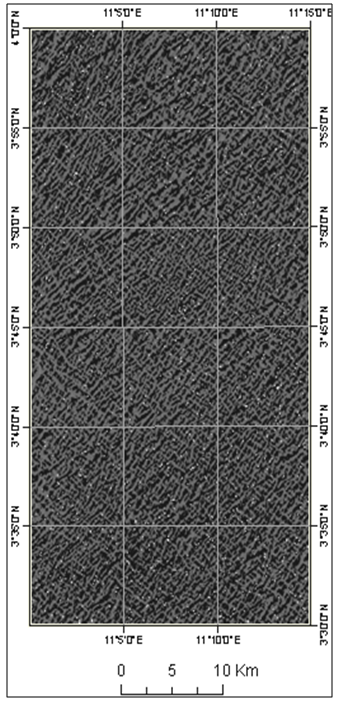
In order to visualize all the geological structures (foliation, shearing and fault), the directional filters of SOBEL and Gradient NW have been applied. The use of ‘Sobel vertical Operator’ led to the visualization of a various continuous linear patterns (Figure 5). The disadvantage of this mode of image filtering is that it does not permit to differentiate the various types of structural elements. To solve this problem, the enhance images were combined using RGB (Red, Green, Blue) combination mode and then we combined the two filters (Sobel horizontal directional filter and Gradient NW directional filter) to obtain the new enhance image. This new image has been filtered again using Sobel vertical Operator. This makes the geological structure determination easier. The foliation trajectories appear discontinuous and the faults become clearly visible and detectable by the straight lines which crosscut the foliation (Figure 6). This result, associated with field data, allows the accurate digitization of the foliation trajectories and faults, using Adobe Illustrator software (Figure 7). On the map of Figure 7, the following geological structures are identified: (1) a family of fault oriented NW-SE, (2) two directions of S2 foliation (a predominant NE-SW direction and less developed NW-SE direction), (3) a ductile shear zone with NNE-SSW trends located in the NW of study area. This shear zone of cartographic scale was confirmed on the field where it is outlined by the deflection of S2 foliation planes in the garnet-kyanite migmatite. The combination of the remote sensing results and the field survey data has enabled us to obtain the detailed structural map of the Matomb-Makak area (Figure 8).
 PowerPoint Slide
 Larger image(png format)
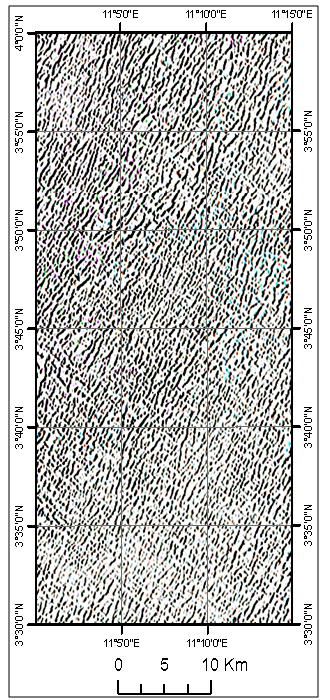
 PowerPoint Slide
 Larger image(png format)
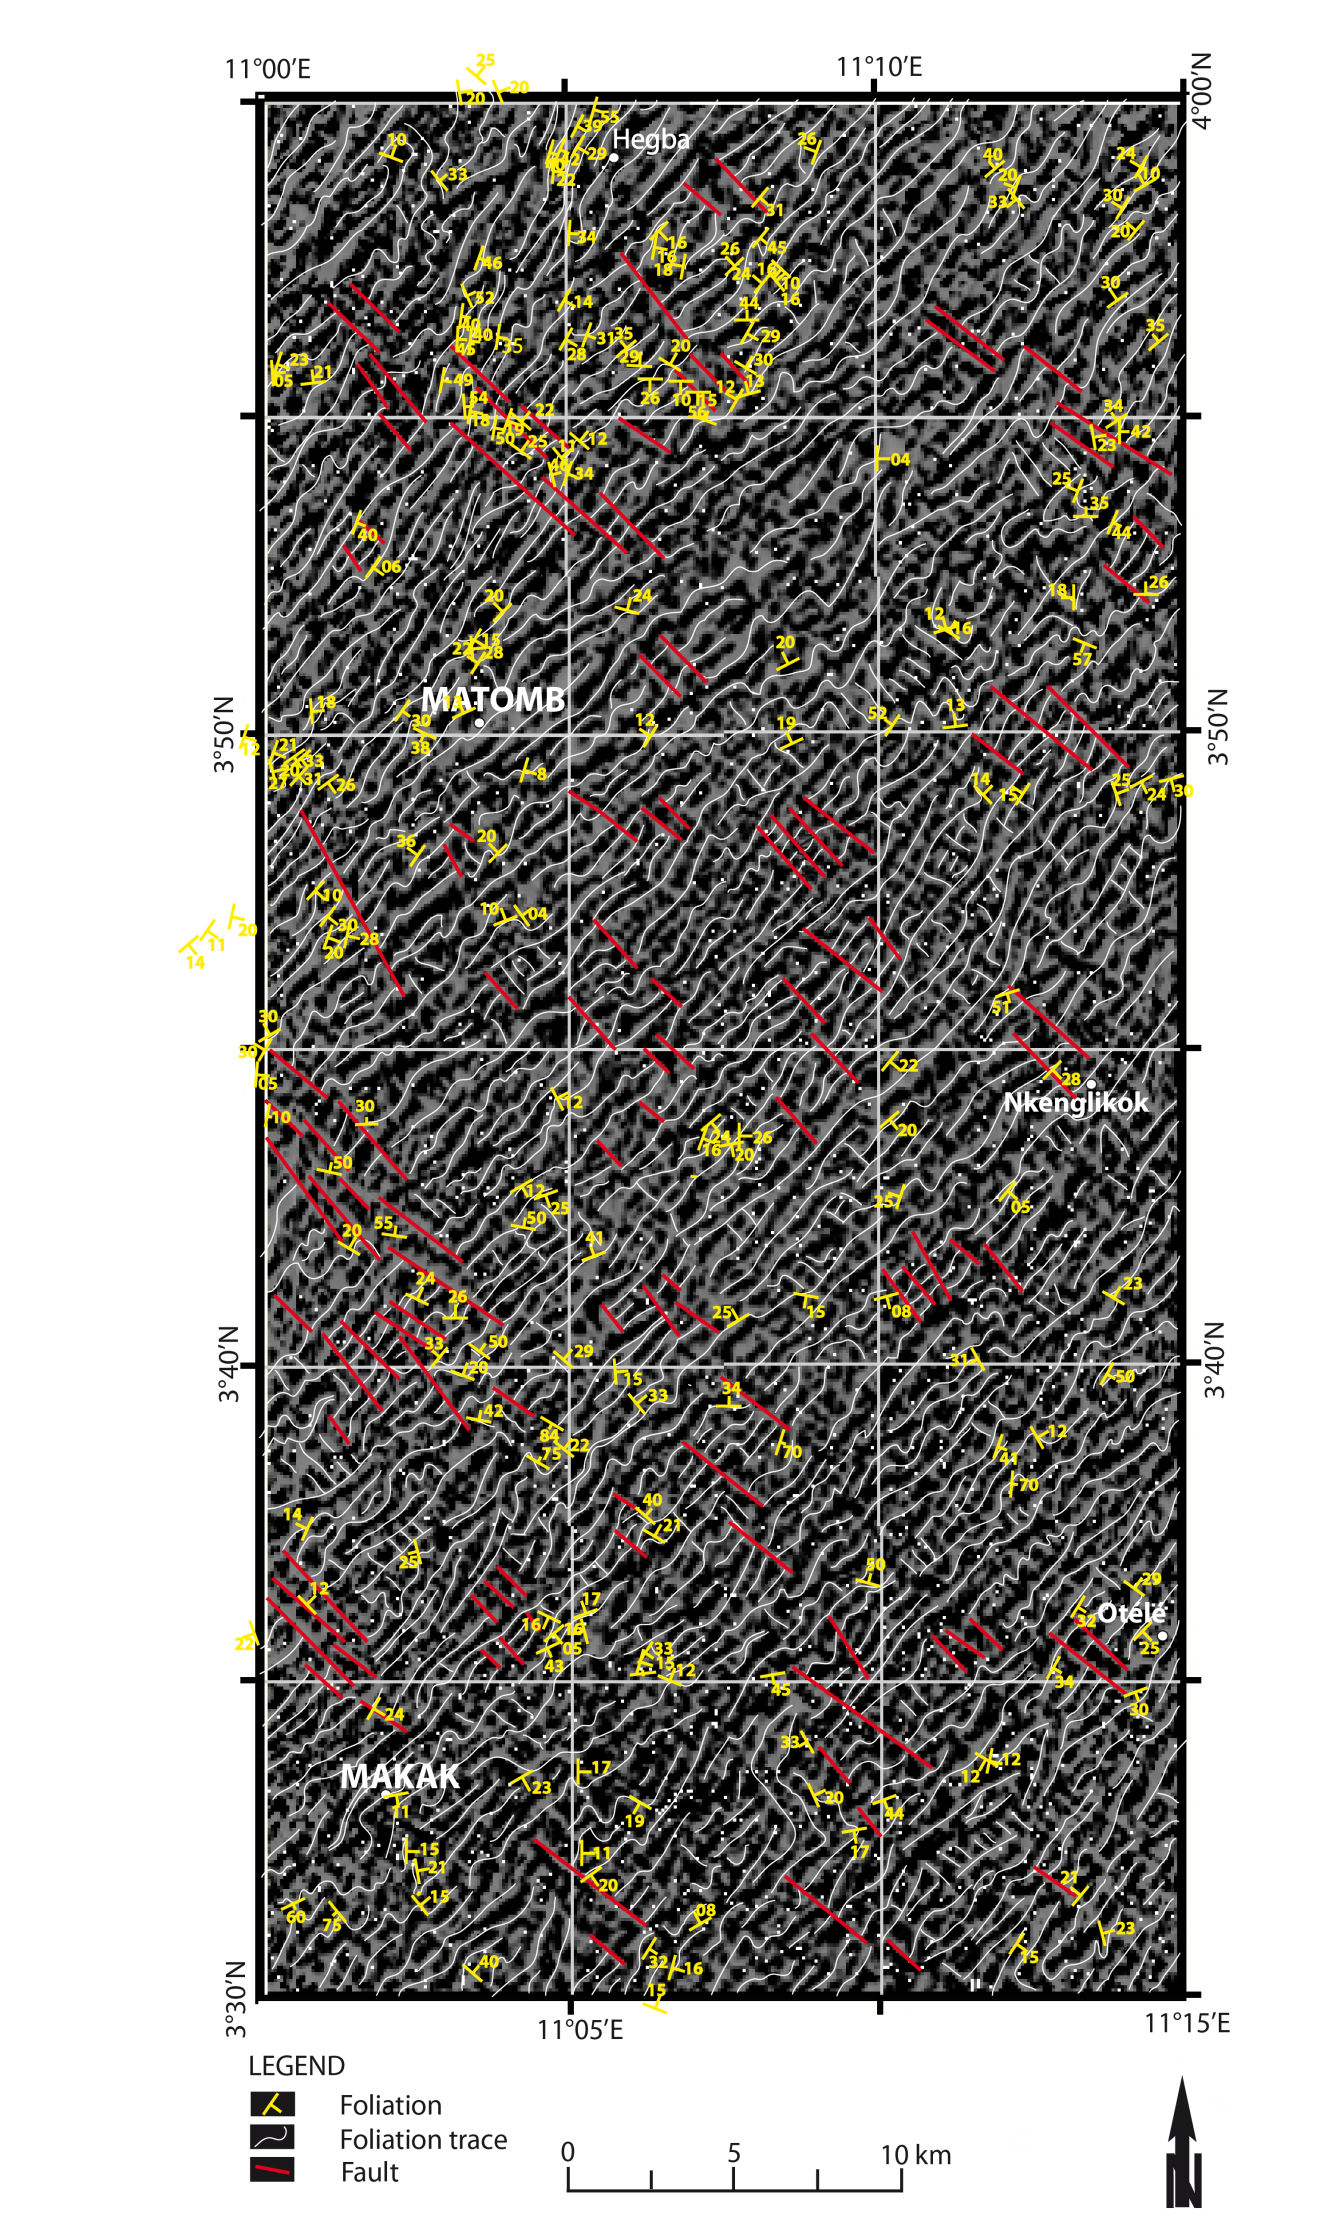
, digitized layer of foliation trace (white curves), faults (red lines) and field data (yellow symbols and value)) PowerPoint Slide
PowerPoint Slide Larger image(png format)
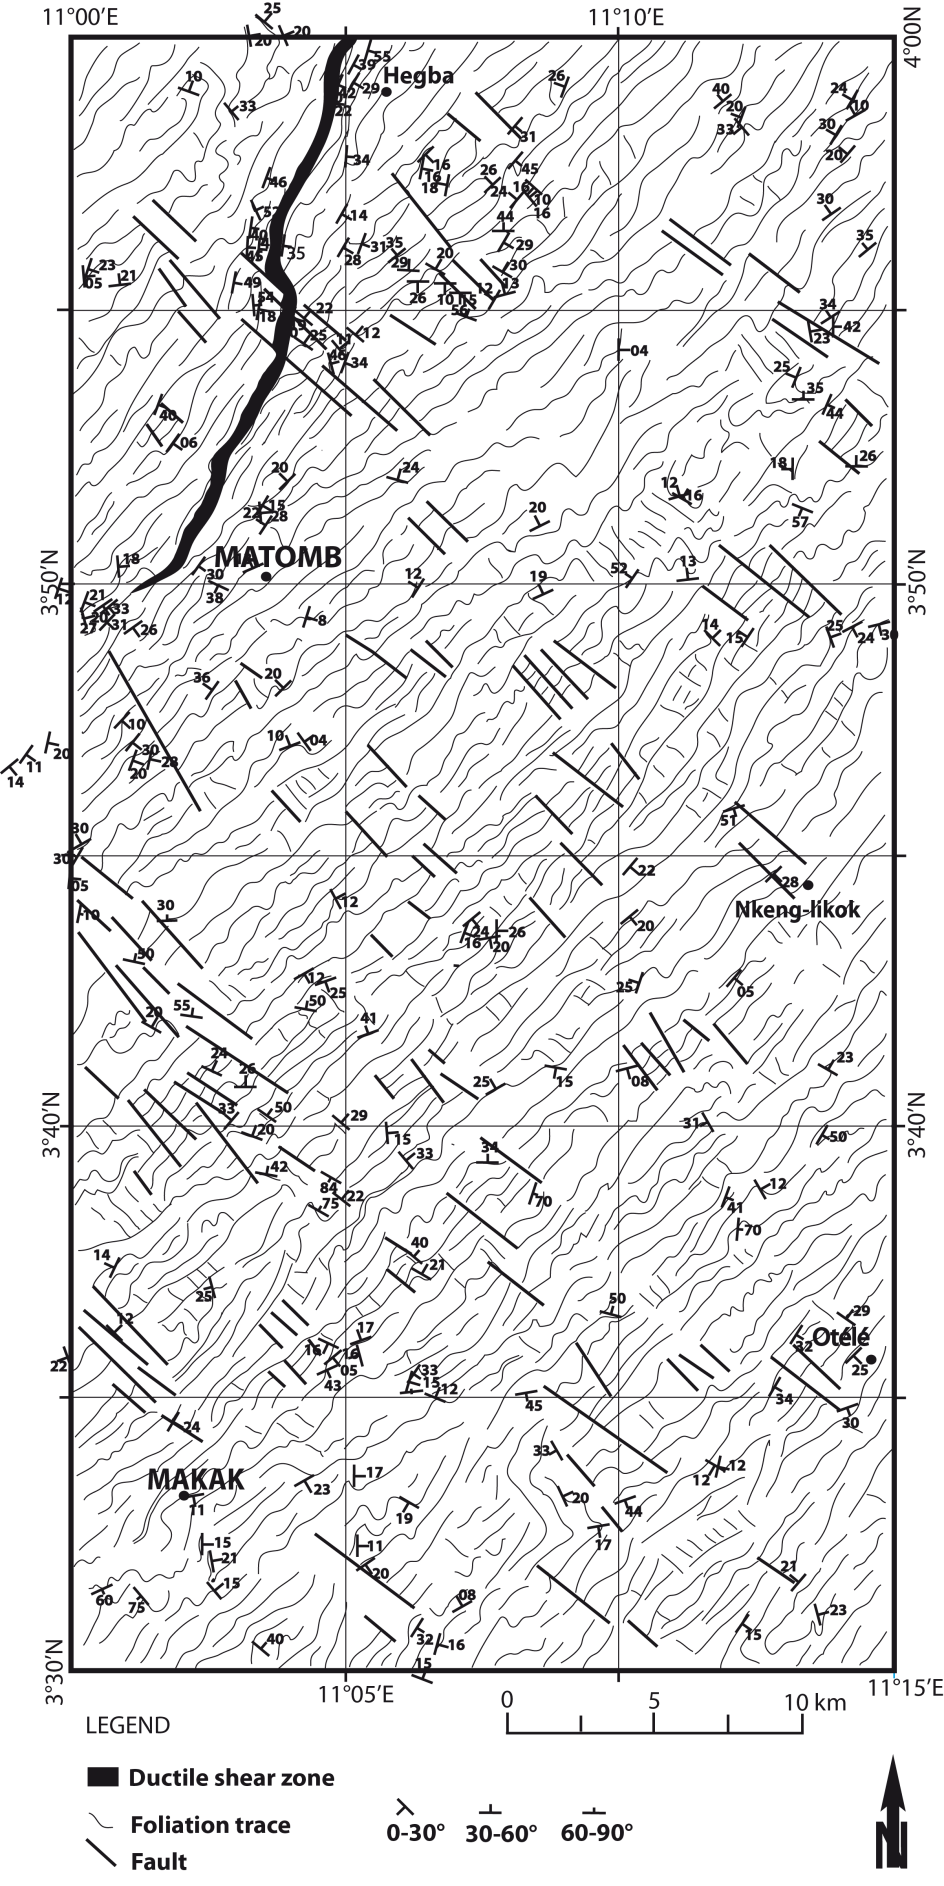
 PowerPoint Slide
 Larger image(png format)
4. Discussion
Remote sensing has been largely applied for structural mapping around the world. For example, Schetselaar et al. [25] have contributed to the lithological mapping of Mozambique by the SRTM and Landsat ETM+ images processing. Using Landsat TM data, Randrianasolo [9] has successfully mapped the geological structures of the southern Madagascar. Moussa Isseini [11] has used Landsat ETM+ data to map the lithological unit and the geological structures of Mayo Kebbi area, SW of Chad and part of East and Far North Cameroon. Piyaphong [24] with the help of the DEM (Digital Elevation Model) data has discovered a NW-SE trend fault system with dextral movement at Koh Samui in the gulf of Thailand. Nowadays, it clearly appears that the use of remote sensing for the geological mapping became an indispensable tool for the realization of the detailed and precise geological map.
In Cameroon, the geological mapping using remote sensing method is not yet developed. The Matomb-Makak area, located in rain forest domain of Cameroon, is a good target for the application of remote sensing especially SRTM data because of their penetrative character. Geological structures, especially the foliation trajectories obtained by SRTM image processing, locally matched those observed on the field. However the map obtained from the field-based mapping (Figure 9a) is different from that obtained from the combination of the field data and remote sensing results (Figure 9b). We have explained this situation by the fact that the outcrops are discontinuous on the field and the measures taken on structural elements were not enough. Thus foliation trajectories resulting from these measures represent an extrapolation which does not always reflect the entire field realities, as shown in Figure 9b. The interpretation the foliation trajectories on the simply basis of the field data is commonly used by the geologists. The field-based structural mapping is efficient in the areas with abundant and continuous outcrops (eg. Saharan area). In rain forest area, because of the scarcity and discontinuity of the outcrops, this mapping method is limited and when it is used; their interpretation is only valid for the particular area where the measures were taken of the geological structures, i.e. without regional significance.
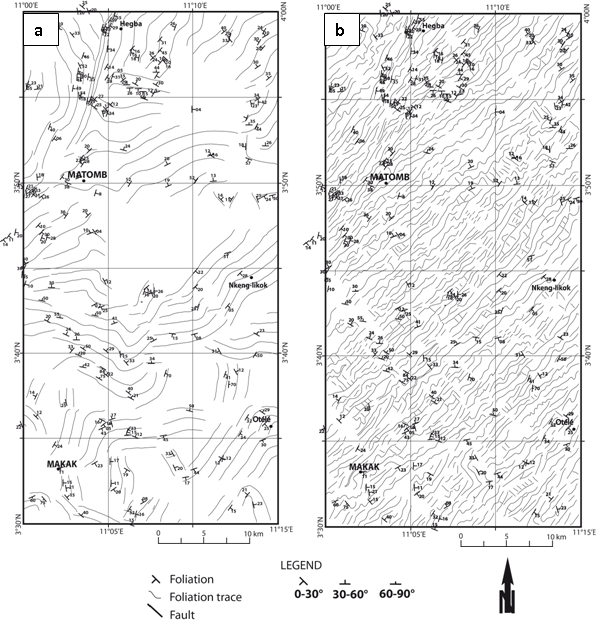
 and the combined field-based and remote map (b)) PowerPoint Slide
PowerPoint Slide Larger image(png format)
The two directions of the foliation observed in the Matomb-Makak area are similar to that obtained in the Yaoundé series by other authors (e.g. [8, 13, 15]). However these authors have interpreted this structural disposition as result from the folding of the foliation at regional scale. The new results obtained from this study have confirmed the existence of folding structures in the Yaoundé series, but reveal that these folds have only local importance (<1 km). The NW-SE trends family of faults map out in this work is similar to that observed in Yaoundé by Mvondo et al. (2007).
5. Conclusion
The SRTM image processing combined with field survey of the Matomb-Makak area have led to the construction of a detailed structural map on which the following informations were highlighted: (i) two directions of S2 foliation (NE-SW major direction, locally folded and NW-SE direction less pronounced), similar to those observed in the Yaoundé migmatites; (ii) a local scale folding with axis oriented N-S to NE-SW, (iii) one family of faults trending NW-SE that locally displaces the foliation, (iv) a ductile shear zone with NNE-SSW trends affecting the garnet-kyanite migmatites. This shear zone is responsible for the deflection of S2 foliation.
However, the field-based structural map is quite different to that obtained from remote sensing. We have noticed that the folding structures resulting from the interpretation of the field data are not observed on the structural map obtained from the interpretation of satellite image processing. Thus, the mapping of foliation trajectories in the rainforest area on the solely basis of the field measurements, is most of the time, an extrapolation which does not represent the structural architecture at regional scale. It is concluded that the combination of field-based mapping and remote sensing methods are useful tool for the mapping of geological structures within the densely vegetated regions of southern Cameroun.
Acknowledgements
The data presented here form a part of the first author’s Ph.D thesis supervised by C. Nkoumbou and D. Njopwouo at the University of Yaoundé I, Cameroon. We gratefully acknowledge Dr Ganno Sylvestre (University of Yaoundé 1) for the comments and suggestions of earlier version of the manuscript. We thank the anonymous reviewers for their critical and constructive comments of the manuscript.
References
| [1] | Nzenti J.P., Barbey, P., Bertrand, JML., Macaudiere, J. (1994). La chaîne panafricaine au Cameroun: cherchons suture et modèle. In : S.G.F. édit., 15e réunion des Sciences de la Terre, Nancy, France, 99p. | ||
 In article In article | |||
| [2] | Toteu, S.F., Penaye, J., Poudjom Djomani, Y.H.. Geodynamic evolution of the Pan-African belt in Central Africa with special reference to Cameroon. Canadian Journal of Earth Sciences, 41, 73-85, 2004. | ||
| In article | CrossRef | ||
| [3] | Vicat, J.P., Pouclet, A., Nkoumbou, C. and Semé Mouangué, A. Le volcanisme fissural néoprotérozoïque des séries du Dja inférieur, de Yokadouma (Cameroun) et de Nola (RCA)-Signification géotectonique. Comptes Rendus de l’Académie des Sciences de Paris, 325, 671-677, 1997. | ||
| In article | |||
| [4] | Nédélec, A., Macaudière, J., Nzenti, J.P., Barbey, P. Evolution structurale et métamorphique des schistes de Mbalmayo (Cameroun): implications pour la structure de la zone mobile panafricaine d’Afrique centrale au contact du craton du Congo. Comptes Rendus de l’Académie des Science Paris, 303 (Série II1), 75-80, 1986. | ||
| In article | |||
| [5] | Nzenti, J.P., Barbey, P., Macaudiere, J., Soba, D. Origin and evolution of the late Precambrian high-grade Yaounde gneisses (Cameroon). Precambrian Research, 38, 91-109, 1988. | ||
| In article | CrossRef | ||
| [6] | Barbey, P., Macaudiere, J. and Nzenti, J.P. High pressure dehydration melting of metapelites: evidence from the migmatites of Yaounde (Cameroon). Journal of Petrology, 31 (2), 401-427, 1990. | ||
| In article | CrossRef | ||
| [7] | Stendal, H., Toteu, S.F., Frei, R., Penaye, J., Njel, U.O., Bassahak, J., Nni, J., Kankeu, B., Ngako, V., Hell, J.V. Derivation of detrital rutile in the Yaounde region from the Neoproterozoic Pan-African belt in southern Cameroon (Central Africa). Journal of African Earth Sciences, 44, 443-458, 2006. | ||
| In article | CrossRef | ||
| [8] | Yonta-Ngouné, C., Nkoumbou, C., Barbey, P., Le Breton, N., Montel, J.M., Villieras, F. Geological context of the Boumnyebel talcschists (Cameroun): Inferences on the Pan-African Belt of Central Africa. Comptes Rendus Geosciences, 342, 108-115, 2010. | ||
| In article | CrossRef | ||
| [9] | Randranasalo, E.B. Nouvelles méthodes de cartographie sur le socle protérozoïque du sud de Madagascar: Nature et géométrie de la croûte continentale d’un domaine orogénique en convergence, implications économiques. Thèse de doctorat, Université Terre Solide, 307 p., 2009. | ||
| In article | |||
| [10] | Amer, R., Kusky, T., Ghulam, A. Lithological mapping in the Central Eastern Desert of Egypt using ASTER data. Journal of African Earth Sciences, 56, 75-82, 2010. | ||
| In article | CrossRef | ||
| [11] | Moussa Isseini. Croissance et différenciation crustales au Néoprotérozoïque. Exemple du domaine panafricain du Mayo Kebbi au Sud-Ouest du Tchad. Thèse de doctorat, Université de Nancy, 339 p., 2011. | ||
| In article | |||
| [12] | Ouattara G., Koffi, G.B., and Yao, K. A. Contribution des images satellitales Landsat 7 ETM+ à la cartographie lithostructurale du Centre-Est de la Côte d’Ivoire (Afrique de l’Ouest). International Journal of Innovation and Applied Studies, 1(1) 61-75, 2012. | ||
| In article | |||
| [13] | Owona, S., Mvondo Ondoa, J., Ratschbacher, L., Ndzana, M.P.S., Tchoua, F.M., Ekodeck, G.E. La géométrie de la tectonique archéenne, Paléo et néoprotérozoïque dans le Sud-Ouest du Cameroun. Comptes Rendus Geosciences, 343, 312-322, 2011. | ||
| In article | CrossRef | ||
| [14] | Nzenti, J.P., Njanko, T., Njiosseu, E.L.T. et Tchoua, F.M. Les domaines granulitiques de la chaîne panafricaine Nord-Equatoriale au Cameroun. In Géologie et environnement au Cameroun, Vicat et Bilong editors, Collection Geocam I/1998. Université de Yaoundé I, 255-264, 1998. | ||
| In article | |||
| [15] | Mvondo, H., Owona, S., Mvondo Ondoa, J., Essono, J. Tectonic evolution of the Yaounde segment of the Neoproterozoic Central Africa Orogenic Belt in southern Cameroon. Canadian Journal of African Earth Sciences, 44, 433-444, 2007. | ||
| In article | CrossRef | ||
| [16] | Nzenti, J.P., Barbey, P., Jegouzo, P., et Moreau, C. Un nouvel exemple de ceinture granulitique dans une chaîne protérozoïque de collision: les migmatites de Yaoundé au Cameroun. Comptes Rendus de l’Académie des Sciences de Paris, 299, 1197-1199, 1984. | ||
| In article | |||
| [17] | Penaye, J., Toteu, S.F., Michard, A., Van Schmus, W.R., Nzenti J.P. U-Pb and Sm-Nd preliminary geochronologic data on the Yaoundé series, Cameroon: reinterpretation of granulitic rock as the suture of the collision in the « Centrafricain » belt. Comptes Rendus de l’Académie des Sciences de Paris, 317, 789-794, 1993. | ||
| In article | |||
| [18] | Ngnotué, T., Ganno, S., Nzenti, J.P., Schulz, B., Tchaptchet Tchato, D. and Suh Cheo, E. Geochemistry and geochronology of Peraluminous High-K granitic leucosomes of Yaoundé series (Cameroon): evidence for a unique Pan-African magmatism and melting event in North Equatorial Fold Belt. International Journal of Geosciences, 3, 525-548, 2012. | ||
| In article | CrossRef | ||
| [19] | Toteu, S.F., Van Schmus, W.R., Penaye, J., Nyobe, J.B. U-Pb and Sm-Nd evidence for Eburnean and Pan-African high grade metamorphism in cratonic rocks of Southern Cameroon. Precambrian Research, 67, 321-347, 1994. | ||
| In article | CrossRef | ||
| [20] | Toteu, S.F., Van Schmus, W.R., Penaye, J., Michard, A. New U-Pb and Sm-Nd data from north-central Cameroon and its bearing on the pre-Pan-African history of central Africa. Precambrian Research, 108, 45-73, 2001. | ||
| In article | CrossRef | ||
| [21] | Toteu, S.F., Penaye, J., Deloule, E., Van Schmus, W.R. and Tchameni, R.. Diachronous evolution of volcano-sedimentary basins north of the Congo Craton: insights from U/Pb ion microprobe dating of zircons from the Poli, Lom and Yaoundé Groups (Cameroon). Journal of African Earth Sciences 44, 428-442, 2006. | ||
| In article | CrossRef | ||
| [22] | Hobbs, B.E., Means, B.W.D., Williams, P.F., 1976. An outline of structural geology. New York, J Wileys and Sons, 379 p. | ||
| In article | |||
| [23] | Mvondo, H., Den Brok, S. W.J. and Mvondo Ondoa, J. Evidence for extension and exhumation of the Yaounde nappe (Pan-African fold belt, Cameroon). Journal of African Earth Sciences 36, 215-231, 2003. | ||
| In article | CrossRef | ||
| [24] | Piyaphong, C. DEM application for geological structure interpretation: A case study at the Koh Samui Area, gulf of Thailand. World Applied Sciences Journal, 17 (11), 1516-1520, 2012. | ||
| In article | |||
| [25] | Schetselaar, E.M., Tiainen, M. and Woldai, T. Integrated geological interpretation of remotely sensed data to support geological mapping in Mozambique. Geological Survey of Finland, Special Paper, 48, 35-63, 2008. | ||
| In article | |||

 CiteULike
 Delicious

