In this study, a context-based learning approach was implemented through a laboratory exercise in which students analyzed the artificial sweetener aspartame using multiple analytical techniques. The students gained hands-on experience with ultraviolet (UV), infrared (IR) and nuclear magnetic resonance (NMR) spectroscopy, as well as mass spectrometry (MS), and applied the spectra they acquired to investigate and interpret the chemical structure of aspartame. The results from the project were presented in both written and oral presentations. By grounding the laboratory exercise in a familiar, real-world product, the context-based learning activity (CBL) was designed to strengthen conceptual understanding and increase student engagement. To evaluate the success of this pedagogical method, Wilcoxon’s rank-sum test was conducted to assess student satisfaction with the quality and effectiveness of learning. Results indicated a significant improvement in both the students’ knowledge of spectroscopic methods and their overall satisfaction with the learning experience.
Aspartame (N-(L-α-aspartyl)-L-phenylalanine-1-methyl ester) (Figure 1) is an artificial sweetener most likely recognized by younger generations due to its widespread use in numerous popular sugar-free soft beverages. It was approved as a food additive in 1981 1 and since then, aspartame has been one of the main worldwide sugar replacement products. Aspartame is approximately 200 times sweeter than tabletop sugar 2 and therefore, only aliquots are needed to sweeten soft drinks and various foods. Replacing sugar with aspartame or other artificial sweeteners in drinks and foods has been claimed to give health benefits, such as weight control 3, diabetes management 4 and reduced dental caries 5. Consequently, aspartame has become popular among people who want to reduce or eliminate sugar consumption. In addition, aspartame is widely used in pharmaceutical products as a sweetener 6.
The safety of aspartame as a food additive has been extensively assessed in scientific studies, including analyses of its metabolic products—phenylalanine, aspartic acid, and methanol 7, 8. While recent media coverage has drawn attention to potential adverse effects, particularly osteoporosis 9 and a possible increased cancer risk 10, the Joint FAO/WHO Expert Committee on Food Additives (JECFA) concludes that daily intake of up to 40 mg per kilogram of body weight is safe for the general population 11. Individuals with phenylketonuria (PKU), however, should avoid aspartame due to their impaired ability to metabolize phenylalanine 12.

Several previous student projects have focused on aspartame. These include an introduction to statistical testing of significance in chemistry 13, a colorimetric analysis of a selection of tabletop sweeteners 14, and various analyses of aspartame in beverages using techniques such as ultraviolet spectroscopy 15, high-pressure liquid chromatography 16, capillary electrophoresis 17, thin layer chromatography 18, and electrospray ionization mass spectrometry 19.
Examples of other student laboratory exercises involving everyday chemicals include both quantitative and qualitative experiments of molecules and/or mixtures containing caffeine 19, 20, cannabis 21, ethanol 22, acidity of wine 23, essential oils 24, pharmaceutical products 25, 26, 27, vitamin C 28 and cow’s milk 29, as well as a variety of common household solids 30. However, total structure determination done by students on everyday chemicals is rather rare, but there are some experiments using one or more of the analytical techniques; GC-MS 21, NMR 22, 27, 31, 32, IR 25, 32 or X-ray diffraction 30. The qualitative methods are presented as part of a synthesis experiment with a focus on functional group conversion, or as identification of organic molecules, often with less complexity than aspartame. More recently, comprehensive spectroscopic topics have been taught through a combination of in-class theory and online assignments that help students practice and strengthen their understanding 33, 34.
By using context-based learning (CBL) as the educational approach in chemistry, connecting the learning process to real-world situations increases the student engagement and understanding 35, 36 as reviewed by Sevian et al. 37. The learning method prepares the students for future work by providing them with practical skills and experience relevant to their careers 38. Investigation of aspartame satisfies this objective and additionally offers a procedure that can be adopted by a broader range of educators. In literature, there are several examples of using CBL in chemistry education: learning electrochemistry by studying batteries 39, 40 and learning spectroscopic methods by examining various beverages 20, pharmaceuticals 25, 26, 27 and drugs 21. It has also been shown that incorporating societal context into chemistry teaching not only motivates students to learn chemical concepts but also engages them in societal debates 41.
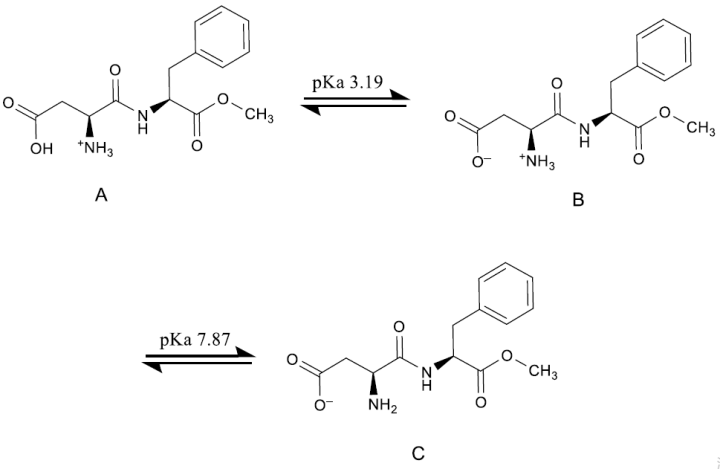
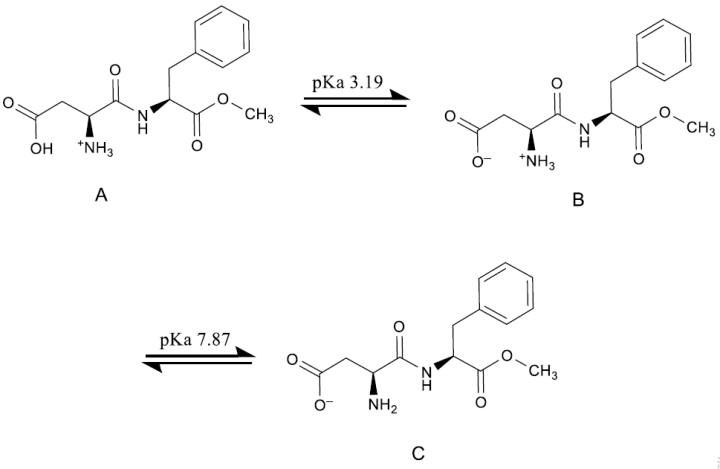
1.1. Chemical Properties of AspartameAspartame is a dipeptide built from the amino acids asparagine and methylated phenyl alanine. The molecule’s acid and amino groups are pH-sensitive and will exist in a pH-dependent equilibrium between the protonated (A), neutral (B) and deprotonated (C) forms, as shown in Figure 2.
At pH values below 3.19, the molecule predominantly exists as form A, carrying a net charge of +1 42. This positive charge enhances aqueous solubility, which is beneficial for increasing signal intensity and reducing data acquisition times, an effect that is particularly evident in NMR measurements. The molecule exhibits greatest stability in the pH range of 4-5 (with blood having a pH of approximately 5.6).
It is also well established that aspartame is not appropriate for use in oven-baked products because it degrades at elevated temperatures 43, 44. At lower pH values and/or high temperatures, time-dependent acid-catalyzed dissociation of amino acids, hydrolysis of the ester group, epimerization and intramolecular reactions, such as aminolysis reaction can occur 45, 46. The major degradation product in solution, is the intramolecular reaction giving 5-benzyl-3,6-dioxo-2-piperazineacetic acid (DKP) 47, 48. Accordingly, experimental conditions must be carefully controlled to minimize exposure to acidic environments and elevated temperatures, thereby limiting the formation of decomposition products that could interfere with analytical analyses 45, 46.

To our knowledge, the present teaching project represents the first comprehensive structural investigation of the aspartame molecule that combines ultraviolet spectroscopy (UV), infrared spectroscopy (IR), nuclear magnetic resonance (NMR) and mass spectrometry (MS) following gas chromatography (GC). Surveys followed by statistical tests were used to measure the learning outcomes for the students and overall satisfaction with the project.
The analysis of aspartame was expected to have the following learning outcome, giving the students experience in:
• preparing solutions for different qualitative analyses.
• adjusting procedures in order to obtain satisfactory spectra with regards to solubility of the analyte and overlapping peaks in the spectra.
• running qualitative analyses on UV-, IR- NMR- and MS-instruments, followed by spectral processing.
• spectral elucidation by using UV, IR, NMR and MS-spectra.
• actively confirming their interpretations by looking up literature values.
• get an understanding of the strengths of the different analytical methods.
• presenting, reflecting and discussing their results in a written report and in an oral presentation.
The analysis of aspartame was conducted as part of a laboratory project in the chemistry module “KJE302 Analytical Techniques with Drug Analysis”. The students were all in their 4th or 5th semester of their bachelor studies in chemical engineering and had therefore completed elementary organic chemistry and instrumental analysis courses including an introduction to UV, IR, and GC.
The chemistry module began with a theoretical section that focused on the fundamental principles of NMR and MS techniques, accompanied by structured problem-solving activities implemented over a sequence of 10-14 instructional sessions, each lasting 90 minutes. During the laboratory project, students were organized into groups comprising two to three members each. In addition to aspartame, the project included salicylic acid, acetyl salicylic acid and ibuprofen, along with an unknown (methyl- ethyl-, propyl-, butyl- or isobutyl-) paraben. All of the molecules were analyzed by the same analytical methods as aspartame. The laboratory work was carried out by the groups over a two-week timeframe, while the overall project encompassing report preparation and the presentation of results extended to four weeks. Detailed information regarding the time required for the experimental work is provided in the Supporting Information (S-6).
Identical questionnaires were given to the students to assess their theoretical insight into the different analytical methods both before and after finishing the project. They were also asked to complete an expanded evaluation scheme. The entire laboratory project, together with the associated survey, was implemented across three semesters and comprises a total of 33 students.
UV absorption spectra were acquired using a Shimadzu UV-1800 UV–VIS spectrophotometer. Infrared (IR) spectra were recorded with a Nicolet iS5 Fourier-transform infrared (FT-IR) spectrometer equipped with a transmission module. Prior to IR analysis, an aspartame/KBr mixture was finely grounded and pressed into a pellet using a PerkinElmer hydraulic press. Nuclear magnetic resonance (NMR) spectra were recorded on a Magritek Spinsolve 60 MHz spectrometer. Gas chromatography–mass spectrometry (GC–MS) analyses were conducted on a Thermo Scientific TRACE 1310 system operated with an electron-impact ionization source and coupled to an ITQ 900 mass detector.
4.2. ReagentsThe chemicals were used as received. Aspartame was purchased from Sigma Aldrich, HPLC-grade methanol from VWR Chemicals, and deuterated water from Eurisotop. Potassium bromide (KBr) was obtained from Merck and of IR-spectroscopy quality.
4.3. Sample PreparationDetailed descriptions of the laboratory procedures are provided in the student laboratory handout in the Supporting Information (S-1).
4.4. Instrumental Analyses and Spectral ProcessingThe analysis and spectral processing on the different instruments were carried out by the students. An instructor was present in the laboratory during the experimental work when the students performed the UV and IR analyses. The instructor guided each student group individually through the recording and processing of the NMR and MS data.
4.5. Student Report and Oral PresentationA simplified group report was submitted one week after the completion of the laboratory work, followed by an oral presentation. Detailed instructions for the assignment, including procedure for the oral presentation, are provided in the Supporting Information (S-1), along with a complete spectral analysis for the instructor (S-2).
4.6. Statistical Methods to Evaluate the Learning OutcomeThe students completed pre- and post-laboratory questionnaires provided in the Supporting Information (S-3 and S-4). To evaluate the learning outcomes from the project, the questionnaire data were analyzed using descriptive statistics, a sign test, and the Wilcoxon rank-sum test in Excel 49. Non-parametric methods were chosen since the distribution of the data was unknown.
Standard safety precautions for students were used. Protective clothing, goggles, and nitrile gloves were used during laboratory work to ensure eye and skin protection, and the solutions were prepared in a well-vented hood.
Aspartame consists of distinct structural units that render it particularly suitable for illustrating key “structure-signal” relationships across multiple spectroscopic techniques. The phenyl group functions as a UV chromophore, while IR spectroscopy reveals characteristic absorptions, including the broad carboxylic acid O-H stretch, the amine N-H-stretch, and strong carbonyl (C=O) stretching bonds. In the NMR spectrum, the resonances are well resolved and provide information on both position and 3D-aspects through their chemical shifts and splitting patterns, respectively. The mass spectrum is characterized by ions arising from common fragmentation pathways. All acquired spectral data were compared with literature values by the students 50, 51, 52.
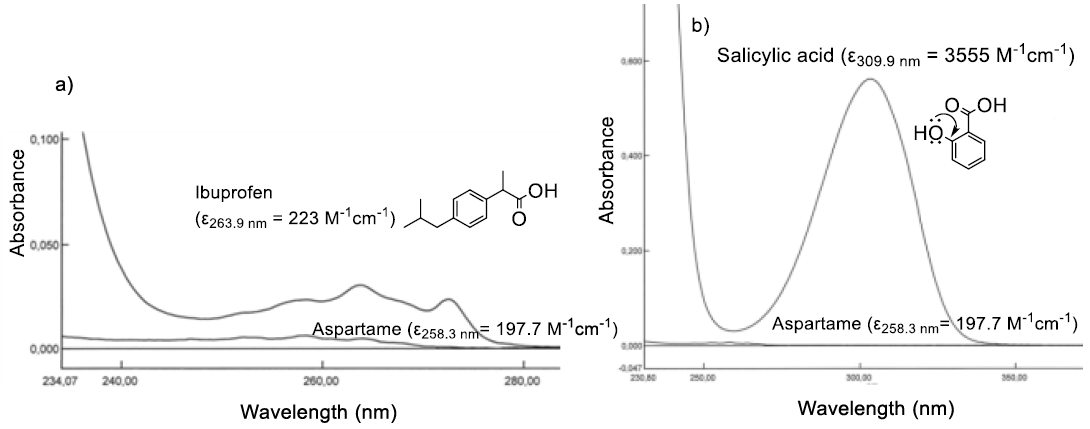
Initial results showed that pH did not affect the UV-absorption from 230-400 nm. This might be due to the separation of the pH dependent groups, the acid and the amine, from the aromatic ring. Furthermore, the aromatic group will absorb UV light above 230 nm 17, while the single bonds and the carbonyl double bond primarily absorb UV light at lower wavelengths. The students compared the UV-spectrum and the molar absorption coefficient (ε) of aspartame at its maximum wavelength, with the spectrum from ibuprofen, a compound with an isolated phenyl group, and to the spectrum from salicylic acid, showing the effect of an activating electron-donating OH substituent participating in the resonance with the phenyl group (Figure 3).


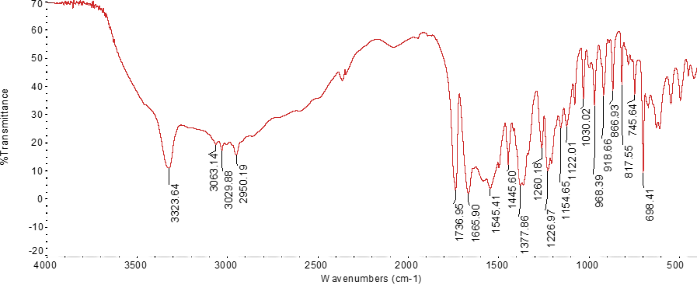
In the IR spectrum (Figure 4), a broad peak from 2500-3600 cm-1 clearly shows the presence of an acid group 50. An amine peak can also be identified at 3323.64 cm-1. The spectrum shows absorptions corresponding to an aromatic system with C-H stretching vibrations at 3063.14 cm-1 and 3029.88 cm-1, and C-H stretching vibrations from an aliphatic chain at 2950.19 cm-1. Furthermore, carbonyl groups are known for their strong absorptions, and indeed, the students observed and identified two strong absorptions: the ester carbonyl group can be found at 1736.95 cm-1, and the amide- and the acid carbonyl groups are, due to resonance, potentially overlapping to give the peak at 1665.90 cm-1.
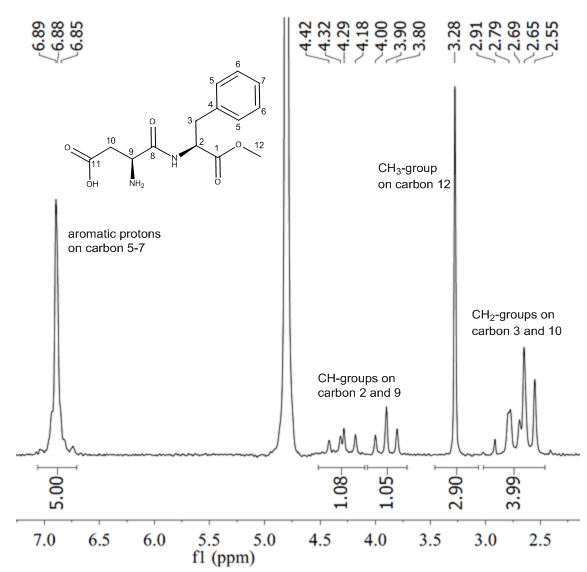
The NMR spectra are presented in Figure 5 (1H-NMR) and Figure 6 (13C-NMR). To obtain an acceptable signal-to-noise ratio, a few drops of concentrated HCl were added to the D2O solution, thereby imparting an overall positive charge to the molecule (Figure 2, A). Upon addition of the acid, the students observed that solid particles of aspartame present in neutral D2O dissolved.
Functional groups containing exchangeable protons were deuterated by the solvent, thereby simplifying the 1H-NMR spectrum. The aromatic protons (on carbon 5-7) appear as a broad peak at 6.88 ppm while the methyl ester group (on carbon 12) is observed as a singlet at 3.28 ppm. The methylene groups (on carbon 3 and 10) exhibit overlapping multiplet signals between 2.55 and 2.91 ppm, and the two -CH- protons (on carbon 2 and 9) are observed in the range of 3.80-4.42 ppm, appearing as a doublet of doublets and a triplet, respectively. The instructor emphasized to the students how diastereotropic protons on the methylene group, as a consequence of limited free rotation of the chemical bonds 50, could result in the doublet of doublets pattern for the coupling protons on carbon 2, in contrast to the n+1-coupling pattern observed for the proton on carbon 9.
In neutral, dilute sample, the intense water signal overlapped with the resonances of the –CH- protons (2 and 9). By acidifying the sample, this overlap could be minimized, most likely due to the pH-dependent chemical shift of the water resonance. In cases where the students observed substantial interference from the water peak in their spectra, the spectrum shown in Figure 5 was provided for reference. The pH sensitivity of the chemical shifts could be examined further to achieve consistent spectra. In addition, a water suppression pulse sequence could be used. However, this might suppress the aspartame signals from the -CH- protons (2 and 9).
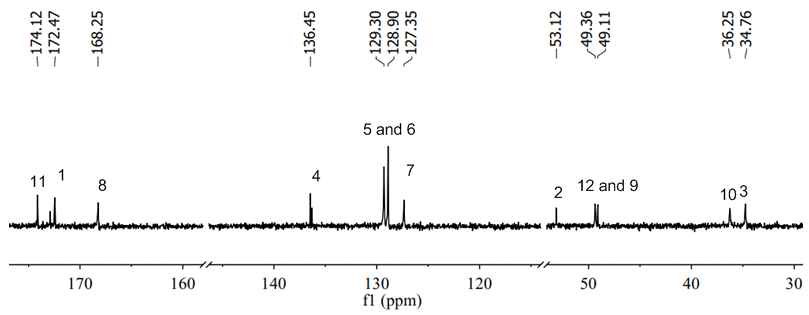
The 13C-NMR spectrum (Figure 6 and S-2) and the DEPT NMR spectra (S-2) were acquired over several days, and therefore, fully processed spectra were provided to the students. In the 13C-NMR spectrum, the acid-, amide- and ester carbonyl carbons (11, 1 and 8) appear downfield, while the aromatic carbons (4-7) are observed in the region of 127-137 ppm. The DEPT spectrum enabled the students to successfully identify the shifts corresponding to CH2 and quaternary carbon groups. In the student reports, literature was expected to be used to verify the chemical shifts 50, 51. Additional signals in the spectrum are attributed to degradation products formed in the acidic sample. The students were instructed to focus their analysis on the peaks labeled with their corresponding ppm values in Figure 6.


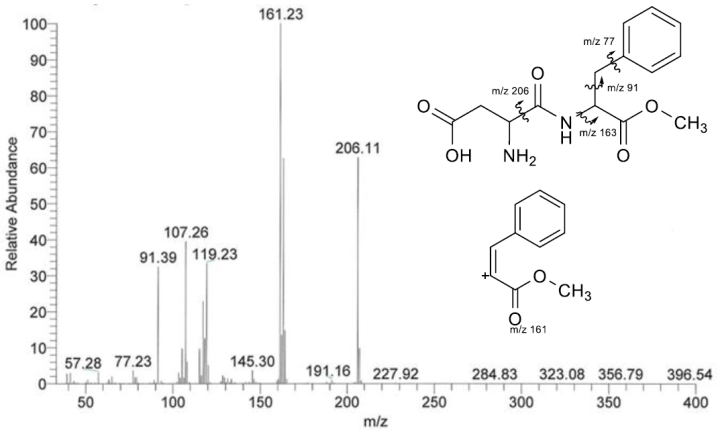
The MS-spectrum of aspartame (Figure 7) exhibited ion peaks consistent with the characteristic fragmentation patterns of compounds containing benzyl groups, including the tropylium cation (m/z 91) and the benzene cation (m/z 77) 50, which were correctly identified by all the student groups. A McLafferty-type rearrangement involving the amide group is the likely origin of the base peak at m/z 161, while β-cleavage of the amide carbonyl group accounts for the formation of the m/z 206 ion. Most student groups correctly described the formation of the m/z 206 ion. When the McLafferty-rearrangement was not addressed in the written report, the students were asked to explain this type of fragmentation mechanism in the oral presentation. They were also asked why the molecular ion peak (m/z 294) was not visible in the spectrum.
The presence of several low-intensity chromatographic peaks indicated decomposition of aspartame mainly occurring in the inlet to the GC column. The chromatogram is shown in S-2. This observation was emphasized by the instructor during the spectral processing part to illustrate the importance of avoiding high temperatures when analyzing aspartame. By using direct-inlet probe 19, or liquid chromatography (LC) combined with a soft ionization procedure 52, decomposition can be significantly reduced.

The laboratory report gave the students practice in the systematic analysis of chemical compounds. This task had them interpret spectral data, compare results across techniques, and consult scientific literature to support their conclusions. The exercise increased their confidence in spectral interpretation and helped them distinguish essential features from unnecessary detail. The report instructions (S-1) enabled the students to discuss the relevant findings, and to compare and evaluate the strengths of the techniques. Still, a joint session where an example is solved together with the students could increase the report quality. In addition, each student group delivered an oral presentation with a following discussion of their findings. This component strengthened their scientific communication skills and prepared them for the subsequent oral examination focusing on spectral interpretation and methodological reasoning. Overall, the students responded positively to this approach. Although some considered the written report demanding, most valued the opportunity to present their work. The oral sessions further enabled the instructor to assess their understanding and the rationale behind their analytical decisions.
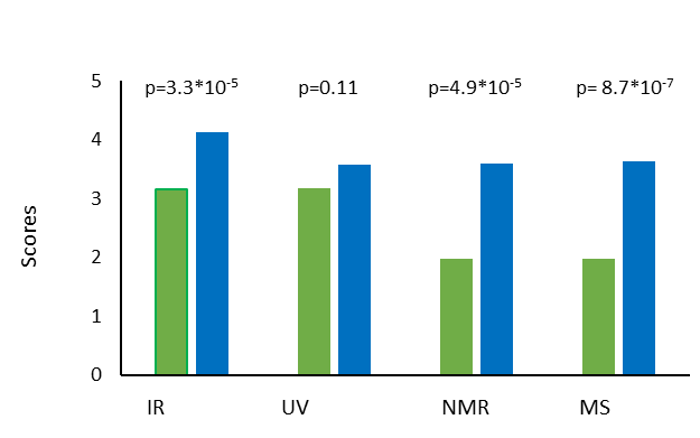
6.3. QuestionnairesThe students completed questionnaires both before and after the laboratory project (S-3 and S-4). Their answers were converted into numerical scores and are presented graphically in Figure 8 and Figure 9. In addition, the results from the students’ evaluation of the project are summarized in Table 1.
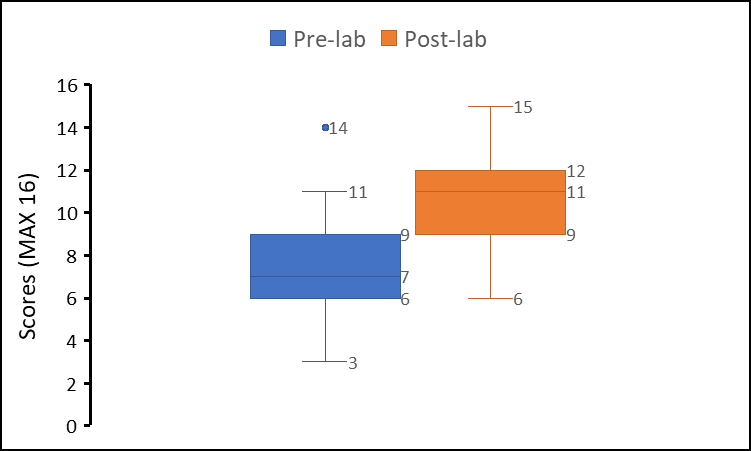
Figure 8 shows the results from the theoretical questions about the aspartame molecule in the pre-laboratory questionnaire (blue box) and the corresponding post-laboratory questionnaire (orange box). Identical questions were used in both the pre- and post-laboratory questionnaires to facilitate direct comparison. Most questions required the students to select one correct answer from five alternatives, and two questions required written answers. In total, 16 questions were included, yielding a maximum achievable score of 16.
Visual inspection of the score distributions in Figure 8 reveals a value of 14 in the pre-laboratory questionnaire, which was identified as an outlier. The origin of the outlier might reflect an incorrect response or considerable prior knowledge. Overall, the scores indicate a substantial learning gain from participation in the project. This observation is supported by the results of Wilcoxon´s rank-sum test at a 5% significance level, in which the pre-laboratory and post-laboratory scores were designated Group 1 and 2, respectively. With a critical value of 8.5 42 with the resulting p-value of 2.44*10-6, this is below 0.05, indicating a statistically significant improvement in learning outcomes.

To further assess changes in students’ understanding of individual analytical techniques, sign tests were applied to the pre- and post-laboratory scores for each method (Figure 9).

The results indicate that the students possessed some prior knowledge of all the spectroscopic methods. This is further confirmed by the results (S-5) from questions 1-6 in S-3. However, the data in Figure 9 indicates an overall improvement in understanding across all methods following the project, with MS showing most pronounced gain. To support the findings, a sign test for each analytical method, along with the corresponding p-values, is displayed above each pair of histograms in Figure 9. At a 5% significance level, p-values below 0.05 were considered statistically significant. The results indicate that the most substantial knowledge gain occurred for MS (p = 8.7*10-7) followed by NMR (p = 4,9*10-5) and IR spectroscopy (p= 3.3*10-5 ). In contrast, UV did not show significant improvements (p = 0.11). A plausible explanation is that students already possessed considerable prior knowledge of UV, resulting in only minor additional gains.
Table 1 summarizes the students’ evaluations of the project and includes descriptive statistics. Because the underlaying distribution is unknown, a confidence interval based on three times the standard deviation has been provided. The students evaluated the project by responding to questions regarding the adequacy of guidance, time requirements, level of difficulty, learning outcomes, and overall interest. The maximum possible score was 80, with a mean score of 63.12 across all respondents. The highest and lowest scores were 73 and 49, respectively.
Overall, a mean score of 63.12 indicates that the students found the project both useful and educational, resulting in substantial learning outcomes. The survey offered valuable insights for instructors regarding the structure and content of the project. As observed from Figure 9, the most significant academic challenges for the students appear to be the NMR and MS sections. Nevertheless, these techniques are fundamental analytical methods in chemistry, underscoring the importance of further strengthening instruction in NMR and MS at bachelor level.
A laboratory project was developed for undergraduate students, involving a comprehensive analysis of aspartame using UV, IR and NMR spectroscopy, as well as mass spectrometry, followed by spectral elucidation. All spectra displayed important analytical signals typically introduced in introductory courses. The project included sample preparation, instrumentation, and interpretation of spectral data, providing the students with experience directly relevant to professional analytical contexts. It also demonstrated that real-world samples can be more challenging than textbook examples, requiring students to address and discuss practical challenges. These challenges included the low solubility of aspartame, the decomposition of the molecule in acidic environment and at high temperatures, overlapping solvent-peak in the 1H-NMR spectrum, time-consuming experiments, and the preparation of IR-quality KBr tablets.
The project was designed to give the students access to advanced analytical methods and structure interpretation, gradually preparing them for the aspartame analysis, which was the most complex and challenging molecule in the project. The MS component in the aspartame analysis presents opportunities for improvement. The inlet temperature before the GC column induced aspartame decomposition, and employing a direct inlet probe or an LC-MS method should be considered to avoid decomposition before the MS-detector. The NMR spectrum can be improved by pH change or use of a suitable water suppression sequence. Additionally, analyzing a set of NMR and MS spectra together with the students could exemplify the expected level of detail in the analysis report. This may prevent overinterpretation of the spectra and promote a deeper overall understanding concerning application and limitations of the methods.
Given aspartame’s widespread presence in everyday products, combined with frequent media attention regarding food safety, the experiments are situated within a highly relevant context, providing enriched learning experiences. Pre- and post-laboratory questionnaires demonstrated a statistically significant improvement in student learning outcomes from the project. The students found the project both useful and educational. The NMR and MS methods appeared the most challenging and the result from the survey emphasize the need for enhanced instruction and curricular support for these essential analytical techniques in undergraduate chemistry education.
| [1] | Food and Drug Administration (FDA). Aspartame: commissioner’s final decision. Federal Register, 46, 38285–38308.1981[Online].Available: https:// www. fda.gov/ media/89219/download. [Accessed June 27, 2025]. | ||
| In article | |||
| [2] | Schlatter, J. M., Peptide sweetening agents, January 1970. [Online]. Available: https:// patentimages. storage. googleapis.com/ cf/91/32/ffd503bf71bfa6/US3492131.pdf. [Accessed June 27, 2025]. | ||
| In article | |||
| [3] | Blackburn, G. L., Kanders, B. S., Lavin, P. T., Keller. S. D., Whatly, J., “The effect of aspartame as a part of a multidisciplinary weight control program on short- and long-term control of body weight,” American Journal of Clinical Nutrition, 65 (2), 409-418. 1997. | ||
| In article | View Article PubMed | ||
| [4] | Choudhary, A. K., “Aspartame: Should Individuals with Type II Diabetes be taking it?” Current Diabetes Reviews, 14 (4), 350- 362. 2018. | ||
| In article | View Article PubMed | ||
| [5] | Sachdev, R. “Sugar substituents and dental health,” International Basic & Clinical Pharmacology, 7 (9), 1667-1673. 2018. | ||
| In article | View Article | ||
| [6] | Drugs.com “Know more. Be sure,” [Online]. Available: https://www.drugs.com/inactive/aspartame-191.html [Accessed June 27, 2025]. | ||
| In article | |||
| [7] | Magnuson, B., Burdock, G. A., Marsh, G. M., Doull, J., Kroes, R. M., Pariza, M. W., Spencer, P. S., Waddell, W. J., Walker, R., Williams, G. M., “Aspartame: a safety evaluation based on current use levels, regulations, toxicological and epidemiological studies,” Critical Reviews in Toxicology, 37 (8), 629-727. 2007. | ||
| In article | View Article PubMed | ||
| [8] | Choudhary, A. K., Pretorius, E., “Revisiting the safety of aspartame,” Nutrition Reviews, 75 (9), 718-730. 2017. | ||
| In article | View Article PubMed | ||
| [9] | Mahnam, K., Raisi, F., “A theoretical and experimental study of calcium, iron, zinc, cadmium, and sodium ions absorption by aspartame,” Journal of Biological Physics, 43, 87-103. 2017. | ||
| In article | View Article PubMed | ||
| [10] | Goodman. J. E., Boon, D. N.; Jack, M. M. “Perspectives on recent reviews of aspartame cancer epidemiology,” Global Epidemiology, 6, 100117. 2023. | ||
| In article | View Article PubMed | ||
| [11] | International Agency for Research on Cancer, World Health Organization. Aspartame Hazard and Risk Assessment Results Released. [Online]. Available: https://www.iarc.who.int/featured-news/aspartame-hazard-and-risk-assessment-results-released. [Accessed August 2025]. | ||
| In article | |||
| [12] | Mitchell, J. J., Trakadis, Y. J., Scriver, C. R., “Phenylalaninehydroxylase deficiency,” Genetics in Medicine, 13 (8), 607-617. 2011. | ||
| In article | View Article PubMed | ||
| [13] | Williamson, J. C., Silverstein, T. P., “Sweetness of Aspartame: Introducing Key Statistical Concepts in an Upper Division Bioanalytical Laboratory Project,” Journal of Chemical Education, 98 (4), 1233-1241. 2021. | ||
| In article | View Article | ||
| [14] | Fenk, C. J., Kaufman, N., Gerbig, D. B. Jr., “A New Colorimetric Assay of Tabletop Sweeteners Using a Modified Biuret Reagent,” Journal of Chemical Education, 13 (10), 1676-1678. 2007. | ||
| In article | View Article | ||
| [15] | Stein, J. P., “The Sweetness of Aspartame: A Biochemistry Lab for Health Science Chemistry Courses,” Journal of Chemical Education, 74 (9), 1112-1113. 1997. | ||
| In article | View Article | ||
| [16] | Bidlingmeyer, B. A., Schmitz, S., “The Analysis of Artificial Sweeteners and Additives in Beverages by HPLC: An Undergraduate Experiment”. Journal of Chemical Education, 68 (8), A201-A202. 1991. | ||
| In article | View Article | ||
| [17] | McDevitt, V. L., Rodriguez, A. Williams, K. R., “Analysis of Soft Drinks: UV Spectrophotometry, Liquid Chromatography, and Capillary Electrophoresis,” Journal of Chemical Education, 75 (5), 625-629. 1998. | ||
| In article | View Article | ||
| [18] | Conklin, A. R., “Analysis of Aspartame and its Hydrolysis products by Thin-Layer Chromatography,” Journal of Chemical Education, 64 (12) 1065-1066. 1987. | ||
| In article | View Article | ||
| [19] | Bergen III, H. R., Benson, L. M., Naylor, S., “Determination of Aspartame and Caffeine in Carbonated Beverages Utilizing Electrospray Ionization-Mass Spectrometry,” Journal of Chemical Education, 77 (10), 1325-1326. 2000. | ||
| In article | View Article | ||
| [20] | Cavazos-Rocha, N., Rodríguez-Martínez, O., Espinosa-Pedroza, A. Waksman-Minsky, N. Saucedo, A. L., “NMR Teaching Strategies in the Instrumental Analysis Laboratory: Identification and Quantification of Caffeine in Energy Drinks,” Journal of Chemical Education, 100 (5), 1934-1941. 2023. | ||
| In article | View Article | ||
| [21] | Lynch, H. N., Authement, C. C., Maczko, A., Parker, M., Beaty, K., Pathiranage, A. L., “Gas Chromatography–Mass Spectrometry Analysis of Cannabis: Undergraduate Organic Chemistry Laboratory Exercise,” Journal of Chemical Education, 100 (3), 1303-1312. 2023. | ||
| In article | View Article | ||
| [22] | Hill, R. A., Nicholson, C. P., “An Analysis of Ethanol in Commercial Liquors via Quantitative NMR Spectroscopy,” Journal of Chemical Education, 94 (12), 1965-1968. 2017. | ||
| In article | View Article | ||
| [23] | Volmer, D. A., Curbani, L., Parker, T.A., Garcia, J., Schultz, L. D., Borges, E. M., “Determination of Titratable Acidity in Wine Using Potentiometric, Conductometric, and Photometric Methods,” Journal of Chemical Education, 94 (9), 1296-1302. 2017. | ||
| In article | View Article | ||
| [24] | Bott, T. M., Wan, H., “Using Essential Oils to Teach Advanced-Level Organic Chemistry Separation Techniques and Spectroscopy,” Journal of Chemical Education, 90 (8), 1064-1066. 2013. | ||
| In article | View Article | ||
| [25] | Kessler, H., Russo, C. M., Fumo, V., O’Reilly, M. C., “What’s in a Tablet? Extraction and Spectroscopic Identification of Pharmaceutical Unknowns,” Journal of Chemical Education, 99 (8), 3024-3029. 2022. | ||
| In article | View Article | ||
| [26] | Sens da Silva, R., Borges, E. M., “Quantitative Analysis Using a Flatbed Scanner: Aspirin Quantification in Pharmaceutical Tablets,” Journal of Chemical Education, 96 (7), 1519-1526. 2019. | ||
| In article | View Article | ||
| [27] | Leiren, M. K., Steinkopf, S. L., “Introducing NMR to Biomedical Laboratory Scientists Through a Laboratory Exercise; Synthesis, Structure Determination and Quantization of Aspirin by Employing a 1 H-NMR Bench Top Instrument,” World Journal of Chemical Education, 10 (1), 8-19. 2022. | ||
| In article | View Article | ||
| [28] | Sequeira, C. A., de Souza Júnior, R. S., Borges, E. M., “A STEAM-Based Laboratory Approach: Evaluating Vitamin C Content with Multiple Titration and Statistical Methods,” Journal of Chemical Education, 102 (7), 3018-3026. 2025. | ||
| In article | View Article | ||
| [29] | Malschitzky, M. E. T., Sequeira, C. A., Borges, E. M. “Innovative 96-Well Plate Imaging for Quantifying Hydrogen Peroxide in Cow`s Milk: A Practical Teaching Tool for Analytical Chemistry,” Journal of Chemical Education, 102 (4), 1651-1661. 2025. | ||
| In article | View Article | ||
| [30] | Hulien, M. L., Lekse, J. W., Rosmus, K. A., Devlin, K. P., Glenn, J. R.; Wisneski, S. D., Wildfong, P., Lake, C. H., MacNeil, J. H., Aitken, J. A., “An Inquiry-Based Project Focused on the X ray Powder Diffraction Analysis of Common Household Solids” Journal of Chemical Education, 92 (12), 2152-2156. 2015. | ||
| In article | View Article | ||
| [31] | Lefebvre, B., Corrin, T., Simpson, A. J., Shirzadi, A., Burrow, T. E., Dicks, A. P. “Use of NMR and NMR Prediction Software to Identify Components in Red Bull Energy Drinks,” Journal of Chemical Education, 86 (3), 360-362. 2009. | ||
| In article | View Article | ||
| [32] | Bendorf, H. D., Vebrosky, E. N., Eck, B. J., “Synthesis and Characterization of 1,4-Dihydro-3,1-benzoxazines and 1,2,3,4-Tetrahydroquinazolines: An Unknown Structure Determination Experiment,” Journal of Chemical Education,93 (9), 1637-1641. 2016. | ||
| In article | View Article | ||
| [33] | Rouillard, M., Rabine, J.-P., Forrest, T., “Multispectroscopy: Online Structure Determination Exercises,” Journal of Chemical Education, 88 (3), 363-363. 2011. | ||
| In article | View Article | ||
| [34] | Field, L. D., Sternhell, S., Kalman, J. R., Organic Structures from Spectra, 4th ed.; John Wiley and Sons: Chichester, 2008. | ||
| In article | |||
| [35] | Franco-Mariscal, A. J., “Exploring the Everyday Context of Chemical Elements: Discovering the Elements of Car Components,” Journal of Chemical Education, 92 (10)1672-1677. 2015. | ||
| In article | View Article | ||
| [36] | Pringle, D. L., Henderleiter, J., “Effects of Context-Based Laboratory Experiments on Attitudes of Analytical Chemistry Students,” Journal of Chemical Education, 76 (1), 100-103. 1999. | ||
| In article | View Article | ||
| [37] | Sevian, H., Dori, Y. J., Parchmann, I., “How does STEM Context-Based Learning Work: What We Know and What We Still do not Know,” International Journal Science Education, 40 (10), 1095-1107. 2018. | ||
| In article | View Article | ||
| [38] | Scarborough. D. L. A., HallKellie, R. D., Vanderkruk. E. N., “Laboratory Research Projects in Undergraduate Environmental and Analytical Chemistry,” Journal of Chemical Education, 99 (4)1672-1681. 2022. | ||
| In article | View Article | ||
| [39] | Keen, C., Couture, S., El Meseh, N. A., Sevian, H., “Connecting Theory to Life: Learning Greener Electrochemistry by Taking Apart a Common Battery,” Journal of Chemical Education, 97 (4), 934-942. 2020. | ||
| In article | View Article | ||
| [40] | Maharaj, F. D. R., Wu, W., Zhou, Y., Schwanz, L. T., Marshak, M. P., “Exploring Real-World Applications of Electrochemistry by Constructing a Rechargeable Lithium-Ion Battery,” Journal of Chemical Education, 96 (12), 3014-3017. 2019. | ||
| In article | View Article | ||
| [41] | Nida, S., Marsuki, M. F., Eilks, I., “Palm-Oil-Based Biodiesel in Indonesia: A Case Study on a Socioscientific Issue That Engages Students to Learn Chemistry and Its Impact on Society,” Journal of Chemical Education, 98 (8), 2536-2548. 2021. | ||
| In article | View Article | ||
| [42] | National Library of Medicine. National Center for Biotechnology Information, USA.gov.PubChem Compound Summary Aspartame. [Online].Available: https:// pubchem.ncbi.nlm.nih.gov/ compound/ Aspartame. [Accessed June 2025]. | ||
| In article | |||
| [43] | Homler, B., Properties and Stability of Aspartame, Food Technol., 38 (7), 50-55. 1984. | ||
| In article | |||
| [44] | Wetzel, C. R., Bell, L. N., “Chemical Stability of Encapsulated Aspartame in Cakes Without Added Sugar,” Food Chemistry, 63 (1), 33-37. 1998. | ||
| In article | View Article | ||
| [45] | Yakici. T., Arici. M. “Storage Stability of Aspartame in Orange Flavored Soft Drinks,” International Journal of Food Properties, 16 (3), 698-705. 2013. | ||
| In article | View Article | ||
| [46] | Hutchinson, S. A., Ho, G. S., Ho, C-T., “Stability and Degradation for the High-Intensity Sweeteners: Aspartame, Alitame and Sucralose,” Food Reviews International, 15 (2), 249-261. 1999. | ||
| In article | View Article | ||
| [47] | Sabah, S., Scriba, G. K. E., “Determination of Aspartame and its Degradation and Epimerization Products by Capillary Electrophoresis,” Journal of Pharmaceutical and Biomedical Analysis, 16 (6), 1089-1096. 1998. | ||
| In article | View Article PubMed | ||
| [48] | Gaines, S. M., Bada, J. L. “Aspartame Decomposition and Epimerization in the Diketopiperazine and Dipeptide Products as a Function of pH and Temperature,” Journal of Organic Chemistry, 53 (12), 2757-2764. 1988. | ||
| In article | View Article | ||
| [49] | Real Statistics Using Excel. Wilcoxon Rank-Sum Table. [Online]. Available:https://real-statistics.com/statistics-tables/wilcoxon-rank-sum-table-independent-samples/.[Accessed July 2025]. | ||
| In article | |||
| [50] | Fleming, I., Williams, D., Spectroscopic methods in organic chemistry, 7th ed.; Springer Nature: Switzerland AG, 2019. | ||
| In article | View Article | ||
| [51] | Ebisawa, K., Nagashima, N., Fukuhara, K.-i., Kumon, S., Kishimoto, S.-i., Suzuki, E.-i., Yoneda, S., Umeyama, H., “Intermediate State During the Crystal Transition in Aspartame, Studied with Thermal Analysis, Solid-State NMR, and Molecular Dynamics Simulation,” Chemical and Pharmaceutical Bulletin, 48 (5), 708-715. 2000. | ||
| In article | View Article PubMed | ||
| [52] | Tosa, N., Moldovan, Z., Bratu, I., “Simultaneous Determination of Some Artificial Sweeteners in Ternary Formulations by FT-IR and EI-MS,”. AIP Conference Proceedings, 1425 (1), 98-101. 2012. | ||
| In article | View Article | ||
Published with license by Science and Education Publishing, Copyright © 2026 Marit Kristin Leiren, Kari Grete Nordli Børve, Rhiannon Tveiten Lewis and Signe Steinkopf
 This work is licensed under a Creative Commons Attribution 4.0 International License. To view a copy of this license, visit
http://creativecommons.org/licenses/by/4.0/
This work is licensed under a Creative Commons Attribution 4.0 International License. To view a copy of this license, visit
http://creativecommons.org/licenses/by/4.0/
| [1] | Food and Drug Administration (FDA). Aspartame: commissioner’s final decision. Federal Register, 46, 38285–38308.1981[Online].Available: https:// www. fda.gov/ media/89219/download. [Accessed June 27, 2025]. | ||
| In article | |||
| [2] | Schlatter, J. M., Peptide sweetening agents, January 1970. [Online]. Available: https:// patentimages. storage. googleapis.com/ cf/91/32/ffd503bf71bfa6/US3492131.pdf. [Accessed June 27, 2025]. | ||
| In article | |||
| [3] | Blackburn, G. L., Kanders, B. S., Lavin, P. T., Keller. S. D., Whatly, J., “The effect of aspartame as a part of a multidisciplinary weight control program on short- and long-term control of body weight,” American Journal of Clinical Nutrition, 65 (2), 409-418. 1997. | ||
| In article | View Article PubMed | ||
| [4] | Choudhary, A. K., “Aspartame: Should Individuals with Type II Diabetes be taking it?” Current Diabetes Reviews, 14 (4), 350- 362. 2018. | ||
| In article | View Article PubMed | ||
| [5] | Sachdev, R. “Sugar substituents and dental health,” International Basic & Clinical Pharmacology, 7 (9), 1667-1673. 2018. | ||
| In article | View Article | ||
| [6] | Drugs.com “Know more. Be sure,” [Online]. Available: https://www.drugs.com/inactive/aspartame-191.html [Accessed June 27, 2025]. | ||
| In article | |||
| [7] | Magnuson, B., Burdock, G. A., Marsh, G. M., Doull, J., Kroes, R. M., Pariza, M. W., Spencer, P. S., Waddell, W. J., Walker, R., Williams, G. M., “Aspartame: a safety evaluation based on current use levels, regulations, toxicological and epidemiological studies,” Critical Reviews in Toxicology, 37 (8), 629-727. 2007. | ||
| In article | View Article PubMed | ||
| [8] | Choudhary, A. K., Pretorius, E., “Revisiting the safety of aspartame,” Nutrition Reviews, 75 (9), 718-730. 2017. | ||
| In article | View Article PubMed | ||
| [9] | Mahnam, K., Raisi, F., “A theoretical and experimental study of calcium, iron, zinc, cadmium, and sodium ions absorption by aspartame,” Journal of Biological Physics, 43, 87-103. 2017. | ||
| In article | View Article PubMed | ||
| [10] | Goodman. J. E., Boon, D. N.; Jack, M. M. “Perspectives on recent reviews of aspartame cancer epidemiology,” Global Epidemiology, 6, 100117. 2023. | ||
| In article | View Article PubMed | ||
| [11] | International Agency for Research on Cancer, World Health Organization. Aspartame Hazard and Risk Assessment Results Released. [Online]. Available: https://www.iarc.who.int/featured-news/aspartame-hazard-and-risk-assessment-results-released. [Accessed August 2025]. | ||
| In article | |||
| [12] | Mitchell, J. J., Trakadis, Y. J., Scriver, C. R., “Phenylalaninehydroxylase deficiency,” Genetics in Medicine, 13 (8), 607-617. 2011. | ||
| In article | View Article PubMed | ||
| [13] | Williamson, J. C., Silverstein, T. P., “Sweetness of Aspartame: Introducing Key Statistical Concepts in an Upper Division Bioanalytical Laboratory Project,” Journal of Chemical Education, 98 (4), 1233-1241. 2021. | ||
| In article | View Article | ||
| [14] | Fenk, C. J., Kaufman, N., Gerbig, D. B. Jr., “A New Colorimetric Assay of Tabletop Sweeteners Using a Modified Biuret Reagent,” Journal of Chemical Education, 13 (10), 1676-1678. 2007. | ||
| In article | View Article | ||
| [15] | Stein, J. P., “The Sweetness of Aspartame: A Biochemistry Lab for Health Science Chemistry Courses,” Journal of Chemical Education, 74 (9), 1112-1113. 1997. | ||
| In article | View Article | ||
| [16] | Bidlingmeyer, B. A., Schmitz, S., “The Analysis of Artificial Sweeteners and Additives in Beverages by HPLC: An Undergraduate Experiment”. Journal of Chemical Education, 68 (8), A201-A202. 1991. | ||
| In article | View Article | ||
| [17] | McDevitt, V. L., Rodriguez, A. Williams, K. R., “Analysis of Soft Drinks: UV Spectrophotometry, Liquid Chromatography, and Capillary Electrophoresis,” Journal of Chemical Education, 75 (5), 625-629. 1998. | ||
| In article | View Article | ||
| [18] | Conklin, A. R., “Analysis of Aspartame and its Hydrolysis products by Thin-Layer Chromatography,” Journal of Chemical Education, 64 (12) 1065-1066. 1987. | ||
| In article | View Article | ||
| [19] | Bergen III, H. R., Benson, L. M., Naylor, S., “Determination of Aspartame and Caffeine in Carbonated Beverages Utilizing Electrospray Ionization-Mass Spectrometry,” Journal of Chemical Education, 77 (10), 1325-1326. 2000. | ||
| In article | View Article | ||
| [20] | Cavazos-Rocha, N., Rodríguez-Martínez, O., Espinosa-Pedroza, A. Waksman-Minsky, N. Saucedo, A. L., “NMR Teaching Strategies in the Instrumental Analysis Laboratory: Identification and Quantification of Caffeine in Energy Drinks,” Journal of Chemical Education, 100 (5), 1934-1941. 2023. | ||
| In article | View Article | ||
| [21] | Lynch, H. N., Authement, C. C., Maczko, A., Parker, M., Beaty, K., Pathiranage, A. L., “Gas Chromatography–Mass Spectrometry Analysis of Cannabis: Undergraduate Organic Chemistry Laboratory Exercise,” Journal of Chemical Education, 100 (3), 1303-1312. 2023. | ||
| In article | View Article | ||
| [22] | Hill, R. A., Nicholson, C. P., “An Analysis of Ethanol in Commercial Liquors via Quantitative NMR Spectroscopy,” Journal of Chemical Education, 94 (12), 1965-1968. 2017. | ||
| In article | View Article | ||
| [23] | Volmer, D. A., Curbani, L., Parker, T.A., Garcia, J., Schultz, L. D., Borges, E. M., “Determination of Titratable Acidity in Wine Using Potentiometric, Conductometric, and Photometric Methods,” Journal of Chemical Education, 94 (9), 1296-1302. 2017. | ||
| In article | View Article | ||
| [24] | Bott, T. M., Wan, H., “Using Essential Oils to Teach Advanced-Level Organic Chemistry Separation Techniques and Spectroscopy,” Journal of Chemical Education, 90 (8), 1064-1066. 2013. | ||
| In article | View Article | ||
| [25] | Kessler, H., Russo, C. M., Fumo, V., O’Reilly, M. C., “What’s in a Tablet? Extraction and Spectroscopic Identification of Pharmaceutical Unknowns,” Journal of Chemical Education, 99 (8), 3024-3029. 2022. | ||
| In article | View Article | ||
| [26] | Sens da Silva, R., Borges, E. M., “Quantitative Analysis Using a Flatbed Scanner: Aspirin Quantification in Pharmaceutical Tablets,” Journal of Chemical Education, 96 (7), 1519-1526. 2019. | ||
| In article | View Article | ||
| [27] | Leiren, M. K., Steinkopf, S. L., “Introducing NMR to Biomedical Laboratory Scientists Through a Laboratory Exercise; Synthesis, Structure Determination and Quantization of Aspirin by Employing a 1 H-NMR Bench Top Instrument,” World Journal of Chemical Education, 10 (1), 8-19. 2022. | ||
| In article | View Article | ||
| [28] | Sequeira, C. A., de Souza Júnior, R. S., Borges, E. M., “A STEAM-Based Laboratory Approach: Evaluating Vitamin C Content with Multiple Titration and Statistical Methods,” Journal of Chemical Education, 102 (7), 3018-3026. 2025. | ||
| In article | View Article | ||
| [29] | Malschitzky, M. E. T., Sequeira, C. A., Borges, E. M. “Innovative 96-Well Plate Imaging for Quantifying Hydrogen Peroxide in Cow`s Milk: A Practical Teaching Tool for Analytical Chemistry,” Journal of Chemical Education, 102 (4), 1651-1661. 2025. | ||
| In article | View Article | ||
| [30] | Hulien, M. L., Lekse, J. W., Rosmus, K. A., Devlin, K. P., Glenn, J. R.; Wisneski, S. D., Wildfong, P., Lake, C. H., MacNeil, J. H., Aitken, J. A., “An Inquiry-Based Project Focused on the X ray Powder Diffraction Analysis of Common Household Solids” Journal of Chemical Education, 92 (12), 2152-2156. 2015. | ||
| In article | View Article | ||
| [31] | Lefebvre, B., Corrin, T., Simpson, A. J., Shirzadi, A., Burrow, T. E., Dicks, A. P. “Use of NMR and NMR Prediction Software to Identify Components in Red Bull Energy Drinks,” Journal of Chemical Education, 86 (3), 360-362. 2009. | ||
| In article | View Article | ||
| [32] | Bendorf, H. D., Vebrosky, E. N., Eck, B. J., “Synthesis and Characterization of 1,4-Dihydro-3,1-benzoxazines and 1,2,3,4-Tetrahydroquinazolines: An Unknown Structure Determination Experiment,” Journal of Chemical Education,93 (9), 1637-1641. 2016. | ||
| In article | View Article | ||
| [33] | Rouillard, M., Rabine, J.-P., Forrest, T., “Multispectroscopy: Online Structure Determination Exercises,” Journal of Chemical Education, 88 (3), 363-363. 2011. | ||
| In article | View Article | ||
| [34] | Field, L. D., Sternhell, S., Kalman, J. R., Organic Structures from Spectra, 4th ed.; John Wiley and Sons: Chichester, 2008. | ||
| In article | |||
| [35] | Franco-Mariscal, A. J., “Exploring the Everyday Context of Chemical Elements: Discovering the Elements of Car Components,” Journal of Chemical Education, 92 (10)1672-1677. 2015. | ||
| In article | View Article | ||
| [36] | Pringle, D. L., Henderleiter, J., “Effects of Context-Based Laboratory Experiments on Attitudes of Analytical Chemistry Students,” Journal of Chemical Education, 76 (1), 100-103. 1999. | ||
| In article | View Article | ||
| [37] | Sevian, H., Dori, Y. J., Parchmann, I., “How does STEM Context-Based Learning Work: What We Know and What We Still do not Know,” International Journal Science Education, 40 (10), 1095-1107. 2018. | ||
| In article | View Article | ||
| [38] | Scarborough. D. L. A., HallKellie, R. D., Vanderkruk. E. N., “Laboratory Research Projects in Undergraduate Environmental and Analytical Chemistry,” Journal of Chemical Education, 99 (4)1672-1681. 2022. | ||
| In article | View Article | ||
| [39] | Keen, C., Couture, S., El Meseh, N. A., Sevian, H., “Connecting Theory to Life: Learning Greener Electrochemistry by Taking Apart a Common Battery,” Journal of Chemical Education, 97 (4), 934-942. 2020. | ||
| In article | View Article | ||
| [40] | Maharaj, F. D. R., Wu, W., Zhou, Y., Schwanz, L. T., Marshak, M. P., “Exploring Real-World Applications of Electrochemistry by Constructing a Rechargeable Lithium-Ion Battery,” Journal of Chemical Education, 96 (12), 3014-3017. 2019. | ||
| In article | View Article | ||
| [41] | Nida, S., Marsuki, M. F., Eilks, I., “Palm-Oil-Based Biodiesel in Indonesia: A Case Study on a Socioscientific Issue That Engages Students to Learn Chemistry and Its Impact on Society,” Journal of Chemical Education, 98 (8), 2536-2548. 2021. | ||
| In article | View Article | ||
| [42] | National Library of Medicine. National Center for Biotechnology Information, USA.gov.PubChem Compound Summary Aspartame. [Online].Available: https:// pubchem.ncbi.nlm.nih.gov/ compound/ Aspartame. [Accessed June 2025]. | ||
| In article | |||
| [43] | Homler, B., Properties and Stability of Aspartame, Food Technol., 38 (7), 50-55. 1984. | ||
| In article | |||
| [44] | Wetzel, C. R., Bell, L. N., “Chemical Stability of Encapsulated Aspartame in Cakes Without Added Sugar,” Food Chemistry, 63 (1), 33-37. 1998. | ||
| In article | View Article | ||
| [45] | Yakici. T., Arici. M. “Storage Stability of Aspartame in Orange Flavored Soft Drinks,” International Journal of Food Properties, 16 (3), 698-705. 2013. | ||
| In article | View Article | ||
| [46] | Hutchinson, S. A., Ho, G. S., Ho, C-T., “Stability and Degradation for the High-Intensity Sweeteners: Aspartame, Alitame and Sucralose,” Food Reviews International, 15 (2), 249-261. 1999. | ||
| In article | View Article | ||
| [47] | Sabah, S., Scriba, G. K. E., “Determination of Aspartame and its Degradation and Epimerization Products by Capillary Electrophoresis,” Journal of Pharmaceutical and Biomedical Analysis, 16 (6), 1089-1096. 1998. | ||
| In article | View Article PubMed | ||
| [48] | Gaines, S. M., Bada, J. L. “Aspartame Decomposition and Epimerization in the Diketopiperazine and Dipeptide Products as a Function of pH and Temperature,” Journal of Organic Chemistry, 53 (12), 2757-2764. 1988. | ||
| In article | View Article | ||
| [49] | Real Statistics Using Excel. Wilcoxon Rank-Sum Table. [Online]. Available:https://real-statistics.com/statistics-tables/wilcoxon-rank-sum-table-independent-samples/.[Accessed July 2025]. | ||
| In article | |||
| [50] | Fleming, I., Williams, D., Spectroscopic methods in organic chemistry, 7th ed.; Springer Nature: Switzerland AG, 2019. | ||
| In article | View Article | ||
| [51] | Ebisawa, K., Nagashima, N., Fukuhara, K.-i., Kumon, S., Kishimoto, S.-i., Suzuki, E.-i., Yoneda, S., Umeyama, H., “Intermediate State During the Crystal Transition in Aspartame, Studied with Thermal Analysis, Solid-State NMR, and Molecular Dynamics Simulation,” Chemical and Pharmaceutical Bulletin, 48 (5), 708-715. 2000. | ||
| In article | View Article PubMed | ||
| [52] | Tosa, N., Moldovan, Z., Bratu, I., “Simultaneous Determination of Some Artificial Sweeteners in Ternary Formulations by FT-IR and EI-MS,”. AIP Conference Proceedings, 1425 (1), 98-101. 2012. | ||
| In article | View Article | ||