The Aghien Lagoon watershed belongs to the hydrographic system supplying drinking water to the Abidjan metropolitan area in southern Côte d'Ivoire. This study aims to quantify and map the dynamics of soil water erosion in this watershed over the period 1987-2023, using remote sensing and geographic information systems. The Revised Universal Soil Loss Equation (RUSLE) was applied, combining five factors: rainfall erosivity (R), soil erodibility (K), slope length and steepness (LS), vegetation cover (C) and support practices (P). The R factor was estimated from CHIRPS data for four dates (1987, 2003, 2015 and 2023), and the C factor from the corresponding land-use maps. The results show a continuous worsening of erosion: the mean soil loss rises from 22.8 to 59.8 t ha⁻¹ yr⁻¹, while the area subject to extreme erosion expands from 1.2% to 13.7% of the watershed. This dynamic coincides with the retreat of dense forest from 32.4% to 9.0% of the watershed, the fourfold increase of bare soils from 6.6% to 26.8%, and the rise of the mean C factor of emerged land (from 0.26 to 0.44), combined with record rainfall erosivity in 2023 (R = 368.17 against about 228 over 1987-2015): vegetation cover degradation appears as the main driver of erosion, amplified by recent rainfall forcing. These results help identify priority areas for erosion control, within a perspective of sustainable management of a strategic peri-urban watershed.
Soil is a fundamental natural resource, supporting terrestrial ecosystems and many services essential to human societies: food production, water-cycle regulation, carbon storage and nutrient recycling. Its degradation by water erosion is among the most concerning processes for watershed management, since it results from natural and anthropogenic factors that are difficult to control over time and space; human activities have moreover driven a marked and observable acceleration of erosion rates worldwide 1.
In Côte d'Ivoire, the intensive exploitation of forest resources for agriculture and rapid urbanisation cause substantial soil losses 2, 3. The Aghien Lagoon watershed, located on the north-eastern outskirts of Abidjan, is particularly exposed: demographic pressure, the often-uncontrolled expansion of built-up areas and the regression of the protective vegetation cover increase runoff and trigger increasingly intense erosion processes. Yet the Aghien Lagoon, one of the largest freshwater reserves near Abidjan, has been identified by the State of Côte d'Ivoire as an alternative resource for the drinking-water supply of the metropolis, whose aquifer is weakened by demographic growth and soil sealing 4, 5. A recent study quantified water erosion on this same watershed using Landsat imagery from 2016 and 2020 6; several works have already warned of the vulnerability of this hydrosystem, whether through the degradation of the physico-chemical and bacteriological quality of its waters 4 or the multiplication of anthropogenic pollution sources across its watershed 5. Erosion of the latter directly threatens the resource, through siltation and the transfer of sediments and associated pollutants.
The spatial quantification of erosion therefore represents a major challenge for urban planning and resource conservation. Satellite remote sensing, through its temporal coverage and its ability to inform the controlling factors of erosion (topography, soil, vegetation cover, practices), has become a central tool for mapping these processes at the watershed scale 7. In this context, the use of the universal soil loss equation, in its revised form (RUSLE), coupled with geographic information systems, offers an effective approach to estimate soil loss and guide decision-making 8, 9. Recent studies in Ivorian peri-urban settings have demonstrated the relevance of this approach. The present study is distinguished by a resolutely diachronic analysis: rather than a single snapshot, it reconstructs erosion dynamics over nearly four decades (1987-2023) in order to identify its drivers. It thus aims to quantify erosion, map its evolution and highlight the determining factors, within an integrated water-resource management approach in a context of strong anthropogenic pressure.
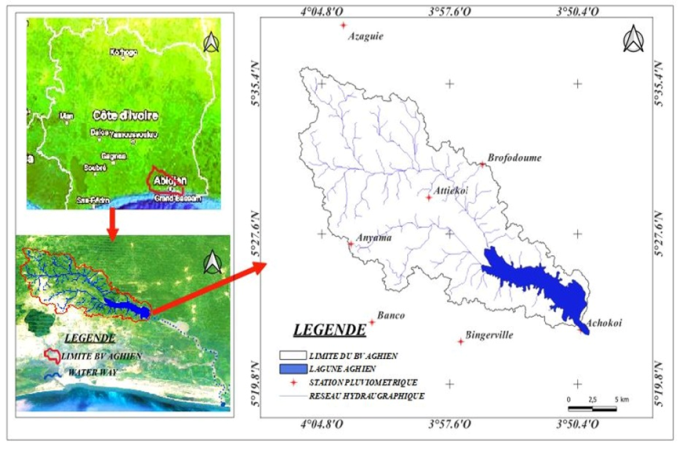
Geographically, the Aghien Lagoon watershed is located in the Abidjan District, in southern Côte d'Ivoire, approximately between 3.50° and 4.07° west longitude and 5.25° and 5.35° north latitude (Figure 1). It covers an area of about 351 km². The climate is of transitional equatorial type, with a bimodal rainfall regime and a mean annual total of the order of 1,400 to 2,450 mm depending on the year. The watershed is subject to increasing urbanisation linked to the expansion of Abidjan and Bingerville.

The data used in this study comprise: monthly rainfall from the CHIRPS satellite product (Climate Hazards Group InfraRed Precipitation with Station Data) 10, extracted for the four study years (1987, 2003, 2015, 2023) at eight stations distributed across the watershed; soil data for the Aghien Lagoon watershed derived from the SoilGrids database 11; topographic data from a 30 m spatial resolution digital elevation model (DEM) obtained from the ASTER sensor and downloaded from http://earthexplorer.usgs.gov/; and Landsat 5 TM (1987), Landsat 7 ETM+ (2003) and Landsat 8 OLI (2015 and 2023) satellite images of scenes 195-56 and 196-56 available at http://earthexplorer.usgs.gov/. The Landsat scenes were radiometrically and atmospherically corrected prior to a supervised classification into the land-use classes of Table 1, and non-erodible areas (water bodies and built-up surfaces) were masked out before the erosion computation. The resulting land-cover maps were partly reused here as an input layer for the C factor rather than produced as an original classification product of this study; where required, the full accuracy assessment of the source classification (overall accuracy, Kappa coefficient and per-class metrics) can be provided.
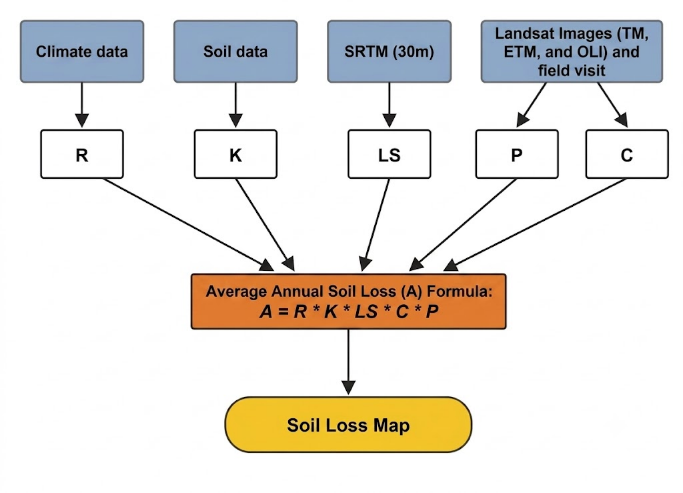
2.3. MethodologySeveral methods are generally used to assess soil erosion. In this study, the mean annual soil loss (t ha⁻¹ yr⁻¹) of the Aghien watershed was estimated using the Revised Universal Soil Loss Equation (RUSLE), the product of five factors:
 | (1) |
Each factor was estimated as a raster layer, from the data sources described below, and the layers were then combined in a geographic information system (Figure 2). All processing was carried out in UTM zone 30N projection (EPSG:32630), on a common reference grid.

The R factor expresses climatic aggressiveness, that is, the ability of rainfall to detach and transport soil particles. Its rigorous calculation relies on the EI₃₀ erosivity index, which requires fine-time-step pluviographic records, unavailable for the study area. In a data-scarce context, the Modified Fournier Index (MFI; Arnoldus, 1980 12) is a recognised estimator of erosivity, computed from monthly rainfall alone (Eq. 2):
 | (2) |
where pᵢ is the rainfall depth of month i (mm) and P the annual total (mm). In this study, the MFI was retained directly as an estimator of the R factor, in line with a well-established practice in poorly instrumented tropical settings 12, 13, where the MFI has been shown to correlate with rainfall erosivity and to provide a usable surrogate for the EI₃₀ index in the absence of high-frequency records. It should nevertheless be stressed that the MFI is used here as a proxy for the R factor: MFI values are expressed on an index scale and are not dimensionally equivalent to the EI₃₀-based R factor (MJ mm ha⁻¹ h⁻¹ yr⁻¹). The resulting R-factor values are therefore treated as relative indices rather than absolute EI₃₀ equivalents, and the soil-loss estimates derived from them are interpreted primarily in terms of spatial and temporal trends rather than absolute magnitudes. The use of the MFI as a surrogate for the R factor rests on the well-documented relationship between the Fournier-type indices and rainfall erosivity: the MFI was originally proposed by Arnoldus 12 precisely as an approximation of the erosivity factor, and monthly-rainfall regressions of the R factor have since been established for a wide range of climates, including tropical settings 13. In the absence of pluviographic records allowing a locally calibrated MFI-EI₃₀ regression for the study area, we adopt this widely used approximation while restricting the interpretation of the results to relative spatial and temporal patterns; deriving a local MFI-EI₃₀ calibration from high-frequency rainfall data is identified as a priority for future work. Monthly rainfall was extracted from the CHIRPS product for the four observed dates at eight stations across the watershed. The resulting point values were then spatialized over the whole watershed by radial basis function (RBF) interpolation. It should be noted that the CHIRPS product, although widely used for erosivity studies in data-scarce regions, has recognised limitations in capturing short-duration rainfall intensity and extreme events, which are precisely the components that drive erosivity. The R-factor estimates derived from monthly CHIRPS totals may therefore smooth out sub-monthly intensity peaks; this is an additional reason to interpret the absolute R and soil-loss values as relative indicators of spatial and temporal patterns rather than exact quantities.
The K factor expresses the intrinsic susceptibility of soil to detachment and transport, as a function of its texture, organic-matter content, structure and permeability. It was estimated using the Wischmeier and Smith (1978) nomograph equation 7 (Eq. 3), from soil properties derived from the SoilGrids database:

 | (3) |
where M = (% silt + % very fine sand) × (100 − % clay) is the textural parameter, OM the organic-matter content (%), s the soil-structure class and p the permeability class. The result, initially in imperial units, was converted to SI units (multiplication by 0.1317). Textural parameters and organic-carbon content were extracted from SoilGrids for the surface horizon (0-5 cm), organic matter being estimated from organic carbon using the usual conversion factor of 1.724. Non-erodible areas (built-up land, water bodies) were excluded and assigned a null value.
The topographic factor LS combines the effect of slope length (L) and slope steepness (S). It was computed using the approach of Desmet and Govers (1996) 14, which replaces slope length with the upslope contributing area of each cell, better suited to complex terrain and computable from the flow accumulation derived from the DEM (Eq. 4):
 | (4) |
where Aᵢⱼ is the upslope contributing area of cell (i,j), D the cell size (m), x a flow-direction factor and m an exponent depending on slope angle. The steepness factor S was computed following McCool et al. (1987) 15, distinguishing gentle and steep slopes (Eq. 5):
 | (5) |
where θ is the slope angle. Flow accumulation and slope were derived from the DEM. Extreme LS values were capped at 36.8 to limit local overestimation on very steep pixels.
The C factor accounts for the protective effect of vegetation cover and land use against erosion; it ranges from 0 (maximum protection, non-erodible surface) to 1 (bare soil). It was estimated by assigning a reference value to each class of the land-use maps (Table 1), derived from supervised classification of Landsat images for each of the four studied dates. The per-class C values were drawn from the literature on West African tropical settings 3. The specific values reflect the contrasting protective capacity of each cover type in the study area. Dense forest is assigned a very low value (0.001) because its multi-layered canopy and permanent litter layer almost completely shield the soil from raindrop impact, whereas degraded forest and plantations receive a higher value (0.080), as their more open, anthropised understorey leaves the soil periodically exposed. Food crops and fallow (0.150) correspond to soils that are seasonally bared during sowing and weeding, while the highest value (0.400) is attributed to scattered settlements and bare soils, where active clearing, earthworks and the absence of vegetation maximise detachment and transport. Water bodies are set to zero as they are non-erodible. A common mask across all dates was applied, so that the C factor statistics refer to the same valid area and remain comparable over time.
The P factor expresses the effect of soil-conservation measures (terraces, contour cropping, cross-slope ridging) that reduce runoff velocity and volume. In the absence of field data documenting such practices at the watershed scale, the P factor was set to 1 over the whole study area, following common practice in comparable data-scarce settings. It should nevertheless be acknowledged that, even where no formal engineered conservation structures exist, traditional smallholder practices frequent in West African farming systems such as contour tillage, mulching, intercropping and vegetated field margins may provide a certain protective effect in the cultivated portions of the watershed. Setting P = 1 everywhere therefore corresponds to a conservative, worst-case assumption, and the soil-loss estimates should be interpreted as maximum values under a “no-conservation” scenario; the actual losses in agricultural areas are likely somewhat lower. Refining the P factor for cultivated land using literature values from comparable West African agricultural systems constitutes a relevant avenue for future work.
To distinguish the contribution of land-cover change from that of rainfall variability in the 2015-2023 increase in soil loss, a factorial sensitivity analysis was performed. Since the soil erodibility (K), topographic (LS) and support-practice (P) factors are time-invariant, only the rainfall-erosivity (R) and cover (C) factors differ between the two dates. The time-invariant term B = K·LS·P was reconstructed at pixel level from the 2015 soil-loss map (B = A₂₀₁₅ / (R₂₀₁₅·C₂₀₁₅), excluding water bodies), and four scenarios were then computed by recombining the R and C layers of the two years: the 2015 reference (R₂₀₁₅·C₂₀₁₅), the 2023 observed state (R₂₀₂₃·C₂₀₂₃), a land-use scenario (R₂₀₁₅·C₂₀₂₃) and a rainfall scenario (R₂₀₂₃·C₂₀₁₅). The difference between each scenario and the reference isolates the corresponding driver, and a residual interaction term captures their combined effect. Because B is reconstructed from the reference year, the analysis is interpreted in relative terms (the share of the increase attributable to each driver) rather than as exact absolute values. The results are reported in Section 3.2 and Table 5.
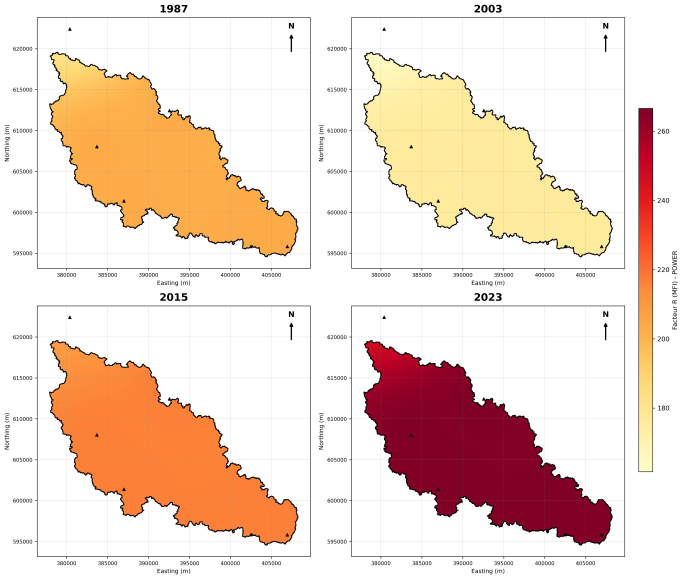
The rainfall erosivity map (Figure 3) was produced for each of the four studied dates. Over the Aghien watershed, MFI values reach 226.23 in 1987, 231.29 in 2003 and 226.92 in 2015. The associated annual rainfall totals are 1,783.8 mm, 1,666.9 mm and 1,499.8 mm respectively. Despite a declining trend in annual rainfall, the small variation in the MFI indicates that the erosive potential of rainfall remained broadly stable for nearly three decades in the area. In 2023, the annual rainfall total reaches 2,447.8 mm, for an MFI value of 368.17, an increase of about 62% relative to the mean observed over 1987-2015. This evolution reflects a marked intensification of rainfall erosivity during that year. Spatially, the R factor shows a weak gradient owing to the limited extent of the watershed relative to the resolution of the rainfall data. It therefore contributes little to the spatial differentiation of erosion within the watershed. Conversely, its strong increase in 2023 directly contributes to the intensification of the soil loss observed at that date.

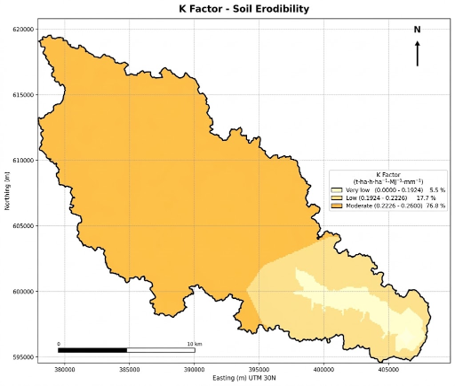
The K factor, derived from the SoilGrids database, ranges from 0.000 to 0.260 t ha h ha⁻¹ MJ⁻¹ mm⁻¹, the highest values corresponding to the soils most susceptible to detachment (Figure 4). Soils of moderate erodibility (K between 0.223 and 0.260) largely dominate the watershed (76.8% of the area), covering all the central and north-western plateaus; low values (0.192-0.223; 17.7%) and very low values (below 0.192; 5.5%) are concentrated in the south-eastern part, in the immediate vicinity of the lagoon. These values reflect the susceptibility of the watershed soils to erosion.

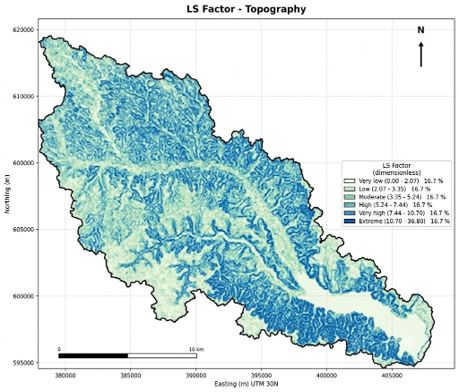
The LS factor, synthesised from slope and slope length derived from the SRTM-type DEM, ranges from 0 to 36.8 and strongly structures the territory (Figure 5). The highest values are located on the steepest slopes that frame the drainage network, whereas the valley bottoms show values close to zero. High LS values favour rill and gully erosion and largely determine the location of intense erosion hotspots.

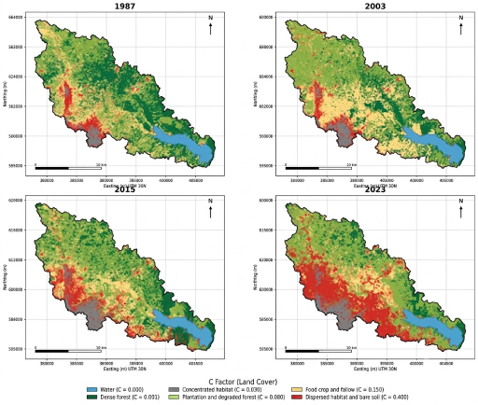
The C factor, which reflects the protective effect of vegetation cover, is the most dynamic factor of this study (Figure 6, Table 2). The best-covered surfaces show low C values, indicating better protection against erosion, whereas bare soils and degraded areas correspond to the highest values, revealing strong vulnerability to erosion. Dense forest (C = 0.001), which still covered 32.4% of the watershed in 1987, declined to 18.9% in 2003 and then to 9.0% in 2023, thus losing more than two-thirds of its extent in thirty-six years. Conversely, the surfaces most vulnerable to erosion, made up of bare soils and scattered settlements (C = 0.40), saw their extent quadruple, rising from 6.6% of the watershed in 1987 to 26.8% in 2023, with a doubling between 2015 and 2023. Crops and fallow (C = 0.15), for their part, regressed from 25.6% to 13.2% over the same period. Water bodies (C = 0), essentially represented by the lagoon, remained relatively stable at around 5.4% of the watershed. As a result, the mean C factor of emerged land rose from 0.26 in 1987 to 0.44 in 2023 (+68%), a signature of generalised degradation of soil protection and increased vulnerability to erosion.

The P factor varies with the conservation works present in the study area. This P factor was set to 1 over the whole Aghien watershed, owing to the absence of documented erosion-control works or practices. This value of 1 across the area indicates the lack of protective effect of conservation practices, leading to a maximum estimate of soil losses.
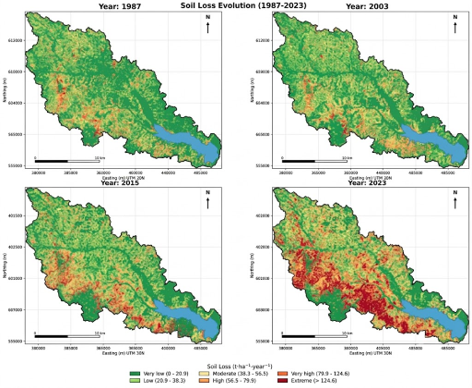
The soil-loss maps (Figure 7) reveal a continuous and marked worsening of water erosion at the watershed scale. The mean soil loss rises from 22.8 t ha⁻¹ yr⁻¹ in 1987 to 59.8 t ha⁻¹ yr⁻¹ in 2023, a 2.6-fold increase in thirty-six years (Table 3). The median follows the same trend, rising from 13.7 to 36.1 t ha⁻¹ yr⁻¹, confirming that the intensification of erosion affects the whole watershed and is not limited to heavily degraded sectors. Maximum soil-loss values reach 750 t ha⁻¹ yr⁻¹ in 2023, on the steepest slopes. Spatially, the highest erosion levels are concentrated in steep-slope sectors, consistent with the influence of the LS factor. Conversely, the surroundings of the lagoon, characterised by gentle slopes, remain relatively preserved.

The distribution of soil losses by class (Table 4) quantifies this progressive worsening of erosion over the study period. The class boundaries were obtained from the statistical distribution of the soil-loss values (using the quantiles of the 2023 map as breakpoints), so that the classes reflect the internal variability of the data set rather than externally imposed limits; they are used here as a consistent scheme for presentation and inter-date comparison rather than as absolute severity categories. The 'extreme' erosion class, which represented only 1.2% of the watershed area in 1987, covers 13.7% in 2023. Conversely, the 'very low' class strongly regresses, falling from 59.2% to 34.8% over the same period. In 2023, the three most erosive classes represent about 34% of the watershed area. The evolution, already clear from 1987-2003, accelerates markedly between 2015 and 2023, the period of the strongest soil sealing. This period, marked by strong surface artificialisation, regression of vegetation cover and increased soil exposure, is favourable to erosive runoff, reflecting substantial soil loss.
The results of the factorial sensitivity analysis are summarised in Table 5. The reference scenario (S0: 2015 cover and 2015 rainfall) yields a mean soil loss of 34.2 t ha⁻¹ yr⁻¹, close to the value observed in 2015, whereas the fully updated scenario (S1: 2023 cover and 2023 rainfall) reaches 84.0 t ha⁻¹ yr⁻¹. When only the land cover is updated to 2023 while the 2015 rainfall is retained (S2), the mean loss rises to 51.8 t ha⁻¹ yr⁻¹, an increase of 17.5 units over the reference; when only the rainfall is updated to 2023 while the 2015 cover is retained (S3), it rises to 55.6 t ha⁻¹ yr⁻¹, an increase of 21.3 units. Relative to the total 2015-2023 increase, the land-use change accounts for about 35%, the rainfall variability for about 43%, and their interaction for the remaining 22%. Both single-factor scenarios (S2 and S3) therefore produce increases of comparable magnitude, with the rainfall effect slightly exceeding the land-use effect. Because the invariant term was reconstructed from the 2015 loss map, the recombined scenarios reproduce the reference year closely but overestimate the absolute 2023 level, so these figures are read as relative shares of the increase rather than as exact absolute values.
3.2. DiscussionThe model implemented to assess soil losses in the Aghien watershed combines the five factors of the RUSLE equation within a geographic information system (GIS). This approach allows qualitative and quantitative data on the different factors of soil degradation to be integrated and processed jointly. The synthesis map shows that soil losses exhibit strong spatial variability under the influence of the different factors: topography (LS) and vegetation cover (C) are the main determinants of the spatial organisation of erosion, while rainfall erosivity (R), whose spatial distribution is relatively homogeneous, mainly modulates the intensity of losses from one period to another.
The main contribution of this study lies in its temporal dimension. The results highlight a continuous and marked worsening of water erosion in the Aghien watershed between 1987 and 2023, with a mean soil loss multiplied by 2.6 and an area in the extreme erosion class multiplied by more than eleven. This evolution is mainly explained by the degradation of vegetation cover, evidenced by the retreat of dense forest (from 32.4% to 9.0% of the watershed), the fourfold increase of bare soils (from 6.6% to 26.8%) and the rise of the mean C factor on emerged land (from 0.26 to 0.44). These results are consistent with the findings of several earlier studies on the neighbouring Anguédédou watershed, which highlight an increasing exposure of soils to runoff owing to uncontrolled urbanisation and the disappearance of the protective cover.
The soil-loss levels obtained in this study are nonetheless in the upper range of the values reported for comparable watersheds. This magnitude should be interpreted with methodological caution. First, the use of the Modified Fournier Index as a substitute for the R factor, adopted owing to the absence of pluviographic data 12, produces values expressed on an index scale that is not strictly equivalent to the SI units of the EI₃₀ index. The absolute soil-loss values must therefore be interpreted with care; they are chiefly relevant for analysing spatial and temporal trends. Second, the extent of the cover degradation observed in the Aghien watershed, combined with the strong rainfall erosivity recorded in 2023, helps explain the high estimated loss levels. Comparable orders of magnitude are nonetheless reported in several watersheds in tropical West Africa. In Côte d'Ivoire, high erosion levels have been observed in the N'zi watershed 3, the neighbouring Anguédédou watershed 16, the Lobo watershed 17, the Boubo coastal watershed 18 and the Baoulé savanna 19. In Benin, in the Zou watershed, soil losses range from 0 to 1,873 t ha⁻¹ yr⁻¹ depending on the sector 20, while in northern Ghana they locally reach 96 t ha⁻¹ yr⁻¹ 21. Furthermore, the diachronic approach adopted in this study echoes that applied to the Gubi watershed in northern Nigeria, which highlighted a worsening of erosion between 2000 and 2017 under the effect of deforestation and urban expansion 22, a dynamic very comparable to that of the Aghien watershed. Despite the uncertainties affecting the absolute values, the estimated soil losses greatly exceed the tolerance threshold accepted for tropical soils, of the order of 7 to 10 t ha⁻¹ yr⁻¹ 3, beyond which pedological formation no longer compensates for erosion losses. This finding confirms the highly concerning nature of erosion in this watershed and the urgency of soil- and vegetation-conservation measures.
It is finally worth qualifying the interpretation of the results. The year 2023, which shows the highest erosion levels, also corresponds to particularly heavy rainfall according to the CHIRPS data. The observed erosion peak therefore results from the combination of strongly degraded vegetation cover and exceptional rainfall aggressiveness. Moreover, several methodological limitations must be taken into account. The estimation of the R factor relies on the Modified Fournier Index, used as a substitute for the EI₃₀ index. In addition, the P factor was set to 1, in the absence of detailed information on soil-conservation practices, and the input data have heterogeneous spatial resolutions. These limitations call for absolute values to be interpreted with caution and for spatial and temporal trends to be given priority. They also open prospects for improvement, notably through the integration of high-frequency rainfall data, the acquisition of field data on conservation practices and the use of spatial datasets of more homogeneous resolution.
A central question raised by the 2023 results is the extent to which the sharp rise in soil loss reflects long-term land-cover degradation as opposed to the exceptionally wet conditions of that year, during which the R factor increased by about 62% relative to the 1987-2015 mean. To disentangle these two effects, a factorial sensitivity analysis was carried out by recombining the erosivity (R) and cover (C) layers of 2015 and 2023 while holding the time-invariant factors (K, LS, P) constant. Two additional scenarios were computed alongside the reference (2015) and observed (2023) states: one combining the 2023 cover with the 2015 rainfall (isolating the land-use effect) and one combining the 2015 cover with the 2023 rainfall (isolating the rainfall effect). This decomposition attributes the increase in mean soil loss between 2015 and 2023 to a land-use component of about 35 %, a rainfall-variability component of about 43 % and a residual interaction term of about 22 % (Table 5). In absolute terms, holding the 2015 rainfall constant while updating the cover to 2023 raises the mean loss from 34.2 to 51.8 t ha⁻¹ yr⁻¹, whereas holding the 2015 cover constant while applying the 2023 rainfall raises it to 55.6 t ha⁻¹ yr⁻¹; the two drivers therefore act with comparable magnitude, the rainfall effect being slightly the larger of the two. Because the invariant term (K·LS·P) was reconstructed from the 2015 loss map, the recombined scenarios reproduce the reference year closely but tend to overestimate the 2023 level; the decomposition is thus interpreted in relative terms (shares of the increase) rather than as exact absolute values. The results confirm that the 2023 peak is a combined signal: land-cover degradation drives a genuine, persistent upward trend in erosion, while the extreme rainfall of 2023 amplifies this trend into a short-term maximum. This distinction is important for interpretation, as the trend component is expected to persist whereas the event component may recede in drier years.
The soil-loss estimates presented here carry uncertainties that stem from the heterogeneous spatial resolution of the input data (30 m DEM, 250 m SoilGrids, and CHIRPS rainfall at coarser resolution) and from the successive processing steps. Errors in land-use classification propagate to the C factor, interpolation and product limitations affect the R factor, and the assignment of literature-based values to the K, C and P factors introduces parameter uncertainty. These sources combine multiplicatively in the RUSLE product, so that the absolute soil-loss figures should be regarded as order-of-magnitude estimates rather than exact values. Among the factors, the C factor exerts the strongest control on the temporal dynamics, and its classification-derived uncertainty is therefore the main contributor to the uncertainty of the trend; the R factor, being spatially quasi-uniform, mainly affects the overall level rather than the spatial pattern. In the absence of field measurements allowing a full error-propagation budget, these estimates are best used in a relative sense to rank areas and compare dates and the mean values should be read as indicative, with a plausible uncertainty of the order of ±40% based on literature ranges for RUSLE factor estimation. A formal uncertainty and sensitivity budget, ideally supported by ground-truth erosion measurements, is recommended for future work.
Beyond the on-site soil losses, these dynamics have direct implications for the Aghien Lagoon itself. Only a fraction of the material detached on the slopes actually reaches the water body, the remainder being redeposited along the transport pathway; nevertheless, the marked increase in gross erosion, concentrated on the steep slopes that frame the drainage network, points to a growing sediment delivery to the lagoon. This matters because eroded particles transport adsorbed pollutants nutrients and residues from peri-urban agriculture, together with contaminants carried by urban runoff from the expanding built-up areas into a water body that is earmarked as a strategic drinking-water resource for Abidjan. Increased sediment and associated pollutant inputs can accelerate the siltation of the lagoon, degrade its ecological status and raise the cost of treating its water for supply. The erosion maps produced here thus provide a spatial basis for anticipating where sediment and pollutant sources are most likely to develop within the watershed.
This study reconstructed the dynamics of soil water erosion in the Aghien Lagoon watershed between 1987 and 2023, using the RUSLE approach coupled with remote sensing and geographic information systems (GIS). The results highlight a marked worsening of erosion over this period. The mean soil loss was multiplied by 2.6, while the area subject to extreme erosion rose more than elevenfold, from 1.2% of the watershed in 1987 to 13.7% in 2023. This evolution is mainly linked to the degradation of vegetation cover, combined with rainfall aggressiveness and the topographic characteristics of the watershed. It increases the risks of sediment transfer to the Aghien Lagoon, promoting its siltation and potentially altering the quality of this water resource in a lasting manner. The maps produced, by locating the most vulnerable sectors, constitute a decision-support tool for guiding priority actions. On this basis, several concrete measures can be recommended. First, the steep, weakly vegetated slopes that frame the drainage network which concentrate the highest soil-loss values should be prioritised for reforestation and slope-stabilisation works. Second, the sectors of recent deforestation and rapid built-up expansion, particularly around the growing settlements near Bingerville, call for the promotion of agroforestry and conservation-oriented farming practices to restore protective cover on cultivated land. Third, the areas of active bare soil and construction should be subject to erosion-control requirements for building sites, so as to limit sediment export during land clearing. Implemented within an integrated watershed-management framework, such targeted interventions would help curb erosion and protect the Aghien Lagoon, a strategic drinking-water resource for Abidjan, against siltation and pollutant transfer.
| [1] | J. Poesen, "Soil erosion in the Anthropocene: research needs," Earth Surface Processes and Landforms, 43(1), 64-84, 2018. | ||
| In article | View Article | ||
| [2] | E. Roose, Érosion et ruissellement en Afrique de l'Ouest : vingt années de mesures en petites parcelles expérimentales, Travaux et Documents ORSTOM No. 78, ORSTOM, Paris, 1977. | ||
| In article | |||
| [3] | C.K. Kouakou and A.T.B. Zamblé, "Cartographie et modélisation de l'érosion hydrique dans le bassin versant du N'zi (Côte d'Ivoire) par la méthode RUSLE," Revue Hybrides, 3(5), 162-172. | ||
| In article | |||
| [4] | A. Traoré, G. Soro, E.K. Kouadio, B.S. Bamba, M.S. Oga, N. Soro and J. Biémi, "Évaluation des paramètres physiques, chimiques et bactériologiques des eaux d'une lagune tropicale en période d'étiage : la lagune Aghien (Côte d'Ivoire)," International Journal of Biological and Chemical Sciences, 6(6), 7048-7058, 2012. | ||
| In article | View Article | ||
| [5] | K.R. Effebi, A.T.B. Zamblé, J.Y. N’Tain and F. Nguetta, "Analyse et répartition spatiale des principales sources de pollution potentielle de la lagune Aghien, Sud-Est Côte d'Ivoire," Afrique Science, 13(6), 417-434, 2017. | ||
| In article | |||
| [6] | E.S. Koffi, A. Dao, D.D. Noufé, M. Ouedraogo, N.B. Yeo, L. Seguis and L.D. Gone, "Dynamics of Water Erosion in the Aghien Lagoon Catchment," ESI Preprints (European Scientific Journal, ESJ), 20(33), 187, 2024. | ||
| In article | View Article | ||
| [7] | A. Vrieling, "Satellite remote sensing for water erosion assessment: a review," CATENA, 65(1), 2-18, 2006. | ||
| In article | View Article | ||
| [8] | W.H. Wischmeier and D.D. Smith, Predicting Rainfall Erosion Losses: A Guide to Conservation Planning, USDA Agriculture Handbook No. 537, Washington DC, 1978. | ||
| In article | |||
| [9] | K.G. Renard, G.R. Foster, G.A. Weesies, D.K. McCool and D.C. Yoder, Predicting Soil Erosion by Water: A Guide to Conservation Planning with the RUSLE, USDA Agriculture Handbook No. 703, Washington DC, 1997. | ||
| In article | |||
| [10] | C. Funk, P. Peterson, M. Landsfeld, D. Pedreros, J. Verdin, S. Shukla, G. Husak, J. Rowland, L. Harrison, A. Hoell and J. Michaelsen, "The climate hazards infrared precipitation with stations," Scientific Data, 2, 150066, 2015. | ||
| In article | View Article PubMed | ||
| [11] | T. Hengl, J. Mendes de Jesus, G.B.M. Heuvelink, M. Ruiperez Gonzalez, M. Kilibarda, A. Blagotić, W. Shangguan, M.N. Wright, X. Geng, B. Bauer-Marschallinger, M.A. Guevara, R. Vargas, R.A. MacMillan, N.H. Batjes, J.G.B. Leenaars, E. Ribeiro, I. Wheeler, S. Mantel and B. Kempen, "SoilGrids250m: Global gridded soil information based on machine learning," PLoS ONE, 12(2), e0169748, 2017. | ||
| In article | View Article PubMed | ||
| [12] | H.M.J. Arnoldus, "An approximation of the rainfall factor in the Universal Soil Loss Equation," in Assessment of Erosion, M. De Boodt and D. Gabriels, Eds., Wiley, Chichester, 127-132, 1980. | ||
| In article | |||
| [13] | K.G. Renard and J.R. Freimund, "Using monthly precipitation data to estimate the R-factor in the revised USLE," Journal of Hydrology, 157(1-4), 287-306, 1994. | ||
| In article | View Article | ||
| [14] | P.J.J. Desmet and G. Govers, "A GIS procedure for automatically calculating the USLE LS factor," Journal of Soil and Water Conservation, 51(5), 427-433, 1996. | ||
| In article | View Article | ||
| [15] | D.K. McCool, L.C. Brown, G.R. Foster, C.K. Mutchler and L.D. Meyer, "Revised slope steepness factor for the Universal Soil Loss Equation," Transactions of the ASAE, 30(5), 1387-1396, 1987. | ||
| In article | View Article PubMed | ||
| [16] | A. Kamagaté, S. Diallo and K.E. N’Goran, "Quantification of Soil Erosion Using Remote Sensing and GIS: The Case of the Anguededou Watershed," American Journal of Environmental Protection, 15(2), 51-59, 2026. | ||
| In article | View Article | ||
| [17] | J.P.A. Déguy, A.Y. N'Go, H.K. Kouassi, E.G. Soro and A.T.B. Goula, "Contribution of a Geographical Information System to the Study of Soil Loss Dynamics in the Lobo Catchment (Côte d'Ivoire)," Journal of Geoscience and Environment Protection, 6(9), 183-197, 2018. | ||
| In article | View Article | ||
| [18] | L.K. Coulibaly, Q. Guan, T.V. Assoma, X. Fan and N. Coulibaly, "Coupling linear spectral unmixing and RUSLE2 to model soil erosion in the Boubo coastal watershed, Côte d'Ivoire," Ecological Indicators, 130, 108092, 2021. | ||
| In article | View Article | ||
| [19] | N. Coulibaly, B.T.A. Goula, L. Coulibaly and I. Savané, "Modélisation spatio-temporelle de l'érosion hydrique à partir de l'USLE en zone de savane tropicale humide : cas du bassin versant du Bâoulé (Côte d'Ivoire)," European Journal of Scientific Research, 16(2), 213-221, 2007. | ||
| In article | |||
| [20] | T.M. Akplo, F. Kouelo Alladassi, P. Houngnandan, A. Saïdou, M. Benmansour and H.A. Azontonde, "Mapping the risk of soil erosion using RUSLE, GIS and remote sensing: a case study of the watershed of Zou in central Benin," Moroccan Journal of Agricultural Sciences, 1(4), 2020. | ||
| In article | |||
| [21] | T.A. Adongo, W.A. Agyare, F.K. Abagale and N. Kyei-Baffour, "Spatial soil loss estimation using an integrated GIS-based Revised Universal Soil Loss Equation (RUSLE) in selected watersheds in northern Ghana," International Journal of Engineering, Science and Technology, 11(4), 58-74, 2019. | ||
| In article | View Article | ||
| [22] | A. Aldrees, S.J. El-pateh, S. Dan'azumi and S.I. Abba, "Spatio-temporal soil loss modelling using RUSLE and sediment delivery into a reservoir in a semi-arid region of northern Nigeria," Heliyon, 10(20), e38887, 2024. | ||
| In article | View Article PubMed | ||
Published with license by Science and Education Publishing, Copyright © 2026 Ouedraogo Mamadi, Dao Amidou, Diallo Seydou, Kamagate Bamory and Noufe D. Djibril
 This work is licensed under a Creative Commons Attribution 4.0 International License. To view a copy of this license, visit
http://creativecommons.org/licenses/by/4.0/
This work is licensed under a Creative Commons Attribution 4.0 International License. To view a copy of this license, visit
http://creativecommons.org/licenses/by/4.0/
| [1] | J. Poesen, "Soil erosion in the Anthropocene: research needs," Earth Surface Processes and Landforms, 43(1), 64-84, 2018. | ||
| In article | View Article | ||
| [2] | E. Roose, Érosion et ruissellement en Afrique de l'Ouest : vingt années de mesures en petites parcelles expérimentales, Travaux et Documents ORSTOM No. 78, ORSTOM, Paris, 1977. | ||
| In article | |||
| [3] | C.K. Kouakou and A.T.B. Zamblé, "Cartographie et modélisation de l'érosion hydrique dans le bassin versant du N'zi (Côte d'Ivoire) par la méthode RUSLE," Revue Hybrides, 3(5), 162-172. | ||
| In article | |||
| [4] | A. Traoré, G. Soro, E.K. Kouadio, B.S. Bamba, M.S. Oga, N. Soro and J. Biémi, "Évaluation des paramètres physiques, chimiques et bactériologiques des eaux d'une lagune tropicale en période d'étiage : la lagune Aghien (Côte d'Ivoire)," International Journal of Biological and Chemical Sciences, 6(6), 7048-7058, 2012. | ||
| In article | View Article | ||
| [5] | K.R. Effebi, A.T.B. Zamblé, J.Y. N’Tain and F. Nguetta, "Analyse et répartition spatiale des principales sources de pollution potentielle de la lagune Aghien, Sud-Est Côte d'Ivoire," Afrique Science, 13(6), 417-434, 2017. | ||
| In article | |||
| [6] | E.S. Koffi, A. Dao, D.D. Noufé, M. Ouedraogo, N.B. Yeo, L. Seguis and L.D. Gone, "Dynamics of Water Erosion in the Aghien Lagoon Catchment," ESI Preprints (European Scientific Journal, ESJ), 20(33), 187, 2024. | ||
| In article | View Article | ||
| [7] | A. Vrieling, "Satellite remote sensing for water erosion assessment: a review," CATENA, 65(1), 2-18, 2006. | ||
| In article | View Article | ||
| [8] | W.H. Wischmeier and D.D. Smith, Predicting Rainfall Erosion Losses: A Guide to Conservation Planning, USDA Agriculture Handbook No. 537, Washington DC, 1978. | ||
| In article | |||
| [9] | K.G. Renard, G.R. Foster, G.A. Weesies, D.K. McCool and D.C. Yoder, Predicting Soil Erosion by Water: A Guide to Conservation Planning with the RUSLE, USDA Agriculture Handbook No. 703, Washington DC, 1997. | ||
| In article | |||
| [10] | C. Funk, P. Peterson, M. Landsfeld, D. Pedreros, J. Verdin, S. Shukla, G. Husak, J. Rowland, L. Harrison, A. Hoell and J. Michaelsen, "The climate hazards infrared precipitation with stations," Scientific Data, 2, 150066, 2015. | ||
| In article | View Article PubMed | ||
| [11] | T. Hengl, J. Mendes de Jesus, G.B.M. Heuvelink, M. Ruiperez Gonzalez, M. Kilibarda, A. Blagotić, W. Shangguan, M.N. Wright, X. Geng, B. Bauer-Marschallinger, M.A. Guevara, R. Vargas, R.A. MacMillan, N.H. Batjes, J.G.B. Leenaars, E. Ribeiro, I. Wheeler, S. Mantel and B. Kempen, "SoilGrids250m: Global gridded soil information based on machine learning," PLoS ONE, 12(2), e0169748, 2017. | ||
| In article | View Article PubMed | ||
| [12] | H.M.J. Arnoldus, "An approximation of the rainfall factor in the Universal Soil Loss Equation," in Assessment of Erosion, M. De Boodt and D. Gabriels, Eds., Wiley, Chichester, 127-132, 1980. | ||
| In article | |||
| [13] | K.G. Renard and J.R. Freimund, "Using monthly precipitation data to estimate the R-factor in the revised USLE," Journal of Hydrology, 157(1-4), 287-306, 1994. | ||
| In article | View Article | ||
| [14] | P.J.J. Desmet and G. Govers, "A GIS procedure for automatically calculating the USLE LS factor," Journal of Soil and Water Conservation, 51(5), 427-433, 1996. | ||
| In article | View Article | ||
| [15] | D.K. McCool, L.C. Brown, G.R. Foster, C.K. Mutchler and L.D. Meyer, "Revised slope steepness factor for the Universal Soil Loss Equation," Transactions of the ASAE, 30(5), 1387-1396, 1987. | ||
| In article | View Article PubMed | ||
| [16] | A. Kamagaté, S. Diallo and K.E. N’Goran, "Quantification of Soil Erosion Using Remote Sensing and GIS: The Case of the Anguededou Watershed," American Journal of Environmental Protection, 15(2), 51-59, 2026. | ||
| In article | View Article | ||
| [17] | J.P.A. Déguy, A.Y. N'Go, H.K. Kouassi, E.G. Soro and A.T.B. Goula, "Contribution of a Geographical Information System to the Study of Soil Loss Dynamics in the Lobo Catchment (Côte d'Ivoire)," Journal of Geoscience and Environment Protection, 6(9), 183-197, 2018. | ||
| In article | View Article | ||
| [18] | L.K. Coulibaly, Q. Guan, T.V. Assoma, X. Fan and N. Coulibaly, "Coupling linear spectral unmixing and RUSLE2 to model soil erosion in the Boubo coastal watershed, Côte d'Ivoire," Ecological Indicators, 130, 108092, 2021. | ||
| In article | View Article | ||
| [19] | N. Coulibaly, B.T.A. Goula, L. Coulibaly and I. Savané, "Modélisation spatio-temporelle de l'érosion hydrique à partir de l'USLE en zone de savane tropicale humide : cas du bassin versant du Bâoulé (Côte d'Ivoire)," European Journal of Scientific Research, 16(2), 213-221, 2007. | ||
| In article | |||
| [20] | T.M. Akplo, F. Kouelo Alladassi, P. Houngnandan, A. Saïdou, M. Benmansour and H.A. Azontonde, "Mapping the risk of soil erosion using RUSLE, GIS and remote sensing: a case study of the watershed of Zou in central Benin," Moroccan Journal of Agricultural Sciences, 1(4), 2020. | ||
| In article | |||
| [21] | T.A. Adongo, W.A. Agyare, F.K. Abagale and N. Kyei-Baffour, "Spatial soil loss estimation using an integrated GIS-based Revised Universal Soil Loss Equation (RUSLE) in selected watersheds in northern Ghana," International Journal of Engineering, Science and Technology, 11(4), 58-74, 2019. | ||
| In article | View Article | ||
| [22] | A. Aldrees, S.J. El-pateh, S. Dan'azumi and S.I. Abba, "Spatio-temporal soil loss modelling using RUSLE and sediment delivery into a reservoir in a semi-arid region of northern Nigeria," Heliyon, 10(20), e38887, 2024. | ||
| In article | View Article PubMed | ||