This study investigates the variability of climatic parameters, specifically rainfall, in the Mountain District of Côte d’Ivoire. It utilizes satellite-based rainfall data spanning from 1961 to 2020, complemented by observational data from SIEREM (Système d'Informations Environnementales sur les Ressources en Eau et leur Modélisation) database for the period 1961–2000. A preliminary processing of the rainfall datasets was conducted to correct biases and address data gaps. The methodological framework combines statistical change-point detection tests (Cusum (Cummulative Sum) and Student’s t-test) with trend analysis techniques (Mann-Kendall and linear regression). Results from the change-point tests indicate no statistically significant discontinuities in the rainfall time series. However, trend analyses suggest a non-significant overall decline in precipitation across all monitoring stations. Notably, a marked reduction in monthly rainfall totals during May and June was observed, potentially offset by increased precipitation from August to October. Decadal analysis of annual cumulative rainfall over six decades reveals that precipitation consistently exceeded 1,000 mm, except at the Kouibly and Semien stations, where totals ranged from 922 mm to 981 mm during the decades 1971–1980, 1991–2000, and 2011–2020. Spatial analysis of rainfall isohyets highlights a heterogeneous distribution across the district, with rainfall patterns exhibiting an East–West gradient.
West African rainfall regimes exhibit marked interannual variability, which significantly affects rainfed agricultural systems and water resource management 1. In Côte d’Ivoire, this irregularity has resulted in average rainfall deficits ranging from 15% to 25% since the 1960s, thereby increasing the vulnerability of both subsistence and commercial farming to droughts and floods 2. In the Lobo Basin, a rainfall regime shift identified in 1966 led to a significant decline in monthly precipitation, substantially altering the seasonal distribution of rainfall 3. In the Montagnes District, annual rainfall reaches up to 1,984 mm in Danané, with a relatively constant humidity (98%) throughout the year 4. Despite the strategic importance of this area for agricultural production and national hydrological regulation, scientific literature specifically addressing the interannual evolution of cumulative rainfall remains limited. Existing studies generally favor approaches based on climate indices (e.g., SPI, RClimDex) or complex statistical models designed to project large-scale climate trends 5, 6, 7. While relevant for assessing overall climate change, such approaches partly overlook the direct descriptive analysis of observed cumulative rainfall, which is essential for an operational and accessible understanding of local dynamics. The specificity of the present study lies in its aim to address the lack of systematic descriptive analyses of annual and monthly rainfall series in the mountainous region of western Côte d’Ivoire. Year-to-year quantification of rainfall is indeed crucial for adapting agricultural practices, planning irrigation needs, and strengthening the resilience of local communities 8
The objective of this study is to conduct a descriptive analysis of monthly rainfall time series recorded between 1961 and 2020, with a specific focus on identifying long-term trends and interannual shifts. In the Montagnes District, understanding the variability of climatic parameters is crucial for adjusting development projects and anticipating the potential impacts of climate change. The overall objective is to analyze the evolution of rainfall from 1961 to 2020.
It is within this framework that the present work is situated, with the objective of providing a descriptive analysis of monthly rainfall series observed between 1960 and 2020, with particular emphasis on identifying interannual trends and shifts. In the Montagnes District, a better understanding of rainfall variability is in fact a prerequisite for adjusting development projects and anticipating the potentially devastating effects of climate change.
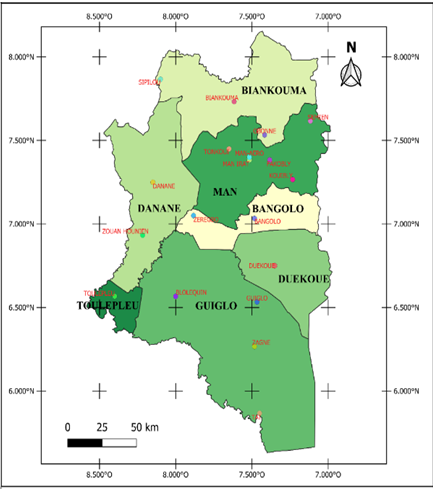
Located in western Côte d’Ivoire between latitudes 7°24’N and longitudes 7°33’W, the Montagnes District comprises the regions of Guémon, Cavally, and Tonkpi. The main cities include Man, Danané, Duékoué, Guiglo, Biankouma, Bangolo, and Toulépleu (Figure 1). The administrative capital of the district is the city of Man. This region borders both Guinea and Liberia. It covers an area of 31,050 km² and had an estimated population of 1,999,738 inhabitants eleven years ago.

The dataset consists primarily of monthly rainfall data. It includes a combination of observations from physical stations (synoptic and rain gauge stations) and virtual stations (satellite-derived data). It is important to note that the virtual stations share the same geographic coordinates as the physical stations they represent.
Data from physical stations were obtained from the SIEREM database. Stations with missing values or short time series were completed and, in some cases, extended using bias correction methods based on satellite-derived data. Figure 1 shows the spatial distribution of the stations selected for this study.
The satellite-based precipitation data were obtained from the TerraClimate database, which provides monthly climate and climatic water balance data for global terrestrial surfaces from 1958 to 2021. All data have a monthly temporal resolution and a spatial resolution of approximately 4 km. The full dataset spans the period 1958–2021 9, and is available at: http:// www. climatologylab.org/terraclimate.html. For the purposes of this study, the selected time series covers the period 1960–2020. The geographic coordinates of the virtual stations used are identical to those of the physical stations listed in the ORSTOM database.
The data processing and analysis were carried out using several complementary computational tools, enabling the manipulation of time series, the implementation of statistical tests, and the cartographic representation of results. The Trend software (v1.0.2), freely available online at www.toolkit.net.au/trend, was used to perform trend tests (Mann-Kendall and linear regression) as well as change-point detection tests (distribution-free CUSUM and Student’s t-test), due to its relevance for analyzing hydrometeorological time series. For the processing of satellite data, pre-programmed Excel spreadsheets, particularly the LinearScalingBiasCorrection v1.0 module, were employed to correct systematic biases. The maps of the study area, including station locations and spatial distributions of precipitation and temperature isohyets, were produced using the QGIS software. Additionally, RStudio was used to process datasets from the ORSTOM database, notably for imputing missing data using the specialized VIM and VIMGUI packages. Finally, the KTRLine tool (version 1.0) was used to apply the non-parametric robust Kendall-Theil regression method, which is particularly well-suited for identifying trends in series with high variability or non-normal distributions 10. Collectively, these tools ensured a rigorous and context-appropriate analysis of the complex rainfall data under investigation.
2.3. MethodsThe VIM package 11 in the R software environment was used to impute missing values in the various time series from ground-based stations for the purposes of this study. The methods selected for detecting breakpoints and trends in the rainfall time series build on the synthesis works of 12 and 13. Both parametric tests (Student’s t-test and linear regression) and non-parametric tests (Mann-Kendall and distribution-free Cusum) were employed. The combination of these approaches is particularly relevant, as parametric methods provide robust inferences under the assumption of normally distributed residuals, while non-parametric methods are distribution-free and therefore better suited to the non-stationarity and asymmetry often observed in hydroclimatic data. This complementarity enhances the reliability of the statistical assessment of trends and breakpoints in the study area
• T-Student Test
This method tests whether the means of two different periods are significantly different. The test assumes that the data are normally distributed. The student’s t test statistic is (values of the statistic can be obtained from the student’s t distribution tables):
 | (1) |
where x and y are the means of the first and second periods respectively, m and n are the number of observations in the first and second periods respectively, and S is the sample standard deviation (of the combined set of observations m and n).
• Cusum Test
This method tests whether the means in two parts of a record are different (for an unknown point of change). It is a non-parametric test (distribution-free). Applied to a time (x1, x2, x3,…, xn), the test statistic is defined as:
 | (2) |
k= 1,2,3,…,n
Were sgn (x) = 1 for x> 0; sgn (x) = 0 for x = 0 and sgn (x) = -1 for x <0 “x median is the median value of the dataset xi.
The distribution of Vk follows the two-sample Kolmogorov–Smirnov statistic (KS = (2/n) max |Vk|), with the critical values of max |Vk| given by: a=0,10 1,22 ; a=0,05 1,36
 ; a=0,01 1,63
A negative value of Vk indicates that the latter part of the record has a higher mean than the earlier part, and vice versa.
• Mann-Kendall test
This method tests whether there is a trend in the time series data. It is a non-parametric test. The n values of the time series (X1, X2, X3, ..., Xn) are replaced by their relative ranks (R1, R2, R3, ..., Rn) (from 1 for the lowest up to n). The test statistic S is:
 | (3) |
Where
sgn(x) = 1 for x > 0; sgn(x) = 0 for x = 0; sgn(x) = -1 for x < 0
If the null hypothesis H₀ is true, then S is approximately normally distributed with:
µ = 0 ; σ = n (n – 1) (2n + 5) / 18
The z statistic is therefore (the critical test statistic values for various significance levels can be obtained from the standard normal probability tables):
z = |S| / σ^0.5
A positive value of S indicates an upward trend, and vice versa.
• Linear Regression Test
This is a parametric test that assumes the data are normally distributed. It tests whether there is a linear trend by examining the relationship between time (x) and the variable of interest (y). The regression slope is estimated by:
 | (4) |
and the intercept is estimated as follows:
The test statistic S is:
Were  (5)
(5)
The test statistic S follows a student’s t-distribution with n–2 degrees of freedom under the null hypothesis (critical test statistic values for different significance levels can be obtained from Student’s t-distribution tables). The linear regression test assumes that the data are normally distributed and that the errors (deviations from the trend) are independent and identically normally distributed with a mean of zero.
If a linear trend is present in the time series, the true slope can be estimated using a simple non-parametric test known as Sen’s slope estimator. 14 developed a non-parametric procedure to estimate the trend slope from a sample of N data pairs:
 | (6) |
where Xj and Xk represent the data values at time steps “j” and “k” respectively, with “j” being greater than “k”. The median of these “N” Ti values is called the Sen’s slope estimator and is calculated using the following formulas:
If N is even: (7)
(7)
If N is odd: (8)
(8)
The sign reflects the direction of the data trend, while its value indicates the slope of the trend. To determine whether the median slope is statistically different from zero, a confidence interval should be obtained with a specific probability:
 | (9) |
Where Δ is the rate of change and β is the Sen's slope.
The Inverse Distance Weighting (IDW) method, which employs the inverse distance weighting technique, is a simple and effective interpolation approach based on the assumption that the values of variables at unsampled locations are similar to those of nearby observation points. This method assumes that each station exerts a local influence, which decreases with distance through the use of a power parameter 15. The IDW method was employed to spatially interpolate annual rainfall totals (isohyets) and mean daily temperatures in the Mountain District.
Cartographic design was carried out in the QGIS environment by integrating georeferenced data from rainfall stations and administrative boundaries of the study area. The datasets were imported, structured, and organized as thematic layers (annual rainfall, isohyets, relief, land use) 16. Spatial processing operations (rainfall interpolation, layer overlay, extraction by mask) were performed using QGIS built-in tools. Final maps were produced by applying the appropriate projection systems (UTM, WGS84), suitable symbolization, and classification of values consistent with the statistical results.
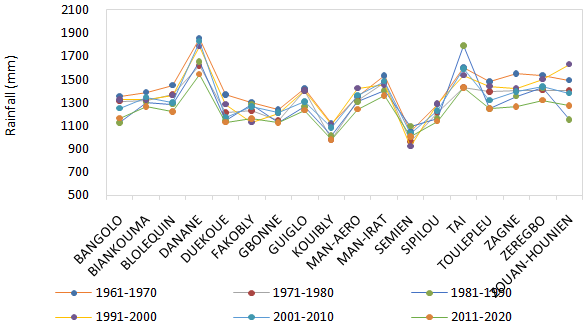
The results of the evolution of decadal annual rainfall totals over six decades in the Montagnes District are presented in Figure 2. Rainfall consistently exceeds 1,000 mm per decade across all stations, except in Kouibly and Semien, where values range between 922 mm and 981 mm during the decades 1971–1980, 1991–2000, and 2011–2020. Depending on the station, variations in rainfall totals range from approximately 50 mm to 150 mm, with the largest variation observed between the decades 1961–1970 and 2011–2020.Two stations, Danané and Taïstand out due to the magnitude of their annual rainfall totals, exceeding 1,400 mm per decade. Danané is the wettest area, recordingmore than 1,500 mm of rainfall since the 1960s. In contrast, Semien and Kouibly are the least rainy areas, with decadal annual rainfall amounts close to 1,000 mm.During the 1961–1970 decade, the district recorded an average annual rainfall height of approximately 1,500 mm. Today, the Montagnes District receives an average of about 1,300 mm annually, reflecting a noticeable decline in rainfall across the entire region.
Parametric (Student’s t-test) and non-parametric (CUSUM) tests reveal no significant change-points across all rainfall stations analyzed. However, the parametric (Mann-Kendall) and non-parametric (Linear Regression) tests indicate a non-significant downward trend across all stations at a significance level of α = 0.10. The results of these tests for all stations are summarized in Table 7.
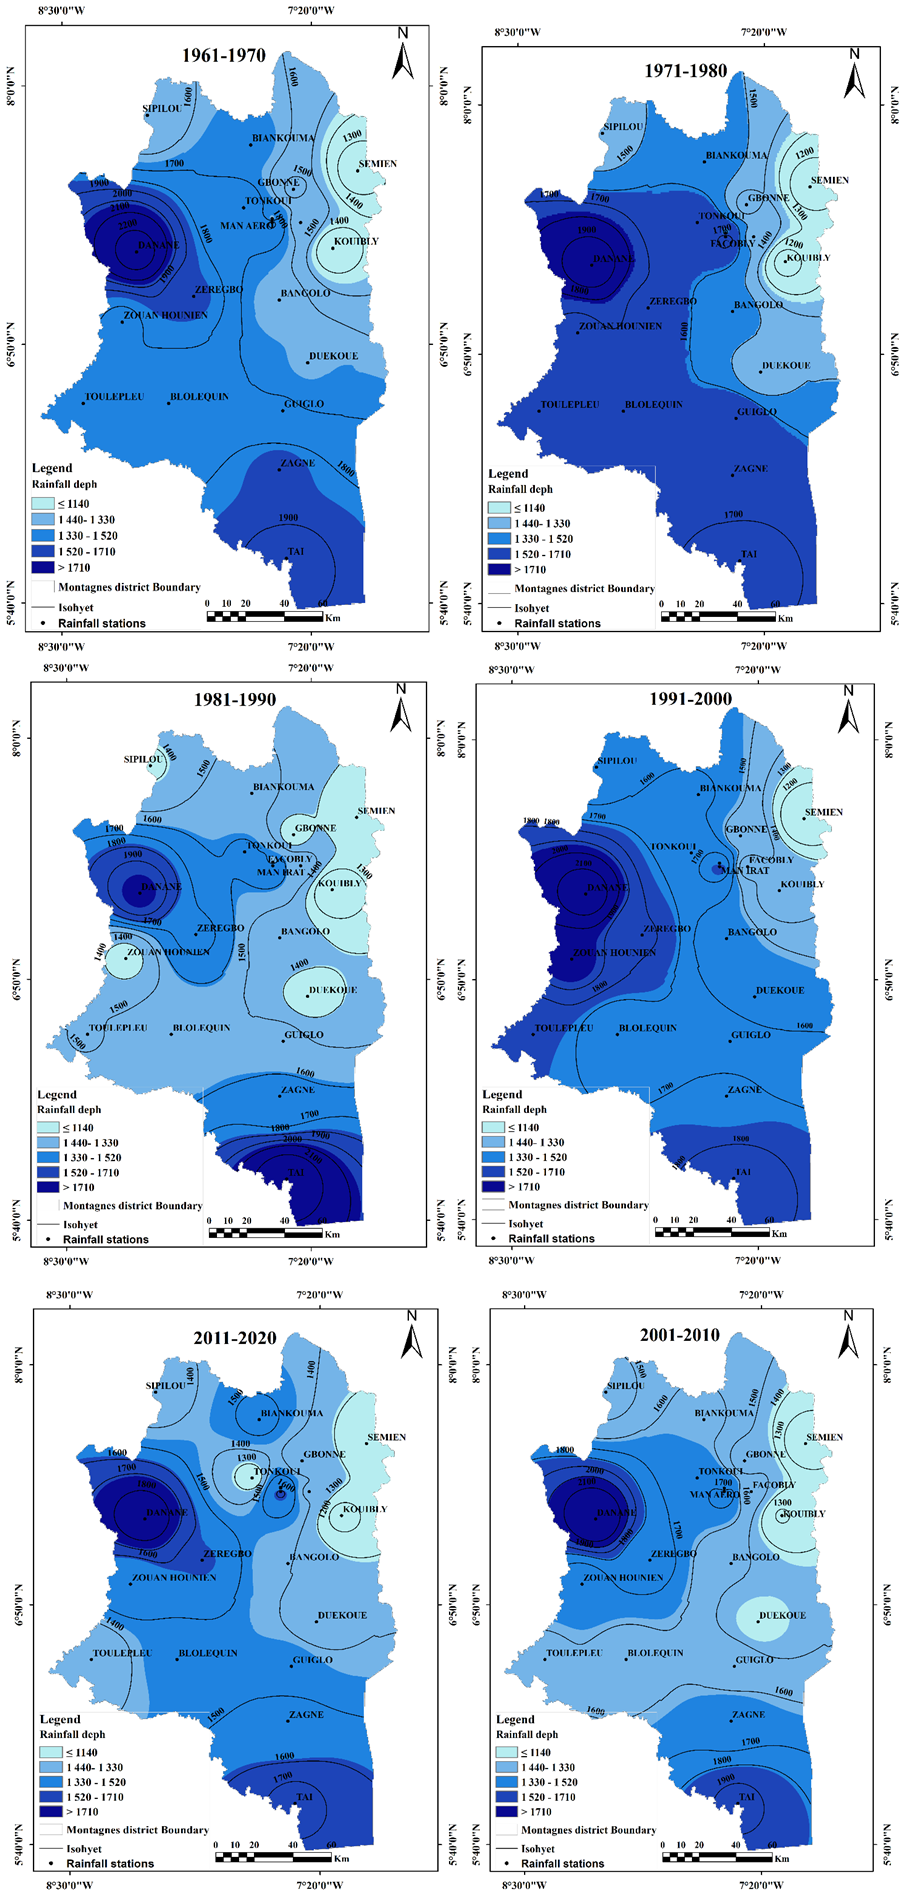
The analysis of decadal average values (1961–2020) reveals an unequal spatial distribution of rainfall across the Montagnes District (Figure 3). An increase in annual rainfall heights is observed from east to west, with three major zones: areas of high precipitation, moderate precipitation, and minimal precipitation. This spatial distribution highlights two major high-rainfall zones, namely the Danané and Taï areas, where the rainfall isohyet consistently exceeds 1,500 mm.
This is followed by a transitional or moderate precipitation zone, where average rainfall ranges between 1,500 mm and 1,300 mm. In contrast, low annual rainfall heights (1,250 mm to 1,000 mm) are observed in the extreme northeast.
There is also a noticeable variation in the distribution of decadal average annual rainfall depending on the decade. Indeed, the decades
1961–1970, 1981–1990, and 2011–2020 show a nearly identical distribution of rainfall. Furthermore, the decades 1971–1980 and 1991–2000 appear to be similar to the previous ones, except that rainfall decreases across all stations, particularly at the Taï, Zagné, Danané, and Biankouma stations.
In contrast, the decade 2001–2010 stands out from all the others due to its spatial distribution of rainfall. During this decade, heavy rainfall (over 1,710 mm) was recorded at the Danané, Zérégbo, Zagné, and Taï stations—something not observed in other decades, where only the Danané station exceeded 1,700 mm of precipitation.
Additionally, in the same decade (2001–2010), a decline in rainfall was noted at the Sipilou, Biankouma, Gbonné, Fakobly, Bangolo, and Duékoué stations compared to other decades.


The main finding of this study is the absence of any statistically significant break in rainfall series across all stations in the Montagnes District between 1961 and 2020. However, a general decreasing trend, although not statistically significant, was identified in the annual records. The lack of statistical significance may be explained by the strong interannual variability of rainfall and the relatively short length of station records, which reduces the statistical power of the test. This nuance is important, as a non-significant trend does not necessarily rule out the presence of a real signal but rather highlights the difficulty of detecting it robustly within the scope of this study.
These results partially agree with those of 17, who reported a marked decline in rainfall in the Ivorian forest zone as early as the 1970s. However, unlike that study, the present work does not confirm a “marked decline” but only a weak, statistically non-significant decrease. Similarly, 4 demonstrated a generalized decline in rainfall with breaks occurring in the early 1970s, 1980s, and 2000s, suggesting that the regional dynamic does not manifest with the same intensity across all ecological zones.
The spatial analysis of isohyets revealed an increasing rainfall gradient along an East–West axis. This distribution is largely explained by the rugged topography of western Côte d’Ivoire 18. Mountainous areas such as Danané, Zouan-Hounien, and Taï appear to be less affected by the decline in average monthly rainfall, most likely due to the combined effects of relief and residual forest cover, which are well known to influence rainfall regimes 19.
At the intra-annual scale, a sharp decrease was observed in May and June, historically the wettest months of the small rainy season. Since the 2000s, this regression has been confirmed by 20, who reported a delayed onset of rains and a shortening of the rainy season. At the same time, a redistribution of rainfall toward August to October has been detected, leading to rainfall concentration and increased intensity of extreme events. These changes have direct consequences for local agriculture, particularly in terms of sowing dates and water management for crops.
The observed changes also appear to be partly related to land cover transformations. Massive deforestation beginning in the late 1950s, associated with logging, agricultural expansion, urbanization, and mining activities, has profoundly altered vegetation dynamics 21, 22, 23. These transformations affect atmospheric feedback mechanisms and contribute to rainfall irregularities. The expansion of cocoa plantations 24, 25 and the growing mining sector have further exacerbated these disturbances.
Finally, some limitations of this study must be acknowledged. The resolution of the satellite rainfall data may smooth out local variability, particularly in mountainous areas. In addition, the imputation of missing data carries the risk of bias, especially in long series where statistical methods tend to artificially homogenize values. Further analyses incorporating regional climate indices (NAO, ENSO, Atlantic Dipole) and multi-source approaches (stations, reanalyses, models) would be necessary to refine these results.
The analysis of rainfall variability in the Montagnes district over the period 1961–2020 highlights several key findings. First, the decadal annual totals reveal a gradual decline in precipitation, from about 1,500 mm in 1961–1970 to nearly 1,300 mm on average in the most recent decade. Although this decrease is not statistically significant according to the Mann–Kendall and linear regression tests (α = 0.10), it nevertheless reflects a general downward trend in rainfall amounts. The stations of Danané and Taï stand out with annual totals exceeding 1,400 mm, confirming their status as the wettest areas, while Kouibly and Semien appear as the driest, with decadal averages close to 1,000 mm.
From a temporal perspective, stationarity tests (Cumum, t-Student) did not reveal any clear breakpoints in the series, suggesting a relative continuity in rainfall regimes. However, notable decadal fluctuations were observed, particularly during 2001–2010, which was marked by exceptionally high rainfall in several stations (Danané, Zeregbo, Zagné, and Taï).
The spatial analysis through isohyetal maps confirms an uneven distribution of rainfall, with an increasing gradient from east to west and three distinct rainfall zones : a high-rainfall zone (> 1,500 mm), a moderate-rainfall zone (1,500–1,300 mm), and a low-rainfall zone (1,250–1,000 mm). These contrasts reflect both the orographic specificities of the district and the interannual variability of rainfall regimes.
Overall, the results indicate that, despite a general downward tendency in precipitation, rainfall dynamics in the Montagnes district remain characterized by strong spatial and temporal disparities, which need to be considered in water management and agricultural planning.
| [1] | Servat, E., Paturel, J. E., Kouamé, B., Travaglio, M., Ouedraogo, M., Boyer, J. F., Lubès-Niel, H., Fritsch, J. M., Masson, J. M., & Marieu, B. (1998). Identification, caractérisation et conséquences d'une variabilité hydrologique en Afrique de l'Ouest et Centrale. IAHS Journal, 252, 323–337. | ||
| In article | |||
| [2] | Danumah, J. H., Odai, S. N., Saley, B. M., Szarzynski, J., Adjei, K., Kouamé, F. K., & Akpa, L. Y. (2016). Flood risk assessment and mapping in Abidjan district using multi-criteria analysis (AHP) model and geoinformation techniques (Côte d’Ivoire). Geoenvironmental Disasters, 3(10), 1–13. | ||
| In article | View Article | ||
| [3] | Yao, A. B., Goula, B. T. A., Kouadio, Z. A., Kouakou, K. E., Kane, A., & Sambou, S. (2012). Analysis of Climate Variability and Quantification of Water Resources in the Humid Tropical Area: The Case of the Lobo Watershed in West-Central Côte d’Ivoire. Ivorian Journal of Science and Technology, 19, 136–157. | ||
| In article | |||
| [4] | Kouao, J.-M., Tagnon, B., Koffi, B., Kouassi, A. M., Kouassi, K. A., & Gone, D. L. (2024). Variabilité climatique et tendances interannuelles récentes du climat en Afrique de l’Ouest : Cas de la Côte d’Ivoire. European Scientific Journal (ESJ), 34, 235. | ||
| In article | |||
| [5] | Bigot, S., Brou, T., & Servat, E. (2005). Variabilité pluviométrique et relations avec les indices climatiques en Afrique de l’Ouest : cas de la Côte d’Ivoire. Sécheresse, 16(1), 5–13. | ||
| In article | |||
| [6] | Kouassi, K. H., Kouadio, K. K., Koffi, B. Y., & Boko, M. (2018). Rainfall Variability and Extreme Events in Côte d’Ivoire from 1961 to 2015. Climate, 6(2), 37. | ||
| In article | |||
| [7] | Kouadio, K. K., Koné, D., Kouassi, K. H., & Aman, A. (2021). Assessment of Climate Variability and Droughts in Côte d’Ivoire Using Standardized Indices. Theoretical and Applied Climatology, 146, 1031–1047. | ||
| In article | |||
| [8] | Bérenger, K., Alexis, L. B., Kouamé, J. O. K., Valentin, B. E., Konan, J. Y. N., Gnibga, I. Y., Konaté, Y., Dibi, B., & Kouakou, L. K. (2023). Impact of climate and land use/land cover change on Lobo reservoir inflow, West-Central of Côte d'Ivoire. Journal of Hydrology: Regional Studies, 47. | ||
| In article | View Article | ||
| [9] | Abatzoglou, J. T., Dobrowski, S. Z., Parks, S. A., & Hegewisch, K. C. (2018). TerraClimate, a high-resolution global dataset of monthly climate and climatic water balance from 1958–2015. Scientific Data. | ||
| In article | View Article PubMed | ||
| [10] | Helsel, D. R., & Hirsch, R. M. (2002). Statistical methods in water resources—Hydrologic analysis and interpretation. Techniques of Water-Resources Investigations of the U.S. Geological Survey, Chap. A3, Book 4, 266–274. | ||
| In article | |||
| [11] | Templ, M., Alfons, A., & Filzmoser, P. (2012). Exploring incomplete data using visualization tools. Journal of Advances in Data Analysis and Classification, [Online First]. | ||
| In article | View Article | ||
| [12] | Lemaître, F. (2002). Recensement des tests de détection de tendances ou de ruptures adaptés à l’analyse de stationnarité des régimes de crues en France. Rapport de fin d’étude TPE, CEMAGREF, 94 p. | ||
| In article | |||
| [13] | Krishna, U. (2012). Studies in low and flood flow estimation for Irish River Catchments. PhD Thesis, National University of Ireland, Galway, 312 p. | ||
| In article | |||
| [14] | Sen, P. K. (1968). Estimates of the regression coefficient based on Kendall’s tau. Journal of the American Statistical Association, 63(324), 1379–1389. | ||
| In article | View Article | ||
| [15] | Pingale, S. M., Jat, M. K., Goyal, R. K., & Khare, D. (2014). Spatial and temporal variation of rainfall in semi-arid region of Madhya Pradesh, India. Theoretical and Applied Climatology, 115(3–4), 503–516. | ||
| In article | |||
| [16] | Savané, I. (1997). Contribution à l'étude géologique et hydrogéologique des aquifères discontinus du socle cristallin d'Odienné (Nord-Ouest de la Côte d’Ivoire). Thèse de doctorat ès Sciences Naturelles, Université d’Abidjan, Côte d’Ivoire, 386 p. | ||
| In article | |||
| [17] | Brou, Y. T. (1997). Analyse et dynamique de la pluviométrie dans le sud forestier ivoirien : recherche de corrélations entre les variables climatiques et les variables liées aux activités anthropiques. Thèse de Doctorat en Géographie, Université de Cocody, Abidjan, Côte d’Ivoire, 211 p. | ||
| In article | |||
| [18] | Lasm, T., Kouamé, F., Soro, N., Jourda, J. P. R., & Biémi, J. (2004). Analyse géostatistique de la fracturation extraite de l'imagerie spatiale aéroportée et satellitaire. Application à la région de Man-Danané (Ouest de la Côte d'Ivoire). Revue Ivoirienne des Sciences et Technologie, 5, 135–154. | ||
| In article | |||
| [19] | Yiou, P., Goubanova, K., Li, Z. X., & Nogaj, M. (2008). Weather regime dependence of extreme value statistics for summer temperature and precipitation. Nonlinear Processes in Geophysics, 15, 365–378. | ||
| In article | View Article | ||
| [20] | Kouassi, A. M., Kouamé, K. F., Koffi, Y. B., Dje, K. B., Paturel, J. E., & Oulare, S. (2010). Analyse de la variabilité climatique et de ses influences sur les régimes pluviométriques saisonniers en Afrique de l’Ouest : cas du bassin versant du N’zi (Bandama) en Côte d’Ivoire. Journals Open Edition, 138, 10400–23388. | ||
| In article | View Article | ||
| [21] | Chatelain, C., Gautier, L., & Spichiger, R. (1996). Forest history fragmentation in southern Côte d'Ivoire. Biodiversity and Conservation, 5, 37–53. | ||
| In article | View Article | ||
| [22] | Ahoussi, K. E., Koffi, Y. B., Kouassi, A. M., Soro, G., Soro, N., & Biémi, J. (2013). Étude de la variabilité hydroclimatique et de ses conséquences sur les ressources en eau du Sud forestier et agricole de la Côte d'Ivoire: cas de la région d'Abidjan-Agboville. International Journal of Pure & Applied Bioscience, 1(6), 30–50. | ||
| In article | View Article | ||
| [23] | Noufé, D., Lidon, B., Mahé, G., Servat, E., & Chaléard, J. L. (2015). Impact de l’évolution des conditions agroclimatiques sur les systèmes de culture à base de banane plantain : le cas de l’Est ivoirien. VertigO – la revue électronique en sciences de l’environnement, 15(1), 1–15. | ||
| In article | View Article | ||
| [24] | Aké-Assi, L. (1998). Impact de l’exploitation forestière et du développement agricole sur la conservation de la diversité biologique en Côte d’Ivoire. Le Flamboyant, 48, 85–87. | ||
| In article | |||
| [25] | Ruf, F., & Schroth, G. (2004). Chocolate forests and monocultures: a historical review of cocoa growing and its conflicting role in tropical deforestation and forest conservation. In Agroforestry and Biodiversity Conservation in Tropical Landscapes. Island Press, Washington, 6, 107–134. | ||
| In article | |||
Published with license by Science and Education Publishing, Copyright © 2025 COULIBALY Léréyaha, OUATTARA Ismaïla, YAO Kouadio Assemien François, OUEDRAOGO Moussa, DIALLO Seydou DAO Amidou, SORO Gneneyougo Emile and KAMAGATE Bamory
 This work is licensed under a Creative Commons Attribution 4.0 International License. To view a copy of this license, visit
http://creativecommons.org/licenses/by/4.0/
This work is licensed under a Creative Commons Attribution 4.0 International License. To view a copy of this license, visit
http://creativecommons.org/licenses/by/4.0/
| [1] | Servat, E., Paturel, J. E., Kouamé, B., Travaglio, M., Ouedraogo, M., Boyer, J. F., Lubès-Niel, H., Fritsch, J. M., Masson, J. M., & Marieu, B. (1998). Identification, caractérisation et conséquences d'une variabilité hydrologique en Afrique de l'Ouest et Centrale. IAHS Journal, 252, 323–337. | ||
| In article | |||
| [2] | Danumah, J. H., Odai, S. N., Saley, B. M., Szarzynski, J., Adjei, K., Kouamé, F. K., & Akpa, L. Y. (2016). Flood risk assessment and mapping in Abidjan district using multi-criteria analysis (AHP) model and geoinformation techniques (Côte d’Ivoire). Geoenvironmental Disasters, 3(10), 1–13. | ||
| In article | View Article | ||
| [3] | Yao, A. B., Goula, B. T. A., Kouadio, Z. A., Kouakou, K. E., Kane, A., & Sambou, S. (2012). Analysis of Climate Variability and Quantification of Water Resources in the Humid Tropical Area: The Case of the Lobo Watershed in West-Central Côte d’Ivoire. Ivorian Journal of Science and Technology, 19, 136–157. | ||
| In article | |||
| [4] | Kouao, J.-M., Tagnon, B., Koffi, B., Kouassi, A. M., Kouassi, K. A., & Gone, D. L. (2024). Variabilité climatique et tendances interannuelles récentes du climat en Afrique de l’Ouest : Cas de la Côte d’Ivoire. European Scientific Journal (ESJ), 34, 235. | ||
| In article | |||
| [5] | Bigot, S., Brou, T., & Servat, E. (2005). Variabilité pluviométrique et relations avec les indices climatiques en Afrique de l’Ouest : cas de la Côte d’Ivoire. Sécheresse, 16(1), 5–13. | ||
| In article | |||
| [6] | Kouassi, K. H., Kouadio, K. K., Koffi, B. Y., & Boko, M. (2018). Rainfall Variability and Extreme Events in Côte d’Ivoire from 1961 to 2015. Climate, 6(2), 37. | ||
| In article | |||
| [7] | Kouadio, K. K., Koné, D., Kouassi, K. H., & Aman, A. (2021). Assessment of Climate Variability and Droughts in Côte d’Ivoire Using Standardized Indices. Theoretical and Applied Climatology, 146, 1031–1047. | ||
| In article | |||
| [8] | Bérenger, K., Alexis, L. B., Kouamé, J. O. K., Valentin, B. E., Konan, J. Y. N., Gnibga, I. Y., Konaté, Y., Dibi, B., & Kouakou, L. K. (2023). Impact of climate and land use/land cover change on Lobo reservoir inflow, West-Central of Côte d'Ivoire. Journal of Hydrology: Regional Studies, 47. | ||
| In article | View Article | ||
| [9] | Abatzoglou, J. T., Dobrowski, S. Z., Parks, S. A., & Hegewisch, K. C. (2018). TerraClimate, a high-resolution global dataset of monthly climate and climatic water balance from 1958–2015. Scientific Data. | ||
| In article | View Article PubMed | ||
| [10] | Helsel, D. R., & Hirsch, R. M. (2002). Statistical methods in water resources—Hydrologic analysis and interpretation. Techniques of Water-Resources Investigations of the U.S. Geological Survey, Chap. A3, Book 4, 266–274. | ||
| In article | |||
| [11] | Templ, M., Alfons, A., & Filzmoser, P. (2012). Exploring incomplete data using visualization tools. Journal of Advances in Data Analysis and Classification, [Online First]. | ||
| In article | View Article | ||
| [12] | Lemaître, F. (2002). Recensement des tests de détection de tendances ou de ruptures adaptés à l’analyse de stationnarité des régimes de crues en France. Rapport de fin d’étude TPE, CEMAGREF, 94 p. | ||
| In article | |||
| [13] | Krishna, U. (2012). Studies in low and flood flow estimation for Irish River Catchments. PhD Thesis, National University of Ireland, Galway, 312 p. | ||
| In article | |||
| [14] | Sen, P. K. (1968). Estimates of the regression coefficient based on Kendall’s tau. Journal of the American Statistical Association, 63(324), 1379–1389. | ||
| In article | View Article | ||
| [15] | Pingale, S. M., Jat, M. K., Goyal, R. K., & Khare, D. (2014). Spatial and temporal variation of rainfall in semi-arid region of Madhya Pradesh, India. Theoretical and Applied Climatology, 115(3–4), 503–516. | ||
| In article | |||
| [16] | Savané, I. (1997). Contribution à l'étude géologique et hydrogéologique des aquifères discontinus du socle cristallin d'Odienné (Nord-Ouest de la Côte d’Ivoire). Thèse de doctorat ès Sciences Naturelles, Université d’Abidjan, Côte d’Ivoire, 386 p. | ||
| In article | |||
| [17] | Brou, Y. T. (1997). Analyse et dynamique de la pluviométrie dans le sud forestier ivoirien : recherche de corrélations entre les variables climatiques et les variables liées aux activités anthropiques. Thèse de Doctorat en Géographie, Université de Cocody, Abidjan, Côte d’Ivoire, 211 p. | ||
| In article | |||
| [18] | Lasm, T., Kouamé, F., Soro, N., Jourda, J. P. R., & Biémi, J. (2004). Analyse géostatistique de la fracturation extraite de l'imagerie spatiale aéroportée et satellitaire. Application à la région de Man-Danané (Ouest de la Côte d'Ivoire). Revue Ivoirienne des Sciences et Technologie, 5, 135–154. | ||
| In article | |||
| [19] | Yiou, P., Goubanova, K., Li, Z. X., & Nogaj, M. (2008). Weather regime dependence of extreme value statistics for summer temperature and precipitation. Nonlinear Processes in Geophysics, 15, 365–378. | ||
| In article | View Article | ||
| [20] | Kouassi, A. M., Kouamé, K. F., Koffi, Y. B., Dje, K. B., Paturel, J. E., & Oulare, S. (2010). Analyse de la variabilité climatique et de ses influences sur les régimes pluviométriques saisonniers en Afrique de l’Ouest : cas du bassin versant du N’zi (Bandama) en Côte d’Ivoire. Journals Open Edition, 138, 10400–23388. | ||
| In article | View Article | ||
| [21] | Chatelain, C., Gautier, L., & Spichiger, R. (1996). Forest history fragmentation in southern Côte d'Ivoire. Biodiversity and Conservation, 5, 37–53. | ||
| In article | View Article | ||
| [22] | Ahoussi, K. E., Koffi, Y. B., Kouassi, A. M., Soro, G., Soro, N., & Biémi, J. (2013). Étude de la variabilité hydroclimatique et de ses conséquences sur les ressources en eau du Sud forestier et agricole de la Côte d'Ivoire: cas de la région d'Abidjan-Agboville. International Journal of Pure & Applied Bioscience, 1(6), 30–50. | ||
| In article | View Article | ||
| [23] | Noufé, D., Lidon, B., Mahé, G., Servat, E., & Chaléard, J. L. (2015). Impact de l’évolution des conditions agroclimatiques sur les systèmes de culture à base de banane plantain : le cas de l’Est ivoirien. VertigO – la revue électronique en sciences de l’environnement, 15(1), 1–15. | ||
| In article | View Article | ||
| [24] | Aké-Assi, L. (1998). Impact de l’exploitation forestière et du développement agricole sur la conservation de la diversité biologique en Côte d’Ivoire. Le Flamboyant, 48, 85–87. | ||
| In article | |||
| [25] | Ruf, F., & Schroth, G. (2004). Chocolate forests and monocultures: a historical review of cocoa growing and its conflicting role in tropical deforestation and forest conservation. In Agroforestry and Biodiversity Conservation in Tropical Landscapes. Island Press, Washington, 6, 107–134. | ||
| In article | |||