Background: Many psychosocial constructs are known predictors of longevity and health-related quality of life in older adult populations. Similarly, measures of health and performance have consistently shown positive influences on related outcomes among older adults. Less is known, however, if a set of health and performance measures can concurrently predict a set of psychosocial constructs. Purpose: The aim of this study was to use advanced statistical procedures to examine the extent to which several health and performance variables can predict multiple psychosocial outcomes simultaneously. Methods: Data from 2,561 adults 50+ years of age participating in the 2022 Health and Retirement Study were used. Three (3) psychosocial measures were created that included positive affect (POS), hostility (HOST), and anxiety (ANX). The psychosocial outcomes showed acceptable reliability (α values = 0.93, 0.80, 0.81, respectively) and were subsequently converted to factor T-scores using IRT. Five (5) health and performance predictor variables included physical activity (PA), grip strength (GS), balance test (BT), body mass index (BMI), and perceived general health (GH). Health-related covariates included AGE, SEX, and marital status (MS). The primary analysis consisted of univariate and multivariate multiple regression models along with calculated structure coefficients to examine the associations between sets of measured and synthetic variables. Results: Bivariate analyses showed that older adults with high levels (versus low levels) of PA or GH had significantly (p-values < 0.0001) greater POS and lower HOST and ANX. Additionally, those with high levels of GS or BMI showed significantly (p-values < 0.0001) greater HOST. While those with high levels of GS saw significantly (p = 0.0158) lower ANX. Univariate multiple regression models revealed all predictors 1) independently related to POS except GS, BT, and MS; 2) independently related to HOST except GS and MS; and 3) independently related to ANX except PA, GS, SEX, and MS. Multivariate multiple regression found that all predictors were independently related to the set of psychosocial outcomes except GS and MS. Finally, structure coefficients for the multivariate analysis indicated GH (rS = 0.829, rS = 0.382) and PA (rS = 0.595, rS = 0.274) were the strongest correlates of the explained variance found from the synthetic predictor and outcome variates, respectively. Conversely, GS (rS = -0.101, rS = -0.047) and BT (rS = 0.140, rS = 0.065) were the weakest correlates of the explained variance found from either the synthetic predictor or outcome variates, respectively. Conclusion: Results from this study support the ability of a health and performance construct to independently predict psychosocial wellness in older adults. Self-rated health and leisure activity may be stronger predictors of total psychosocial wellness than measures of performance in this population.
The United States (US) life expectancy at birth for the total population has recently (2024) achieved an all-time high of 79.0 years 1. Notably, after reaching age 65, a US adult can expect to live an additional 19.7 years 1. This demographic shift has contributed to the so-called Graying of America and has led to the currently estimated 61.2 million US adults 65+ years of age 2, 3. These recent statistics also show that older adults outnumber youth (< 18 years) in 11 US states with a nationwide population gap of just under 12 million in 2024 3. It is not surprising, then, that the impact of aging-related health problems has become a national concern 4. In 2023, over 90 percent of older adults reported one or more chronic conditions, and over 75 percent reported multiple chronic conditions 5. Common ailments cited in this population, in order of prevalence (2023), include hypertension, hypercholesterolemia, arthritis, obesity, diabetes, cancer, and heart disease 5. The next most prevalent condition suffered among the aged is depression, with approximately 15 percent of older adults reporting the mental health condition 5.
The ability to identify the determinants of health outcomes in older populations can lead to successful intervention. There are several known predictors of healthy aging that include but are not limited to 1) behaviors such as adequate nutrition and exercise; 2) health indicators such as maintaining a healthy body weight and optimal blood lipid levels; 3) physical performance measures such as muscular strength and cardiorespiratory fitness, and 4) self-reported psychosocial outcomes such as mental health and social engagement 6, 7, 8, 9, 10. Moreover, certain psychosocial, health status, and physical performance measures have been seen to predict good health-related quality of life in older adult populations 11, 12, 13. The majority of this evidence, however, has been supported using univariate statistical analyses. That is, the examination of the influence of determinants or risk factors on only single outcome measures. Whereas the application of multivariate statistical analyses can find robust associations between sets of predictors and outcomes. Furthermore, multivariate statistical methods have an advantage of allowing the correlation between outcome variables to be captured and used to create a type of “super variable” that can represent a larger outcome construct. Despite the benefits of multivariate statistical analyses, there is a lack of research applying them to health, performance, and psychosocial data. As a consequence, few studies have examined if a set of health and performance measures can concurrently predict a set of psychosocial constructs. The purpose of this study was to use advanced multivariate statistical procedures to examine the extent to which many health and performance variables can predict many psychosocial outcome measures.
Study design and data
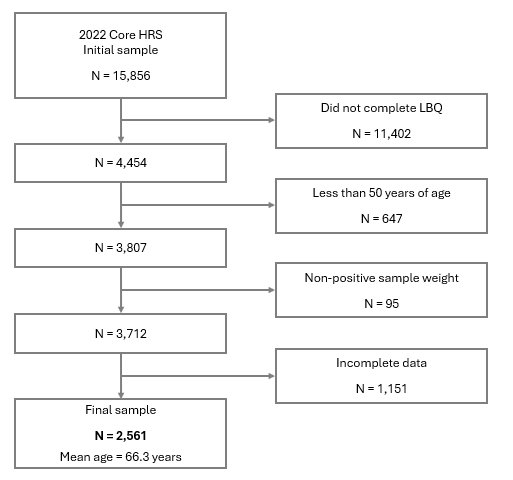
This cross-sectional study used data from the 2022 Health and Retirement Study (HRS) 14. Most of the following methods have been reported in detail elsewhere 15. Briefly, the HRS is a longitudinal survey of US adults over 50 years of age. The current study downloaded the HRS core survey and used data primarily from the demographics, physical health, physical measures, and leave-behind questionnaires (LBQ) psychosocial and lifestyle modules. The HRS has collected data since 1992 from adults 51 to 61 years of age (and spouses/partners of any age). HRS adds participants to its core survey every two years. Although the current study only used the cross-sectional 2022 core survey. The above-mentioned data modules were merged with the cross-wave tracker file, and participants were included if they were 50+ years of age and had complete psychosocial, health, and performance data with nonzero weights.
Psychosocial outcome variables
Three (3) psychosocial outcome measures were created from survey questions that included positive affect (POS), hostility (HOST), and anxiety (ANX) 16. These measures were selected because they spanned a psychosocial wellness construct by targeting traits of happiness, anger, and stressful worrying. POS assessed the degree to which a person enjoys engaging with their environment, with higher scores indicating greater enjoyment. The POS scores were created from 13 items each on a 5-category rating scale ranging from 1 = “Very much” to 5 = “Not at all.” After reverse coding, POS scores were created from a simple average across the 13 items. Participants with missing data on any item were excluded from the scoring and the study. HRS reports (2020) an internal consistency reliability of α = 0.92 for POS, and the current study-level alpha was computed at α = 0.93. HOST assessed the degree to which a person displays chronic cynicism, with higher scores indicating greater cynicism. The HOST scores were created from 5 items each on a 6-category rating scale ranging from 1 = “Strongly disagree” to 6 = “Strongly agree.” HOST scores were created from a simple average across the 5 items. Participants with missing data on any item were also excluded from the scoring and the study. HRS reports (2020) an internal consistency reliability of α = 0.80 for HOST, and the current study-level alpha was the same at α = 0.80. ANX assessed the degree to which a person displays a distressful amount of anxiety, with higher scores indicating greater anxiety. The ANX scores were created from 5 items each on a 4-category rating scale ranging from 1 = “Never” to 4 = “Most of the time.” ANX scores were created from a simple average across the 5 items. Participants with missing data on any item were also excluded from the scoring and the study. HRS reports (2020) an internal consistency reliability of α = 0.81 for ANX, and the current study-level alpha was the same at α = 0.81. Raw POS, HOST, and ANX scores were subsequently converted to factor T-scores (mean = 50, SD = 10) using a polytomous item response theory (IRT) model.
Health and performance predictor variables
Five (5) health and performance predictor variables included physical activity (PA), grip strength (GS), balance test (BT), body mass index (BMI), and perceived general health (GH). A PA score was created from 3 items targeting different intensities 15. One item asked about the frequency of vigorous-intensity activities (VPA), one item asked about the frequency of moderate-intensity activities (MPA), and the third item asked about the frequency of light-intensity activities (LPA). From the original response options, a new 3-category rating scale was developed for each above item and included “inactive (0),” “low/moderately active (1),” and “highly active (2).” Thus, the PA score included three items of vigorous (VPA), moderate (MPA), and light PA (LPA) and a total score created by summing across the three items for participants with complete data. The PA score has been validated with an acceptable reported internal consistency reliability of α = 0.79, with a current study-level ordinal alpha of α = 0.73 15.
GS (in kilograms) was assessed using a Smedley spring-type hand dynamometer, with two measurements taken for each hand in alternating fashion. The maximum grip strength test value for the participant’s dominant hand was used for GS. BT (in seconds) was assessed by having the participant stand with the heel of one foot in front of the other foot, heel touching toes, for 30 to 60 seconds. The maximum time, up to the 30-60 second limit, was used for BT. BMI (in kg/m2) was assessed using objectively measured height (in inches) and weight (in pounds) and dividing weight by the square of height and multiplying by 703. Finally, GH was assessed using a single question that asked participants to rate their health. There were five response options that included 5 = “excellent,” 4 = “very good,” 3 = “good,” 2 = “fair,” or 1 = “poor.”
Health-related covariates
Health-related covariates included AGE, SEX, and marital status (MS). Age was used as a numeric variable ranging from 54 to 99 years. Sex included 1 = “male” and 0 = “female” groups. Finally, marital status was binary and placed participants into one of two groups of either 1 = “married” or 0 = “not married” (including separated/divorced, widowed, never married, or marital status unknown).
Statistical analyses
The sample was first described by computing weighted mean estimates with standard errors (SEs) of the three outcome variables (i.e., POS, HOST, and ANX) across health and performance predictor variable (i.e., PA, GS, BT, BMI, and GH) groups. Each “high” and “low” predictor group was split at its approximate median value. Additionally, tests of mean differences were performed using the linear regression (proc surveyreg) t statistic, accounting for the complex sampling design, with each binary predictor variable. For a measure of effect size, the point-biserial correlation coefficient was reported using the standardized beta weights (β). Bivariate Pearson correlations between all study variables were also computed and statistically tested using individual linear regression (proc surveyreg) models that also accounted for the complex sampling design.
Univariate multiple regression, weighted and adjusted for the complex sampling design (proc surveyreg), was employed on each outcome variable separately with raw slopes (bs), SEs, standardized slopes (i.e., beta weights, βs), and p-values reported. Additionally, weighted and adjusted partial correlation coefficients (rpart) for each predictor with the dependent variable were computed along with measures of variance inflation factor (VIF) from weighted (non-adjusted) linear regression (proc reg) models. After outputting the predicted values from each univariate multiple regression model to a new dataset, standardized slopes and structure coefficients were computed for each predictor variable and the predicted values. Structure coefficients are the bivariate correlations between each respective predictor variable and the synthetic variate (i.e., predicted values) 17. Thus, structure coefficients tell us how strongly a predictor relates to the model's total explained variance.
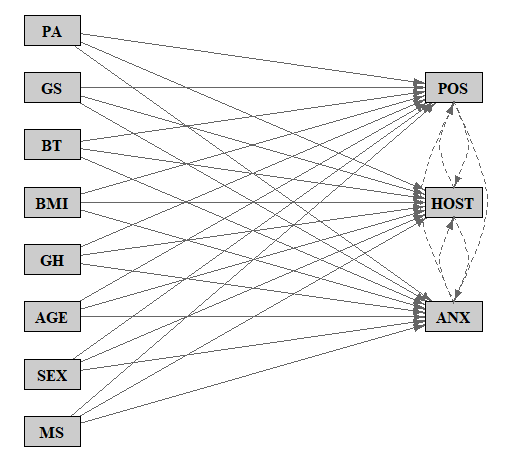
Several procedures were used to conduct the multivariate multiple regression analysis predicting the set of psychosocial outcome variables with the set of health and performance variables (See Figure 1). First, a weighted (non-adjusted) multivariate multiple regression model was employed using a linear regression model (proc reg) with an mtest option. This step allowed for overall multivariate multiple regression test statistics, including Wilks' Lambda (λ), an omnibus F statistic, the model coefficient of determination (R²), and an omnibus p-value. The omnibus test tests the null hypothesis that all predictor coefficients (except the intercept) are zero.

Second, another weighted (non-adjusted) multivariate multiple regression model (proc reg) was employed with a separate mtest option for each predictor variable. This step allowed for the calculation of a Wilks' Lambda (λ) statistic for each predictor variable as well as a p-value for each that tests the null hypothesis that its coefficients with the three outcome variables are zero while holding all other predictor variables constant.
Third, since the above multivariate analyses (proc reg) were only weighted and not adjusted for the complex sampling design, another multivariate multiple regression model was employed that properly adjusted the SEs and thus the p-values. This step was accomplished by running a structural equation model (SEM) using STATA and the SVY command. This model treated all variables as observed variables, identified all independent variables as predictors of each outcome variable, and allowed the outcome variables to correlate with each other. Postestimation commands were used to compute the adjusted p-values for each predictor’s joint association with the set of outcomes. The adjusted univariate models and correlation matrices between STATA SEM and SAS surveyreg were compared, and the exact models were confirmed before examining the multivariate tests.
Fourth, and lastly, a weighted canonical correlation analysis was employed to compute the multivariate model canonical correlation (rCC) as well as confirm the omnibus Wilks' Lambda, F-statistic, and p-value from the above mtest analysis. Additionally, the canonical scores for both sets of variables were outputted to a new dataset, and standardized slopes and structure coefficients were computed for each predictor variable (and outcome variable) for each canonical (synthetic) variate. The synthetic outcome and predictor scores were subsequently converted to T-scores and used to create graphs that highlight the main associations found in the data. Significance was set at p < 0.05 for all complex sampling-adjusted p-values. SAS version 9.4 and STATA 16.0 were used for all analyses 18, 19, 20.
A total of N = 2,561 participants had complete data with a mean age of 66.3 years (See Figure 2). Table 1 displays psychosocial outcome variable statistics across high and low health and performance categories that were previously split at their median values. This analysis reveals that older adults with high levels (versus low levels) of PA or GH had significantly (p-values < 0.0001) greater POS and lower HOST and ANX. Additionally, those with high levels of GS or BMI showed significantly (p-values < 0.0001) greater HOST. While those with high levels of GS saw significantly (p = 0.0158) lower ANX. The largest effects were seen for PA with POS (diff = 4.67, r = 0.232), HOST (diff = -2.72, r = -0.138), and ANX (diff = -2.13, r = -0.110); BMI with HOST (diff = 2.72, r = 0.142); and GH with POS (diff = 5.25, r = 0.267), HOST (diff = -3.89, r = -0.203), and ANX (diff = -4.87, r = -0.257).

Table 2 displays the bivariate Pearson correlations between all study variables. This analysis highlights the collinearity among and between the two sets (i.e., psychosocial and health & performance) of study variables. Table 3 shows the results of the univariate multiple regression analysis predicting POS with the health and performance variables. The tests for the regression coefficients indicate that all variables significantly (p-values < 0.05) predict POS with the exception of GS, BT, and MS. Examination of the structure coefficients indicates, however, that PA (rS = 0.708), GH (rS = 0.820), MS (rS = 0.233), and BT (rS = 0.1829) were the strongest predictors of the explained variance in POS.
Table 4 displays the same univariate multiple regression analysis but predicting HOST with the health and performance variables. The tests for the regression coefficients indicate that all variables significantly (p-values < 0.05) predict HOST with the exception of GS and MS. Examination of the structure coefficients indicates that PA (rS = -0.432), GH (rS = -0.612), SEX (rS = 0.484), BMI (rS = 0.441), and GS (rS = 0.387) were the strongest predictors of the explained variance in HOST. Table 5 contains the final univariate multiple regression analysis predicting ANX with the health and performance variables. The tests for the regression coefficients indicate that all variables significantly (p-values < 0.05) predict ANX with the exception of PA, GS, SEX, and MS. Examination of the structure coefficients indicates, however, that GH (rS = -0.935), PA (rS = -0.338), BT (rS = -0.261), and GS (rS = -0.226) were the strongest predictors of the explained variance in ANX.
Table 6 contains the multivariate multiple regression analysis predicting the set of psychosocial outcome variables with the set of health and performance variables. The overall MANOVA model was significant (λ = 0.7188, F = 38.17, R2 = 0.2812, p < 0.0001). The supporting complex sampling adjusted SEM model found the same univariate results as above and the same model coefficient of determination (R2 = 0.2812) as the MANOVA model. Additionally, this analysis found that all predictors were independently related to the set of psychosocial outcomes with the exception of GS (λ = 0.9966, F = 2.88, p = 0.2219) and MS (λ = 0.9981, F = 1.66, p = 0.3340). Analysis of the structure coefficients indicated GH (rS = 0.829, rS = 0.382) and PA (rS = 0.595, rS = 0.274) were the strongest correlates of the explained variance found from the synthetic predictor and outcome variates, respectively. Conversely, GS (rS = -0.101, rS = -0.047) and BT (rS = 0.140, rS = 0.065) were the weakest correlates of the explained variance found from the synthetic predictor and outcome variates, respectively.
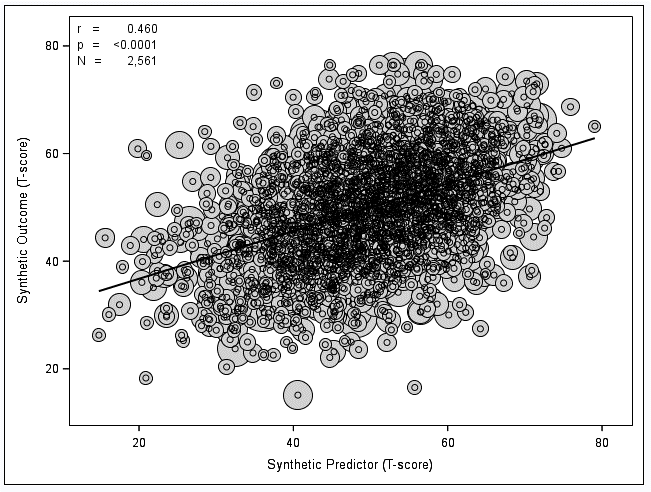
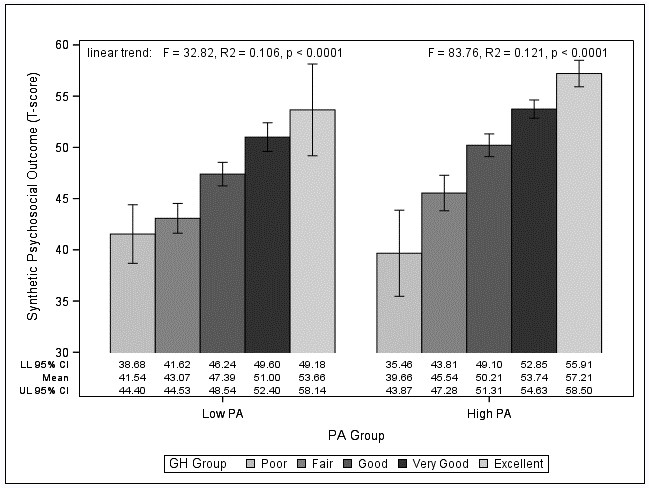
Figure 3 displays a bubble graph scatter plot for the synthetic outcome variate regressed onto the synthetic predictor variate. The larger bubbles indicate that those specific data points represent a larger estimated number of older adults in the US population. The canonical correlation coefficient for this associate was estimated to be rCC = 0.460, p < 0.0001. Figure 4 displays a clustered bar graph for means with 95% confidence intervals (CIs) of the synthetic psychosocial outcome variate across PA and GH groups. The chart indicates a direct linear trend of synthetic psychosocial trait across GH categories. Highlighting that older adults rating their health better also report more favorable psychosocial wellness. The linear trend was significant (both p-values < 0.0001) for both PA groups. The trend was stronger among those with high PA (F = 83.76, R2 = 0.121) as compared to those with low PA (F = 32.82, R2 = 0.106).


This study utilized two statistical procedures that make its findings unique and worthy of discussion. The first was the computation and reporting of structure coefficients (rS) alongside the multiple regression models. As previously mentioned, structure coefficients are the bivariate correlations between each predictor variable and the newly created synthetic variate in a regression analysis 17. Structure coefficients can be conceptually defined and computed in two different ways in the multiple regression case: 1) as the bivariate correlation calculated between a predictor variable and the outputted predicted values from the regression model or 2) as the bivariate correlation between a predictor variable and the outcome (i.e., dependent) variable divided by the model’s multiple correlation coefficient 21. The former definition is the more intuitive concept, and the latter is likely the easier calculation method. In either case, structure coefficients have the advantage of showing how strongly each predictor relates to the entire regression model 22. Thus, structure coefficients can assess a predictor variable’s total contribution to the regression model and not just its unique contribution as in the case of standardized slopes (i.e., beta weights).
In the current study, structure coefficients helped identify certain predictors as more important for their respective model’s explained variance. For example, in the regression analysis predicting POS, PA and GH were clearly the strongest predictors when examining the standardized slopes or the structure coefficients. However, in that same model, MS showed one of the weakest, in fact non-significant, standardized slopes but the third strongest structure coefficient. Thus, a conventional regression analysis would result in findings that minimized the effect of MS on POS in older adults. Since MS was coded for married (1) versus not married (0), the positive slope indicated that married adults reported greater POS. Similar findings have been found using retirement data of Europeans, where stable marriage status was predictive of greater well-being 23. The current analysis of structure coefficients saw a similar finding in the regression model predicting HOST. This model saw GS with one of the weakest, in fact non-significant, standardized slopes but a sizeable structure coefficient. Interestingly, GS was positively associated with HOST, as seen by all model statistics. This finding has been reported by others, albeit among young college-aged males 24. Nevertheless, the conventional regression analysis would have concluded that GS was not independently associated with HOST in older adult populations. In the current study’s regression analysis predicting ANX, both PA and GS had non-significant standardized slopes, yet each had relatively large structure coefficients. In the conventional regression analysis predicting HOST, results would have focused on GH, BT, and BMI as independent predictors because of the size of the standardized slopes and minimized the influence of both PA and GS. A prospective cohort study consisting of older adults 50+ years of age showed that greater hand grip strength was associated with lower odds of developing generalized anxiety disorder, thus corroborating the current findings 25. Additionally, a meta-analysis of 13 randomized-controlled trials found that PA as an intervention reduced symptoms of anxiety among older participants, again, corroborating the findings of the current study 26.
Finally, when examining the structure coefficients from the multivariate model, the structure coefficients aided the conventional analysis by providing measures of effect size to help interpret each predictor’s influence on the model. For example, the conventional multivariate analysis would focus on the size of the Wilks' Lambda (λ) statistics and their p-values. In this case GH and PA are considered the most influential predictors of the set of psychosocial outcome variables. However, the structure coefficients provide intuitive measures of effect that confirm that GH and PA are indeed the strongest variables associated with their own synthetic (predictor) variate as well as the psychosocial (outcome) variate. Although no studies appear to have used the same set of psychosocial outcomes nor have any applied multivariate analyses to a set of psychosocial outcomes in the same context, there are numerous studies that corroborate the link between PA and mental health constructs. For example, a meta-analysis study of 11 meta-analyses reported a robust link between PA and depression among older adults living in care settings 27. Moreover, a large health surveillance study of older Chinese adults showed that self-rated health was associated with both mental health and social relationships 28. Thus, the findings in the current study are indirectly supported in the literature of univariate analyses.
In a similar respect, the conventional multivariate analysis in the current study found that GS, BT, and MS were the weakest predictors of the set of psychosocial outcome variables. The structure coefficients confirmed that these predictors are in fact dimly associated with their own synthetic (predictor) variate as well as the psychosocial (outcome) variate. There are some data, however, that appear to counter these findings. For example, a casual-comparative study of adults with anxiety versus healthy controls found that participants with anxiety had greater balance deficiency and lower muscle strength 29. The univariate model of ANX in the current study did in fact see a significant association with the BT predictor variable and relatively strong structure coefficients for both BT and GS. Nonetheless, these predictors were not strongly associated with the multi-item psychosocial construct.
The second statistical procedure that makes this study’s findings unique and noteworthy is its use of the multivariate form of multiple regression. Multivariate multiple regression is an advanced statistical technique that extends multiple regression to include multiple outcome variables. The primary multivariate test examined the extent to which a linear association exists between the set of health and performance variables and the set of psychosocial variables. The findings indicate that in fact such an association does exist in the older adult population. It should be highlighted that the three outcome variables under study were examined simultaneously in the multivariate model and thus behave as a psychosocial construct. This fact makes the multivariate multiple regression model especially robust. The secondary set of multivariate tests examined the extent to which the predictor variables independently predicted the outcome variables. The results indicated that all health and performance predictors independently related to the set of psychosocial outcomes except GS and MS. Additionally, although BT was a significant predictor, it had a weak contribution when inspecting its multivariate statistics. Thus, the multivariate multiple regression analysis found that GS, BT, and MS were the weaker predictors of the psychosocial construct in older adults. Findings that are supported by the relative size of their structure coefficients.
A final point worth discussing is the differential effects observed across the three different univariate multiple regression analyses. One interesting finding is the fact that PA was found to have a much greater influence on POS than on HOST or ANX. This was observed by comparing the standardized slopes from the univariate regression as well as the structure coefficients. Not surprisingly, others have shown a strong connection between PA and positive emotions in older adults 30. However, the extent to which PA influenced positive emotions more than other psychosocial concepts has not been previously examined. Another interesting finding regarding the differences between outcome variables was that BMI had a positive association with HOST and a negative and positive relationship with ANX and POS, respectively. Said differently, BMI had contrasting effects on these traits, such that a higher BMI was associated with greater HOST but lower ANX and greater POS. There does not appear to be data supporting this specific finding in the literature. One study showed a BMI connection with peer aggression, albeit among Chinese children 31. Thus, more research is needed to better understand the association between BMI and self-reported aggression in older adults.
This research has some limitations. First, several variables were assessed using self-reported questionnaires, and thus bias and measurement error are a concern. Given this limitation, the POS, HOST, and ANX scales used in the HRS have excellent psychometric properties, which the current study-level reliability coefficients confirmed. Therefore, measurement error is likely less of an issue than one might expect from typical survey research. Similarly, the PA and GH predictor variables were assessed using self-reported survey responses. As previously mentioned, however, PA was assessed using an IRT-validated 3-item scale, and so measurement error is also less likely an issue 15. The GH predictor variable was assessed using a single self-reported question and could also be affected by measurement error. Although the single item used has a long-standing reputation of high quality for both its reliability and predictive validity 32, 33. Second, the analytical approach in this study used a complete-case analysis and therefore omitted participants with missing data from the psychosocial scales (i.e., the LBQ), the handgrip strength and balance tests, as well as any other variables included in the statistical procedures. This type of missing data treatment can be argued as biased when the missing data are missing not at random (MNAR) or missing at random (MAR). Missing data can be problematic and thus cause bias, especially in aging research because older adults are more likely to suffer cognitive, health, and functional impairments that interfere with the data collection procedures 34. While various methods exist to handle missing survey data, it was decided here to take a conservative approach and analyze only the observed responses rather than risk imputing inaccurate values 35, 36. Third, although AGE, SEX, and MS were used as health-related covariates on the predictor variable side of the regression analyses, a measure of household income was not included. Income is a known predictor of both physical and mental health status in older adult populations and is often used as a covariate in research to control for potential confounding effects 37. Despite this limitation, the self-rated health (GH) variable used in the current study is a widely accepted correlate of income and was considered here as an adequate partial proxy 38, 39, 40. Lastly, the research design used in this study was cross-sectional and correlational and therefore unable to show cause-and-effect associations. Therefore, this study is incapable of showing that the predictor variables all precede the outcome variables. As a consequence, it is likely that some health and performance assessments were influenced by the psychosocial status of the older adult participants. Future research is warranted using prospective designs to further examine the extent to which health and performance status influences psychosocial wellness. Is summary, the findings in this study should be evaluated while considering these limitations and reflected upon judiciously.
Findings from this study indicate that health and performance measures can independently predict psychosocial outcomes in older adults. Additionally, the same set of predictors also appeared valid as a construct for predicting a synthetic psychosocial variable. Notably, specific health metrics—such as self-rated health and leisure activity—were strong predictors of psychosocial wellness. Conversely, performance measures like handgrip strength and balance showed only a weak relationship.
| [1] | Xu JQ, Murphy SL, Kochanek KD, Arias E. Mortality in the United States, 2024. NCHS Data Brief. 2026 Jan; (548): 1−14. | ||
| In article | View Article | ||
| [2] | Sade RM. The graying of America: challenges and controversies. J Law Med Ethics. 2012; 40(1): 6-9. | ||
| In article | View Article PubMed | ||
| [3] | US Census Bureau. Older adults outnumber children in 11 states and nearly half of U.S. counties [Internet]. Census.gov. 2025. Available from: https: //www.census.gov/newsroom/press-releases/2025/older-adults-outnumber-children.html. | ||
| In article | |||
| [4] | US Centers for Disease Control and Prevention. Older adults [Internet]. Chronic Disease Indicators. 2024. Available from: https: //www.cdc.gov/cdi/indicator-definitions/older-adults.html | ||
| In article | |||
| [5] | Watson KB, Wiltz JL, Nhim K, Kaufmann RB, Thomas CW, Greenlund KJ. Trends in Multiple Chronic Conditions Among US Adults, By Life Stage, Behavioral Risk Factor Surveillance System, 2013–2023. Prev Chronic Dis 2025; 22: 240539. | ||
| In article | View Article PubMed | ||
| [6] | Doménech-Abella J, Mundó J, Moneta MV, et al. The impact of socioeconomic status on the association between biomedical and psychosocial well-being and all-cause mortality in older Spanish adults. Soc Psychiatry Psychiatr Epidemiol. 2018; 53(3): 259-268. | ||
| In article | View Article PubMed | ||
| [7] | Loef B, Herber GM, Wong A, et al. Predictors of healthy physiological aging across generations in a 30-year population-based cohort study: the Doetinchem Cohort Study. BMC Geriatr. 2023; 23(1): 107. Published 2023 Feb 23. | ||
| In article | View Article PubMed | ||
| [8] | Sowa A, Tobiasz-Adamczyk B, Topór-Mądry R, Poscia A, la Milia DI. Predictors of healthy ageing: public health policy targets. BMC Health Serv Res. 2016; 16 Suppl 5(Suppl 5): 289. Published 2016 Sep 5. | ||
| In article | View Article PubMed | ||
| [9] | LaMonte MJ, Hyde ET, Nguyen S, et al. Muscular Strength and Mortality in Women Aged 63 to 99 Years. JAMA Netw Open. 2026; 9(2): e2559367. Published 2026 Feb 2. | ||
| In article | View Article PubMed | ||
| [10] | Whelton, S. P., McAuley, P. A., Dardari, Z., Orimoloye, O. A., Michos, E. D., Brawner, C. A., Ehrman, J. K., Keteyian, S. J., Blaha, M. J., & Al-Mallah, M. H. (2021). Fitness and Mortality Among Persons 70 Years and Older Across the Spectrum of Cardiovascular Disease Risk Factor Burden: The FIT Project. Mayo Clinic proceedings, 96(9), 2376–2385. | ||
| In article | View Article PubMed | ||
| [11] | Paul C, Schöttker B, Brenner H, Holleczek B, Friederich HC, Wild B. Predictors of health-related quality of life in older adults over a course of twelve years - Results from a large population-based study using a machine learning approach. Int Psychogeriatr. Published online September 3, 2025. | ||
| In article | View Article PubMed | ||
| [12] | Chung, P. K., Zhao, Y., Liu, J. D., & Quach, B. (2017). A canonical correlation analysis on the relationship between functional fitness and health-related quality of life in older adults. Archives of gerontology and geriatrics, 68, 44–48. | ||
| In article | View Article PubMed | ||
| [13] | Brovold, T., Skelton, D. A., Sylliaas, H., Mowe, M., & Bergland, A. (2014). Association between health-related quality of life, physical fitness, and physical activity in older adults recently discharged from hospital. Journal of aging and physical activity, 22(3), 405–413. | ||
| In article | View Article PubMed | ||
| [14] | Sonnega, A. (2025). Using Health and Retirement Study data: A guide for new users. Survey Research Center, Institute for Social Research, University of Michigan, Ann Arbor, MI. | ||
| In article | |||
| [15] | Hart PD. (2025). Validation of A Physical Activity Scale for Older Adults Participating in the Health and Retirement Study. Research in Psychology and Behavioral Sciences. 13(1), 9-15. https: //pubs.sciepub.com/rpbs/13/1/2. | ||
| In article | View Article | ||
| [16] | Smith, J., Ryan, L., Larkina, M., Sonnega, A., & Weir, D. (2023). Psychosocial and Lifestyle Questionnaire 2006 - 2022. University of Michigan. https: //hrs.isr.umich.edu/publications/biblio/12903. | ||
| In article | |||
| [17] | Thompson B. Foundations of Behavioral Statistics. Washington, DC: American Psychological Association; 2006. | ||
| In article | |||
| [18] | SAS Institute Inc. 2023. SAS/STAT® 15.3 User’s Guide. Cary, NC: SAS Institute Inc. | ||
| In article | |||
| [19] | Lin CD. Conducting tests in multivariate regression. InProc. SAS Global Forum. April 2019 (p. 13). | ||
| In article | |||
| [20] | StataCorp. 2025. Stata 19 Structural Equation Modeling Reference Manual. College Station, TX: Stata Press. | ||
| In article | |||
| [21] | Thompson B, Borrello GM. The importance of structure coefficients in regression research. Educational and Psychological Measurement [Internet]. 1985 Jul 1; 45(2): 203–9. | ||
| In article | View Article | ||
| [22] | Kraha A, Turner H, Nimon K, Zientek LR, Henson RK. Tools to support interpreting multiple regression in the face of multicollinearity. Front Psychol. 2012; 3: 44. Published 2012 Mar 14. | ||
| In article | View Article PubMed | ||
| [23] | Mäki M, Hägglund AE, Rotkirch A, Kulathinal S, Myrskylä M. Stable Marital Histories Predict Happiness and Health Across Educational Groups. Eur J Popul. 2025; 41(1): 12. Published 2025 May 13. | ||
| In article | View Article PubMed | ||
| [24] | Gallup AC, White DD, Gallup Jr GG. Handgrip strength predicts sexual behavior, body morphology, and aggression in male college students. Evolution and human behavior. 2007 Nov 1; 28(6): 423-9. | ||
| In article | View Article | ||
| [25] | Gordon BR, McDowell CP, Lyons M, Herring MP. Associations between grip strength and generalized anxiety disorder in older adults: Results from the Irish longitudinal study on ageing. J Affect Disord. 2019; 255: 136-141. | ||
| In article | View Article PubMed | ||
| [26] | Goodarzi Z, Levy A, Whitmore C, et al. A systematic review and meta-analysis on physical activity for the treatment of anxiety in older adults. Int Psychogeriatr. 2026; 38(2): 100044. | ||
| In article | View Article PubMed | ||
| [27] | Agbangla NF, Séba MP, Bunlon F, Toulotte C, Fraser SA. Effects of Physical Activity on Physical and Mental Health of Older Adults Living in Care Settings: A Systematic Review of Meta-Analyses. Int J Environ Res Public Health. 2023; 20(13): 6226. Published 2023 Jun 26. | ||
| In article | View Article PubMed | ||
| [28] | Yang H, Deng Q, Geng Q, et al. Association of self-rated health with chronic disease, mental health symptom and social relationship in older people. Sci Rep. 2021; 11(1): 14653. Published 2021 Jul 19. | ||
| In article | View Article PubMed | ||
| [29] | Feldman R, Schreiber S, Pick CG, Been E. Gait, balance, mobility and muscle strength in people with anxiety compared to healthy individuals. Hum Mov Sci. 2019; 67: 102513. | ||
| In article | View Article PubMed | ||
| [30] | Niu L, Zhang X, Ma Y. Effects of physical activity, social capital on positive emotions in older adults-A study based on data from the 2022 CFPS survey. Front Psychol. 2025; 16: 1554741. Published 2025 Apr 9. | ||
| In article | View Article PubMed | ||
| [31] | Tao S, Wang H, Song Y, Koh D. Association of body mass index with peer aggression, reaction to peer aggression and physical activity in rural Chinese children. Front Public Health. 2025; 13: 1595005. Published 2025 May 30. | ||
| In article | View Article PubMed | ||
| [32] | DeSalvo KB, Bloser N, Reynolds K, He J, Muntner P. Mortality prediction with a single general self-rated health question. A meta-analysis. J Gen Intern Med. 2006; 21(3): 267-275. | ||
| In article | View Article PubMed | ||
| [33] | Pan Y, Pikhartova J, Bobak M, Pikhart H. Reliability and predictive validity of two scales of self-rated health in China: results from China Health and Retirement Longitudinal Study (CHARLS). BMC Public Health. 2022; 22(1): 1863. Published 2022 Oct 5. | ||
| In article | View Article PubMed | ||
| [34] | Hardy SE, Allore H, Studenski SA. Missing data: a special challenge in aging research. J Am Geriatr Soc. 2009; 57(4): 722-729. | ||
| In article | View Article PubMed | ||
| [35] | Little, R. J. A., & Rubin, D. B. (2019). Statistical Analysis with Missing Data (3rd ed.). Hoboken, NJ: John Wiley & Sons. | ||
| In article | View Article | ||
| [36] | Groves, R. M., Fowler Jr, F. J., Couper, M. P., Lepkowski, J. M., Singer, E., & Tourangeau, R. (2009). Survey Methodology (2nd ed.). Hoboken, NJ: John Wiley & Sons. | ||
| In article | |||
| [37] | Ju T, Pan M. Heterogeneous Effects of Income on Physical and Mental Health of the Elderly: A Regression Discontinuity Design Based on China's New Rural Pension Scheme. Int J Environ Res Public Health. 2025; 22(11): 1709. Published 2025 Nov 13. | ||
| In article | View Article PubMed | ||
| [38] | Bauknecht J, Merkel S. Differences in self-reported health between low- and high-income groups in pre-retirement age and retirement age. A cohort study based on the European Social Survey. Health Policy Open. 2022; 3: 100070. Published 2022 Apr 11. | ||
| In article | View Article PubMed | ||
| [39] | Byun M, Kim E, Ahn H. Factors Contributing to Poor Self-Rated Health in Older Adults with Lower Income. Healthcare (Basel). 2021; 9(11): 1515. Published 2021 Nov 6. | ||
| In article | View Article PubMed | ||
| [40] | Syre, S. (2018, June 28). How income affects perceived health of older Americans. LeadingAge LTSS Center @UMass Boston. https: //www.ltsscenter.org/how-income-affects-perceived-health-of-older-americans/. | ||
| In article | |||
Published with license by Science and Education Publishing, Copyright © 2026 Peter D. Hart
 This work is licensed under a Creative Commons Attribution 4.0 International License. To view a copy of this license, visit
http://creativecommons.org/licenses/by/4.0/
This work is licensed under a Creative Commons Attribution 4.0 International License. To view a copy of this license, visit
http://creativecommons.org/licenses/by/4.0/
| [1] | Xu JQ, Murphy SL, Kochanek KD, Arias E. Mortality in the United States, 2024. NCHS Data Brief. 2026 Jan; (548): 1−14. | ||
| In article | View Article | ||
| [2] | Sade RM. The graying of America: challenges and controversies. J Law Med Ethics. 2012; 40(1): 6-9. | ||
| In article | View Article PubMed | ||
| [3] | US Census Bureau. Older adults outnumber children in 11 states and nearly half of U.S. counties [Internet]. Census.gov. 2025. Available from: https: //www.census.gov/newsroom/press-releases/2025/older-adults-outnumber-children.html. | ||
| In article | |||
| [4] | US Centers for Disease Control and Prevention. Older adults [Internet]. Chronic Disease Indicators. 2024. Available from: https: //www.cdc.gov/cdi/indicator-definitions/older-adults.html | ||
| In article | |||
| [5] | Watson KB, Wiltz JL, Nhim K, Kaufmann RB, Thomas CW, Greenlund KJ. Trends in Multiple Chronic Conditions Among US Adults, By Life Stage, Behavioral Risk Factor Surveillance System, 2013–2023. Prev Chronic Dis 2025; 22: 240539. | ||
| In article | View Article PubMed | ||
| [6] | Doménech-Abella J, Mundó J, Moneta MV, et al. The impact of socioeconomic status on the association between biomedical and psychosocial well-being and all-cause mortality in older Spanish adults. Soc Psychiatry Psychiatr Epidemiol. 2018; 53(3): 259-268. | ||
| In article | View Article PubMed | ||
| [7] | Loef B, Herber GM, Wong A, et al. Predictors of healthy physiological aging across generations in a 30-year population-based cohort study: the Doetinchem Cohort Study. BMC Geriatr. 2023; 23(1): 107. Published 2023 Feb 23. | ||
| In article | View Article PubMed | ||
| [8] | Sowa A, Tobiasz-Adamczyk B, Topór-Mądry R, Poscia A, la Milia DI. Predictors of healthy ageing: public health policy targets. BMC Health Serv Res. 2016; 16 Suppl 5(Suppl 5): 289. Published 2016 Sep 5. | ||
| In article | View Article PubMed | ||
| [9] | LaMonte MJ, Hyde ET, Nguyen S, et al. Muscular Strength and Mortality in Women Aged 63 to 99 Years. JAMA Netw Open. 2026; 9(2): e2559367. Published 2026 Feb 2. | ||
| In article | View Article PubMed | ||
| [10] | Whelton, S. P., McAuley, P. A., Dardari, Z., Orimoloye, O. A., Michos, E. D., Brawner, C. A., Ehrman, J. K., Keteyian, S. J., Blaha, M. J., & Al-Mallah, M. H. (2021). Fitness and Mortality Among Persons 70 Years and Older Across the Spectrum of Cardiovascular Disease Risk Factor Burden: The FIT Project. Mayo Clinic proceedings, 96(9), 2376–2385. | ||
| In article | View Article PubMed | ||
| [11] | Paul C, Schöttker B, Brenner H, Holleczek B, Friederich HC, Wild B. Predictors of health-related quality of life in older adults over a course of twelve years - Results from a large population-based study using a machine learning approach. Int Psychogeriatr. Published online September 3, 2025. | ||
| In article | View Article PubMed | ||
| [12] | Chung, P. K., Zhao, Y., Liu, J. D., & Quach, B. (2017). A canonical correlation analysis on the relationship between functional fitness and health-related quality of life in older adults. Archives of gerontology and geriatrics, 68, 44–48. | ||
| In article | View Article PubMed | ||
| [13] | Brovold, T., Skelton, D. A., Sylliaas, H., Mowe, M., & Bergland, A. (2014). Association between health-related quality of life, physical fitness, and physical activity in older adults recently discharged from hospital. Journal of aging and physical activity, 22(3), 405–413. | ||
| In article | View Article PubMed | ||
| [14] | Sonnega, A. (2025). Using Health and Retirement Study data: A guide for new users. Survey Research Center, Institute for Social Research, University of Michigan, Ann Arbor, MI. | ||
| In article | |||
| [15] | Hart PD. (2025). Validation of A Physical Activity Scale for Older Adults Participating in the Health and Retirement Study. Research in Psychology and Behavioral Sciences. 13(1), 9-15. https: //pubs.sciepub.com/rpbs/13/1/2. | ||
| In article | View Article | ||
| [16] | Smith, J., Ryan, L., Larkina, M., Sonnega, A., & Weir, D. (2023). Psychosocial and Lifestyle Questionnaire 2006 - 2022. University of Michigan. https: //hrs.isr.umich.edu/publications/biblio/12903. | ||
| In article | |||
| [17] | Thompson B. Foundations of Behavioral Statistics. Washington, DC: American Psychological Association; 2006. | ||
| In article | |||
| [18] | SAS Institute Inc. 2023. SAS/STAT® 15.3 User’s Guide. Cary, NC: SAS Institute Inc. | ||
| In article | |||
| [19] | Lin CD. Conducting tests in multivariate regression. InProc. SAS Global Forum. April 2019 (p. 13). | ||
| In article | |||
| [20] | StataCorp. 2025. Stata 19 Structural Equation Modeling Reference Manual. College Station, TX: Stata Press. | ||
| In article | |||
| [21] | Thompson B, Borrello GM. The importance of structure coefficients in regression research. Educational and Psychological Measurement [Internet]. 1985 Jul 1; 45(2): 203–9. | ||
| In article | View Article | ||
| [22] | Kraha A, Turner H, Nimon K, Zientek LR, Henson RK. Tools to support interpreting multiple regression in the face of multicollinearity. Front Psychol. 2012; 3: 44. Published 2012 Mar 14. | ||
| In article | View Article PubMed | ||
| [23] | Mäki M, Hägglund AE, Rotkirch A, Kulathinal S, Myrskylä M. Stable Marital Histories Predict Happiness and Health Across Educational Groups. Eur J Popul. 2025; 41(1): 12. Published 2025 May 13. | ||
| In article | View Article PubMed | ||
| [24] | Gallup AC, White DD, Gallup Jr GG. Handgrip strength predicts sexual behavior, body morphology, and aggression in male college students. Evolution and human behavior. 2007 Nov 1; 28(6): 423-9. | ||
| In article | View Article | ||
| [25] | Gordon BR, McDowell CP, Lyons M, Herring MP. Associations between grip strength and generalized anxiety disorder in older adults: Results from the Irish longitudinal study on ageing. J Affect Disord. 2019; 255: 136-141. | ||
| In article | View Article PubMed | ||
| [26] | Goodarzi Z, Levy A, Whitmore C, et al. A systematic review and meta-analysis on physical activity for the treatment of anxiety in older adults. Int Psychogeriatr. 2026; 38(2): 100044. | ||
| In article | View Article PubMed | ||
| [27] | Agbangla NF, Séba MP, Bunlon F, Toulotte C, Fraser SA. Effects of Physical Activity on Physical and Mental Health of Older Adults Living in Care Settings: A Systematic Review of Meta-Analyses. Int J Environ Res Public Health. 2023; 20(13): 6226. Published 2023 Jun 26. | ||
| In article | View Article PubMed | ||
| [28] | Yang H, Deng Q, Geng Q, et al. Association of self-rated health with chronic disease, mental health symptom and social relationship in older people. Sci Rep. 2021; 11(1): 14653. Published 2021 Jul 19. | ||
| In article | View Article PubMed | ||
| [29] | Feldman R, Schreiber S, Pick CG, Been E. Gait, balance, mobility and muscle strength in people with anxiety compared to healthy individuals. Hum Mov Sci. 2019; 67: 102513. | ||
| In article | View Article PubMed | ||
| [30] | Niu L, Zhang X, Ma Y. Effects of physical activity, social capital on positive emotions in older adults-A study based on data from the 2022 CFPS survey. Front Psychol. 2025; 16: 1554741. Published 2025 Apr 9. | ||
| In article | View Article PubMed | ||
| [31] | Tao S, Wang H, Song Y, Koh D. Association of body mass index with peer aggression, reaction to peer aggression and physical activity in rural Chinese children. Front Public Health. 2025; 13: 1595005. Published 2025 May 30. | ||
| In article | View Article PubMed | ||
| [32] | DeSalvo KB, Bloser N, Reynolds K, He J, Muntner P. Mortality prediction with a single general self-rated health question. A meta-analysis. J Gen Intern Med. 2006; 21(3): 267-275. | ||
| In article | View Article PubMed | ||
| [33] | Pan Y, Pikhartova J, Bobak M, Pikhart H. Reliability and predictive validity of two scales of self-rated health in China: results from China Health and Retirement Longitudinal Study (CHARLS). BMC Public Health. 2022; 22(1): 1863. Published 2022 Oct 5. | ||
| In article | View Article PubMed | ||
| [34] | Hardy SE, Allore H, Studenski SA. Missing data: a special challenge in aging research. J Am Geriatr Soc. 2009; 57(4): 722-729. | ||
| In article | View Article PubMed | ||
| [35] | Little, R. J. A., & Rubin, D. B. (2019). Statistical Analysis with Missing Data (3rd ed.). Hoboken, NJ: John Wiley & Sons. | ||
| In article | View Article | ||
| [36] | Groves, R. M., Fowler Jr, F. J., Couper, M. P., Lepkowski, J. M., Singer, E., & Tourangeau, R. (2009). Survey Methodology (2nd ed.). Hoboken, NJ: John Wiley & Sons. | ||
| In article | |||
| [37] | Ju T, Pan M. Heterogeneous Effects of Income on Physical and Mental Health of the Elderly: A Regression Discontinuity Design Based on China's New Rural Pension Scheme. Int J Environ Res Public Health. 2025; 22(11): 1709. Published 2025 Nov 13. | ||
| In article | View Article PubMed | ||
| [38] | Bauknecht J, Merkel S. Differences in self-reported health between low- and high-income groups in pre-retirement age and retirement age. A cohort study based on the European Social Survey. Health Policy Open. 2022; 3: 100070. Published 2022 Apr 11. | ||
| In article | View Article PubMed | ||
| [39] | Byun M, Kim E, Ahn H. Factors Contributing to Poor Self-Rated Health in Older Adults with Lower Income. Healthcare (Basel). 2021; 9(11): 1515. Published 2021 Nov 6. | ||
| In article | View Article PubMed | ||
| [40] | Syre, S. (2018, June 28). How income affects perceived health of older Americans. LeadingAge LTSS Center @UMass Boston. https: //www.ltsscenter.org/how-income-affects-perceived-health-of-older-americans/. | ||
| In article | |||